Appendix 1: List of CORVI Indicators for Aruba
Climate change is reshaping environmental conditions and development realities in small island nations, and Aruba is no exception. As resilience planning becomes more urgent, the CORVI indicators for Aruba provide one of the most critical tools for understanding how climate risks interact across the island’s environment, economy, and society. This appendix outlines the purpose, structure, and application of these indicators so policymakers, researchers, community leaders, and the public can better interpret resilience priorities.
The Climate and Ocean Risk Vulnerability Index (CORVI) is a global decision-support tool developed by the Stimson Center to evaluate climate-related risks in coastal cities and small islands. Aruba’s CORVI assessment analyzes multiple data points, expert interviews, and historical trends to determine the vulnerability of coastal systems and identify opportunities for adaptation.
Purpose of the CORVI Indicators for Aruba
The CORVI indicators for Aruba are designed to measure how ecological, social, and economic systems respond to climate pressures. Unlike single-variable climate models, CORVI captures the interconnected nature of climate vulnerability:


- How coral reef decline affects tourism and coastal protection
- How population growth strains infrastructure and natural systems
- How extreme heat and drought impact public health and water security
This makes the tool especially valuable for small islands where local ecosystems are directly linked to economic stability and community well-being.
Structure of the CORVI Indicators for Aruba
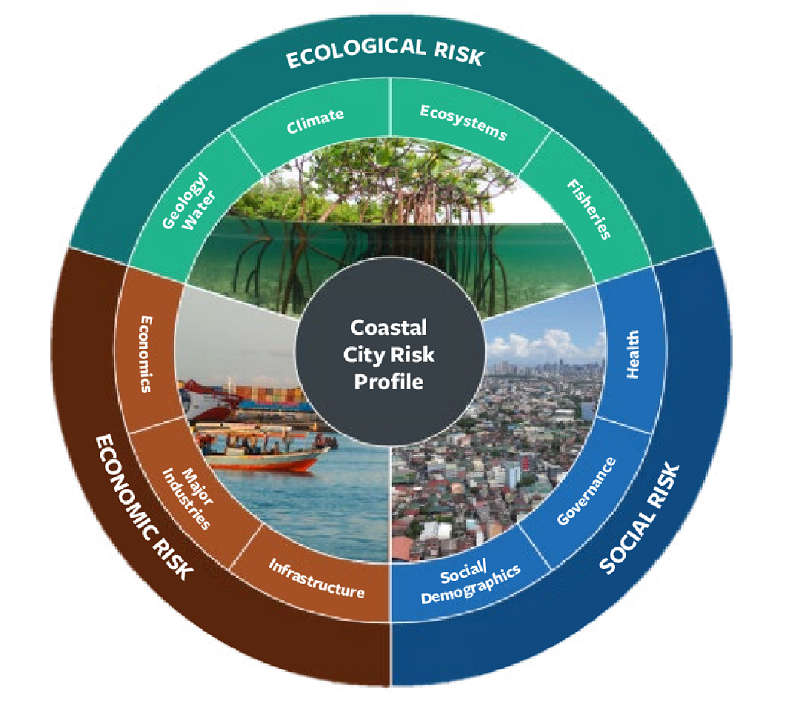
The index includes 94 indicators, grouped into three major risk areas which branch into 10 thematic categories:
| Risk Area | Categories |
|---|---|
| Ecological Risk | Climate, Ecosystems, Fisheries, Geology & Water |
| Social Risk | Social & Demographic Trends, Health, Governance |
| Economic Risk | Infrastructure, Economics, Major Industries |
These categories collectively show where the island is most vulnerable and where strategic action is most urgent.
Ecological CORVI Indicators for Aruba
Climate-Related Indicators
These indicators track heat, drought, storms, and sea-level changes, which directly influence ecosystems and human health.
Examples include:


- Total number of extreme heat events
- Frequency and severity of droughts
- Sea surface temperature rise
- Rate of coastal flooding
- Sea level rise projections
Aruba’s exposure to increasing heat extremes is well documented. For context, the World Health Organization highlights the health risks of extreme heat.
Ecosystem Health Indicators
These indicators assess the condition of natural protective systems, which function as living infrastructure.
They include:
- Coral reef health and coverage
- Mangrove area and fragmentation
- Seagrass bed health
- Sand dune stability
Coral reef decline reduces both fishery productivity and coastal wave buffering by up to 97%.
Fisheries Indicators
These measure:
- Fish stock health
- Sustainable fisheries management capacity
- Unreported fishing activity
Sustainable fisheries are crucial to food security and cultural identity.
Water and Land Indicators
These include:
- Availability of arable land
- Water quality
- Saltwater intrusion in aquifers
Given Aruba’s limited freshwater, these indicators reveal critical vulnerabilities.


Social CORVI Indicators for Aruba
Demographic and Settlement Indicators
These indicators examine how population patterns intersect with environmental stress.
Examples:
- National population density
- Proportion of migrants and tourism-driven population
- Growth of informal settlements in coastal zones
Public Health Indicators
These assess:
- Mortality from heat and chronic diseases
- Hospital and emergency service accessibility
The Caribbean holds the highest burden of non-communicable diseases among developing regions.
Governance and Institutional Capacity
Indicators include:
- National climate adaptation planning capacity
- Regulatory enforcement strength
- Community participation in resilience decision-making
Effective governance is critical for sustainable adaptation success.
Economic CORVI Indicators for Aruba
Infrastructure Vulnerability Indicators
These address:
- Coastal infrastructure exposure
- Road, port, airport, and grid resilience
- Wastewater treatment capacity
Aruba’s coastal infrastructure is highly exposed due to its shoreline tourism model.
Economic Structure Indicators
These measure:
- Tourism dependence
- Import reliance
- Income inequality
At present, more than 70% of Aruba’s GDP is tied to tourism, making it extremely climate-sensitive.
Industry Resilience Indicators
These include:
- Economic diversification readiness
- Emerging green and blue economy potential
Future climate resilience depends heavily on economic diversification.
Conclusion
The CORVI indicators for Aruba provide a data-driven map of the island’s climate resilience challenges and opportunities. By revealing how ecological decline, social vulnerability, and economic pressures intersect, the indicators help shape stronger, more strategic adaptation actions.
These insights are not simply academic they are essential for decision-making that protects Aruba’s communities, ecosystems, and future prosperity.
For more local news, visit us at Aruba Online News and follow our social media pages. Share your news with us by sending it to info@arubaonline.news.