
Aruba Tourism Performance 2025 Overview
Aruba tourism performance 2025 demonstrates sustained growth supported by strong visitor arrivals, rising travel demand, and increased international spending. According to the latest tourism and financial indicators, Aruba continues to outperform regional competitors while attracting travelers from diverse global markets.
Moreover, consistent airline connectivity, expanding accommodation options, and enhanced visitor experiences contributed to positive results. As a result, Aruba tourism`s performance 2025 reflects both volume growth and stable visitor confidence.
Aruba tourism performance 2025 reflects strong momentum as Visa card spending, stay-over arrivals, and market diversification continue to rise. The latest data highlights resilient travel demand, increased visitor transactions, and solid growth across North America and South America, reinforcing Aruba’s position as a leading Caribbean destination.


Visa Credit Card Spending Trends in Q3 2025
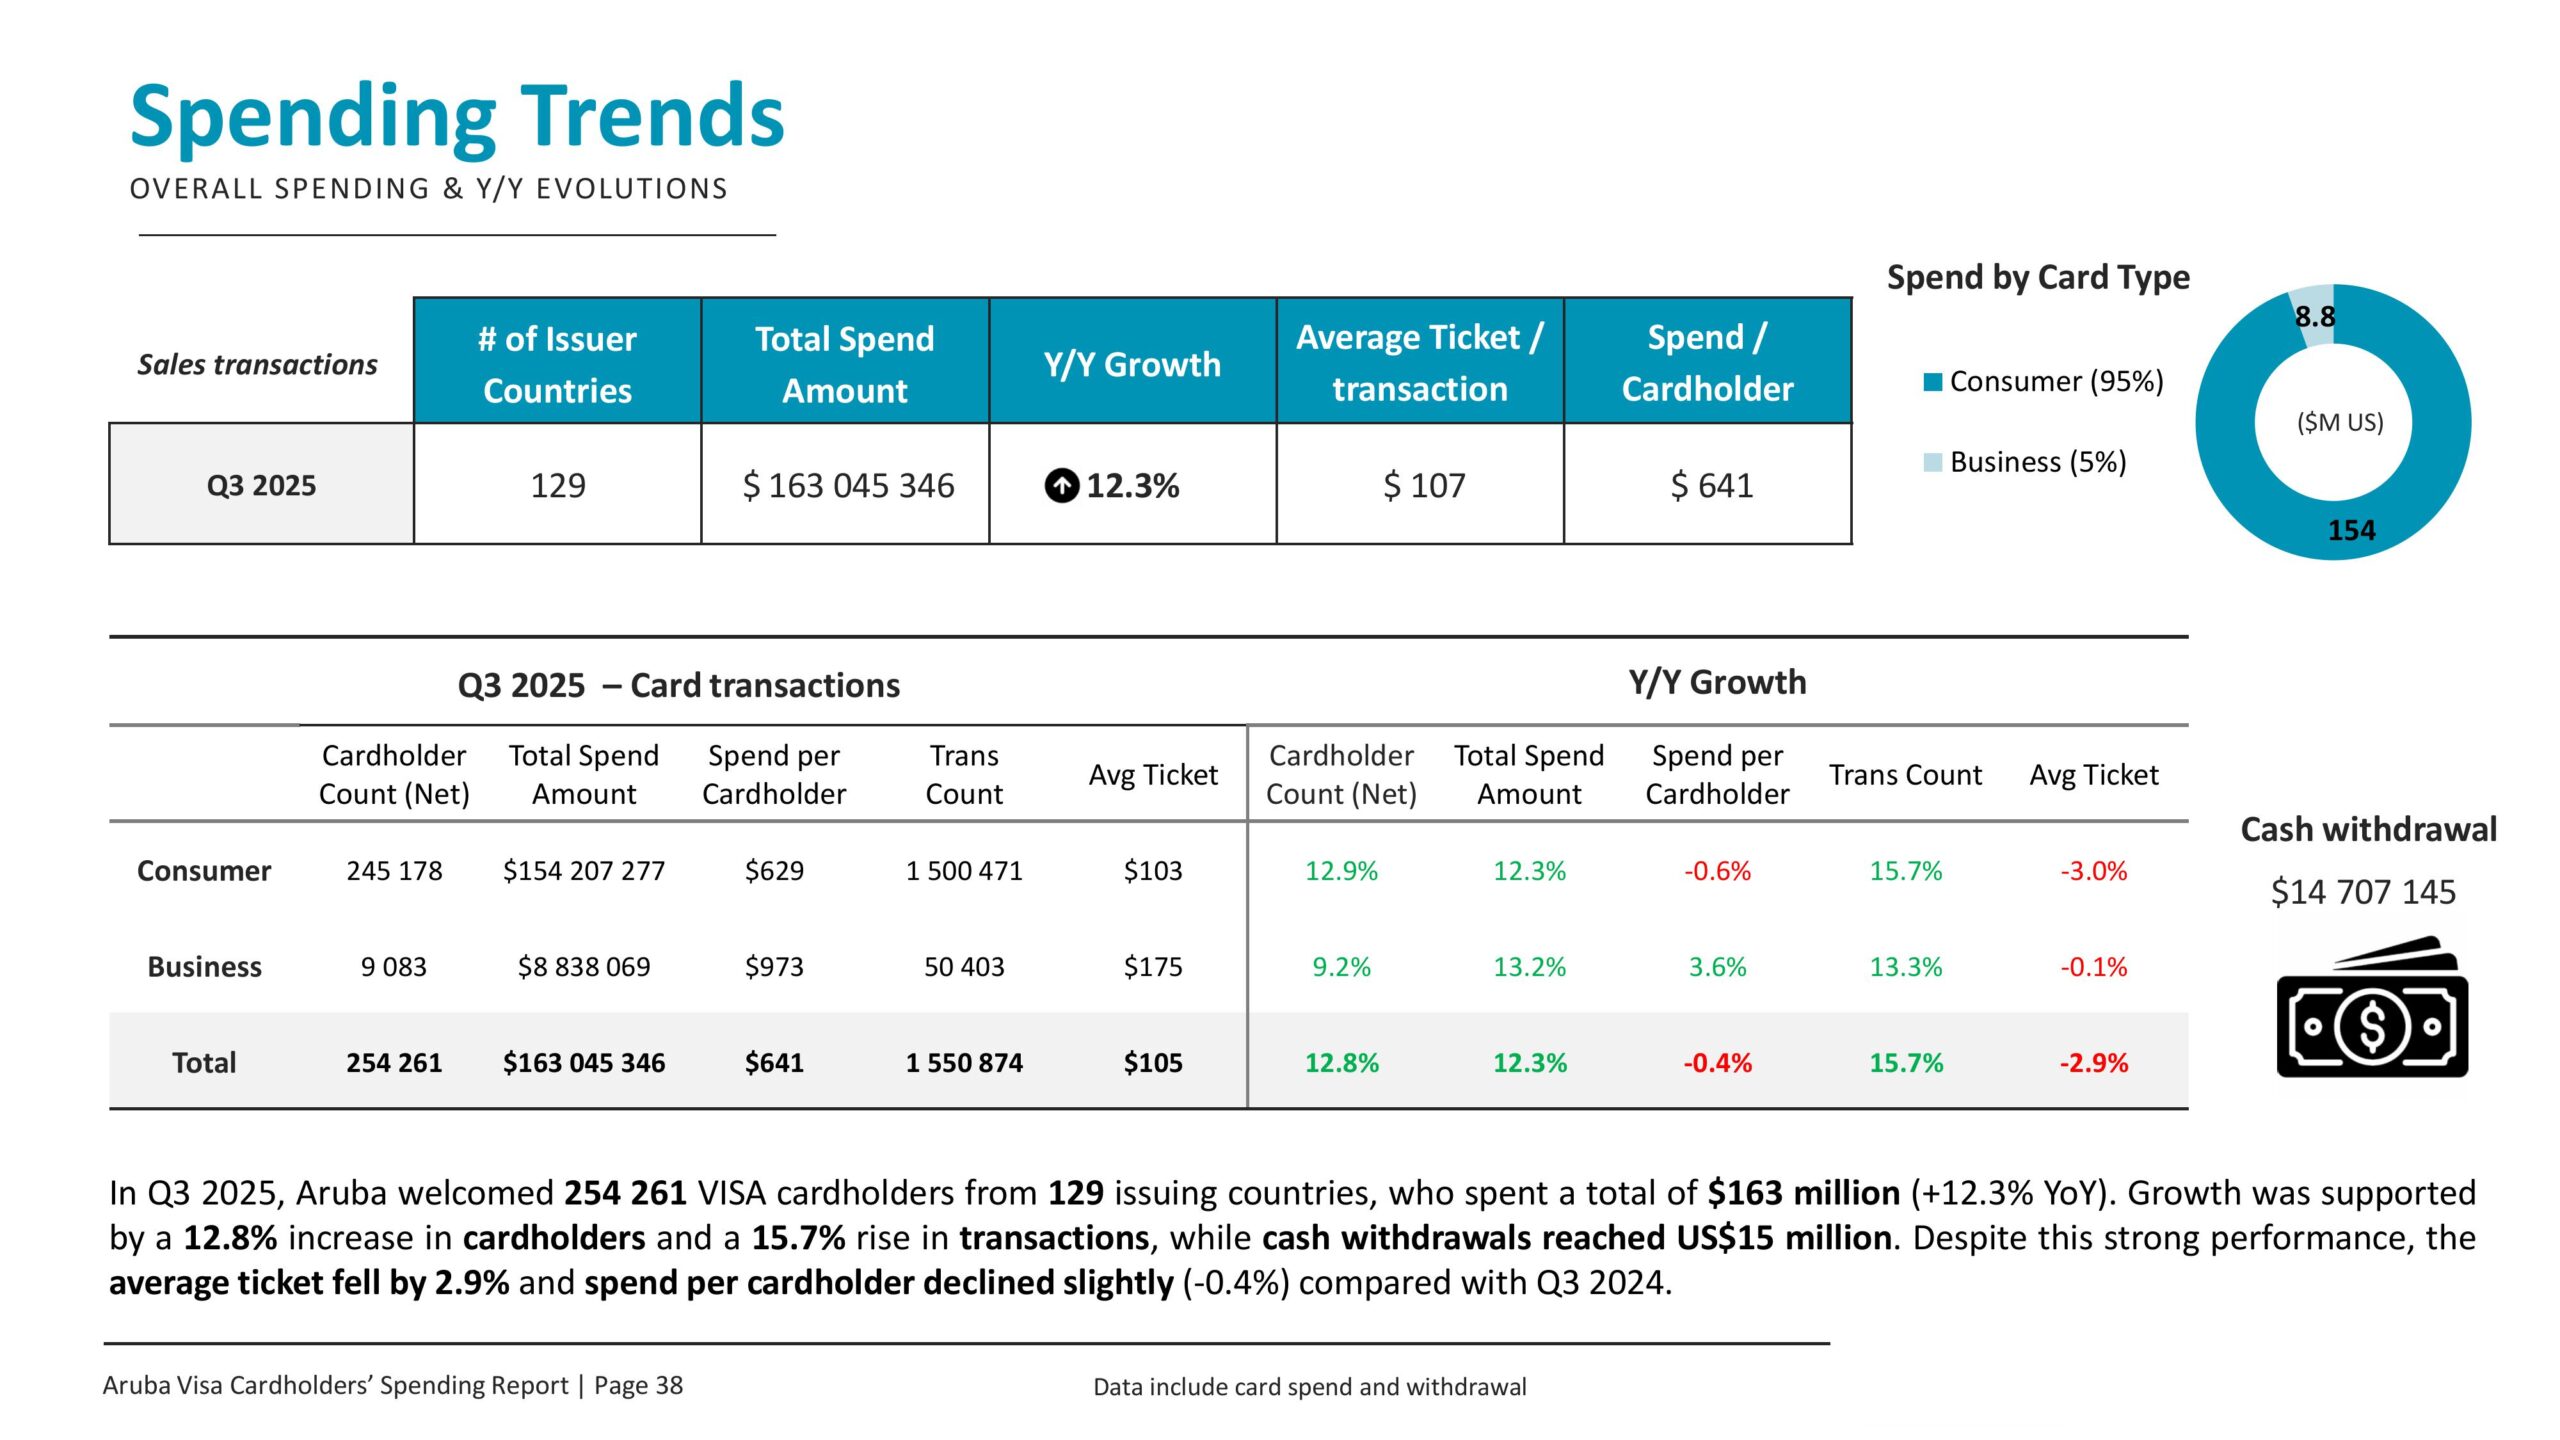
Visa card data offers a clear snapshot of real visitor behavior. During Q3 2025, Aruba welcomed 254,261 Visa cardholders from 129 issuing countries. Collectively, they spent US$163 million, representing a 12.3% year-over-year increase.
Key Visa Spending Highlights
- Cardholders increased by 12.8%
- Transactions rose by 15.7%
- Cash withdrawals reached US$15 million
- Spend per cardholder declined slightly by 0.4%
Despite the marginal dip in average spend per cardholder, transaction volume growth indicates strong visitor engagement. Therefore, Aruba`s tourism performance 2025 remains firmly positive from a spending perspective.

Spending Categories Driving Aruba Tourism Performance 2025
Visitor spending patterns reveal where travelers allocate their budgets while on the island.
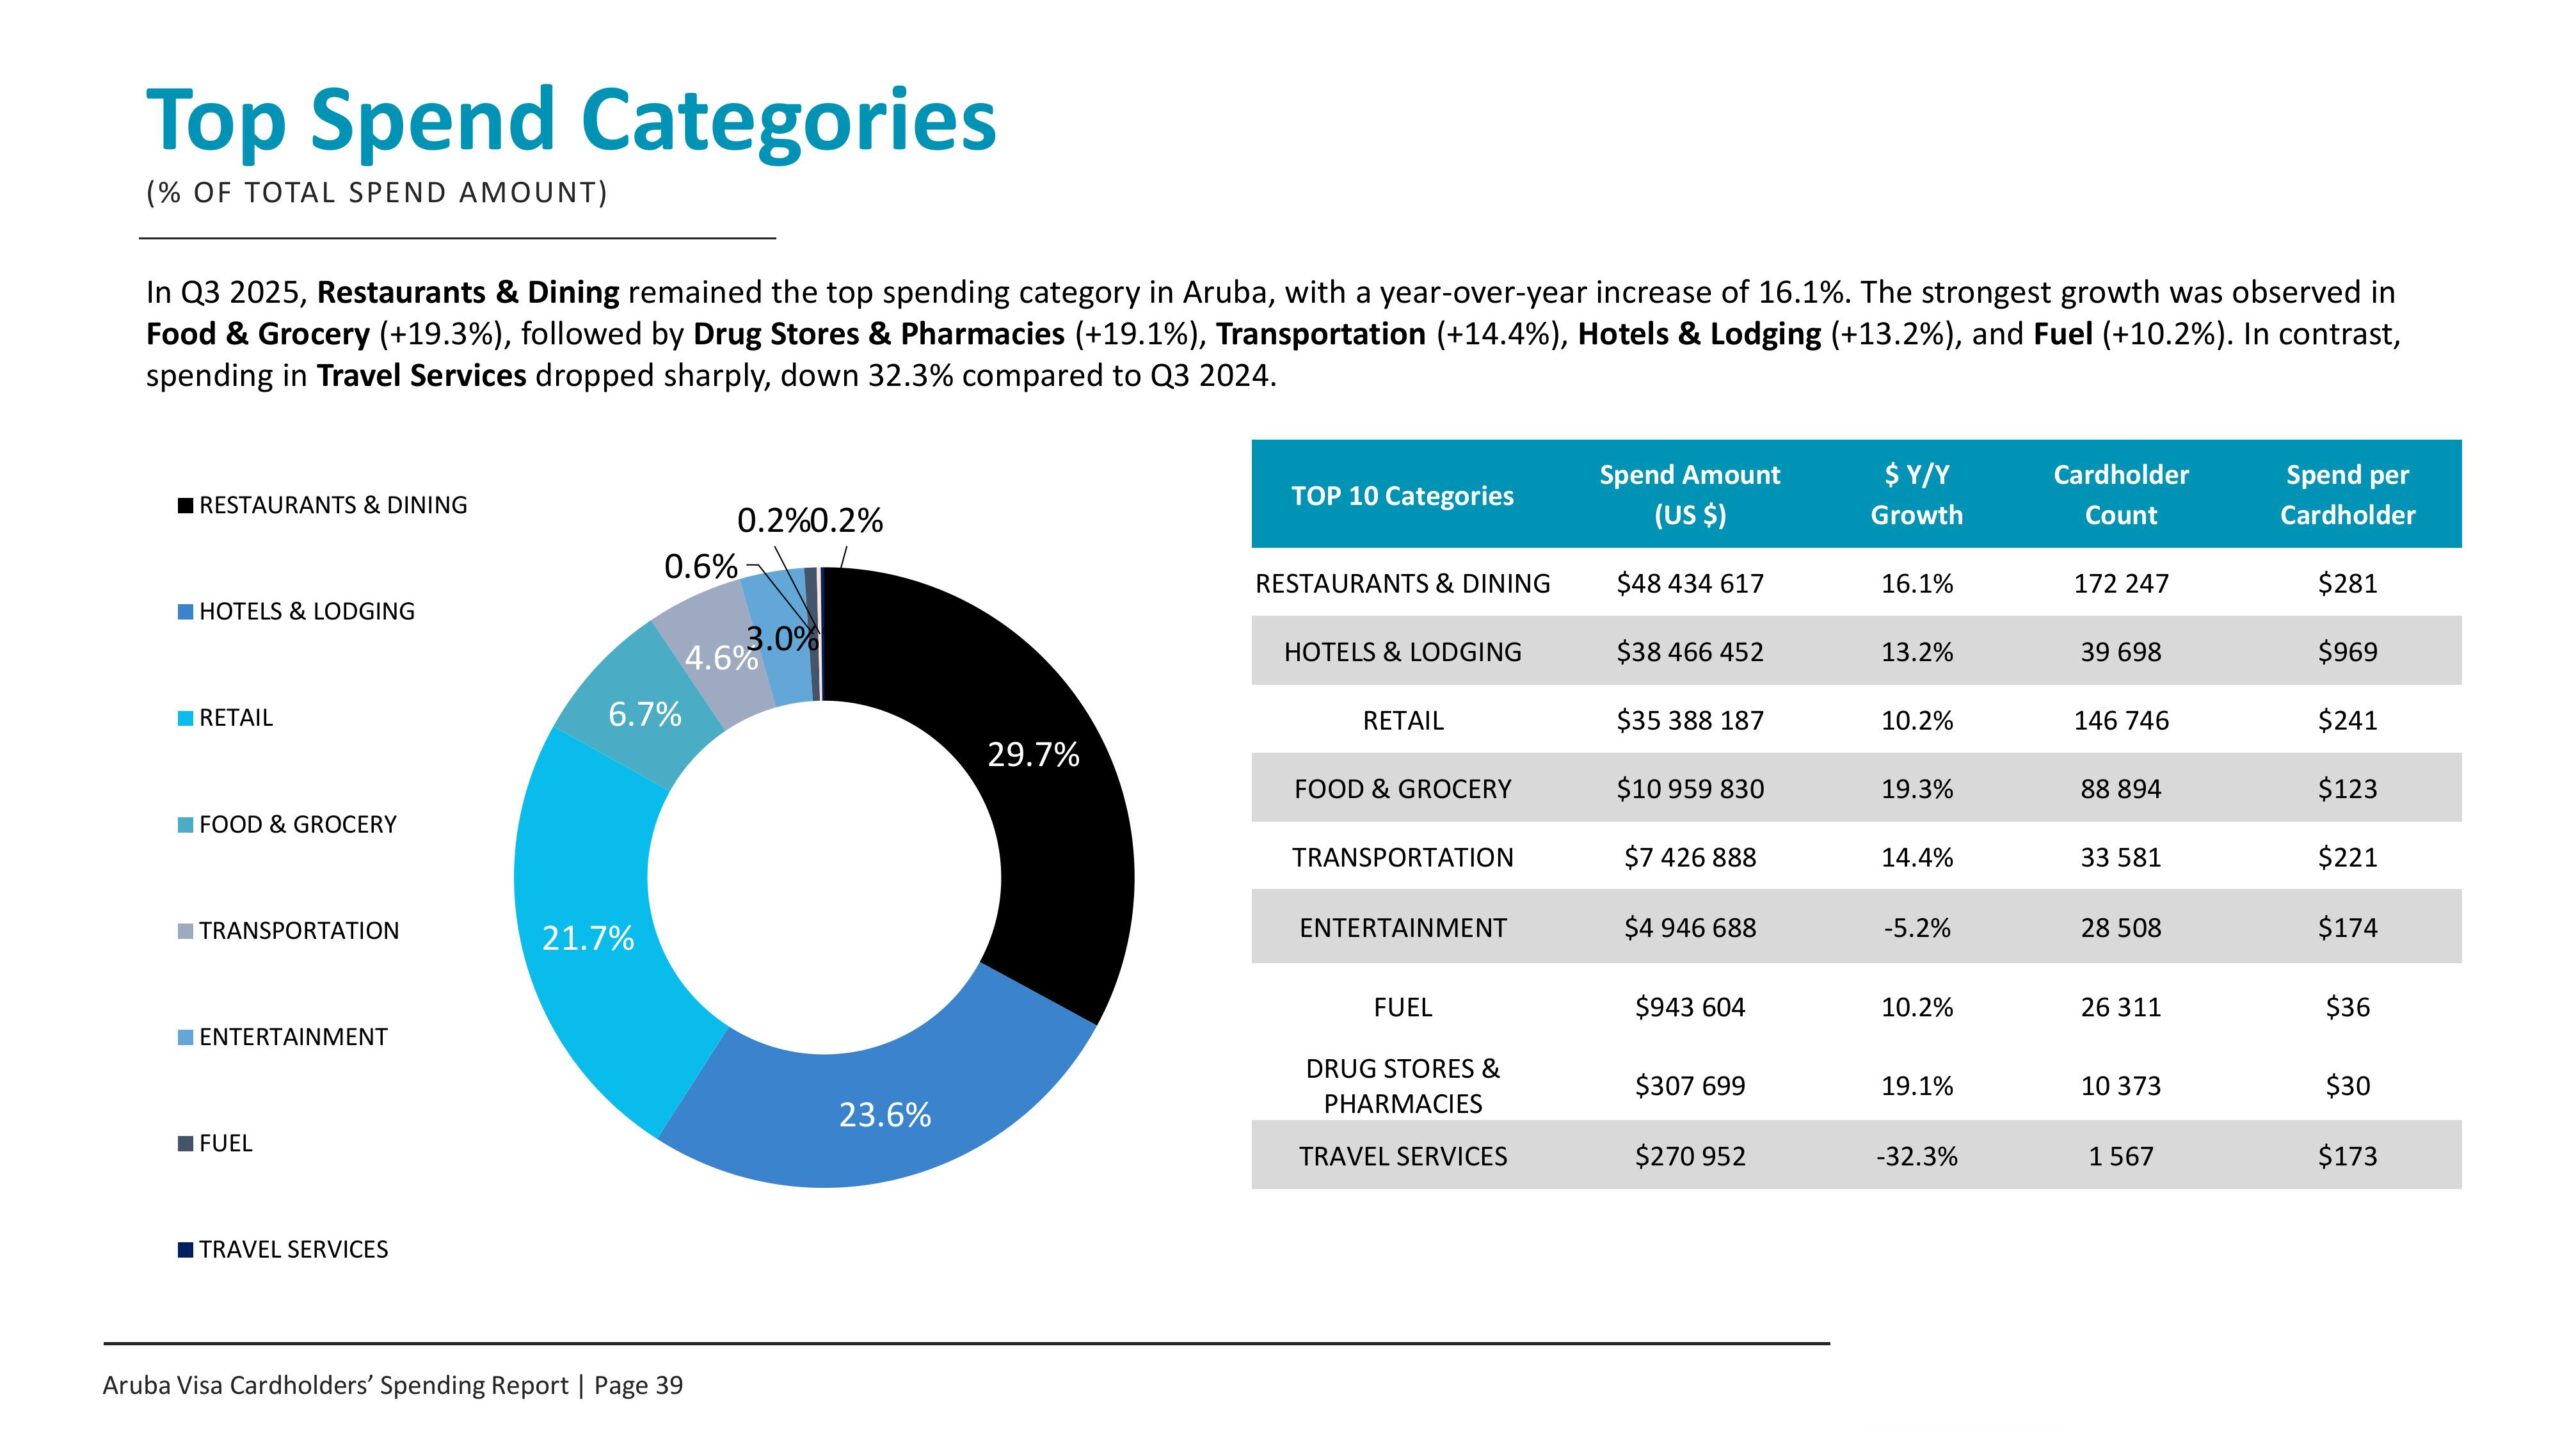
Top Spending Categories
- Restaurants & Dining: US$48.4 million (+16.1%)
- Hotels & Lodging: US$38.4 million (+13.2%)
- Retail Shopping: US$35.3 million (+10.2%)
- Food & Grocery: US$10.9 million (+19.3%)
- Transportation: US$7.4 million (+14.4%)
Clearly, dining and accommodation remain core pillars of Aruba tourism`s performance 2025. Meanwhile, grocery and pharmacy spending growth suggests longer stays and repeat visitation.
2025 Adjusted Tourism Growth Projections
Revised projections indicate Aruba exceeded expectations across key markets.


| Market | Adjusted Projection | Actual YTD Growth |
|---|---|---|
| North America | 2.0% | 2.6% |
| South America | 23.0% | 27.9% |
| Europe | 2.3% | 1.1% |
| Total | 5.0% | 5.8% |
As shown, South America significantly outperformed initial estimates. Consequently, Aruba tourism performance 2025 benefits from stronger regional diversification.
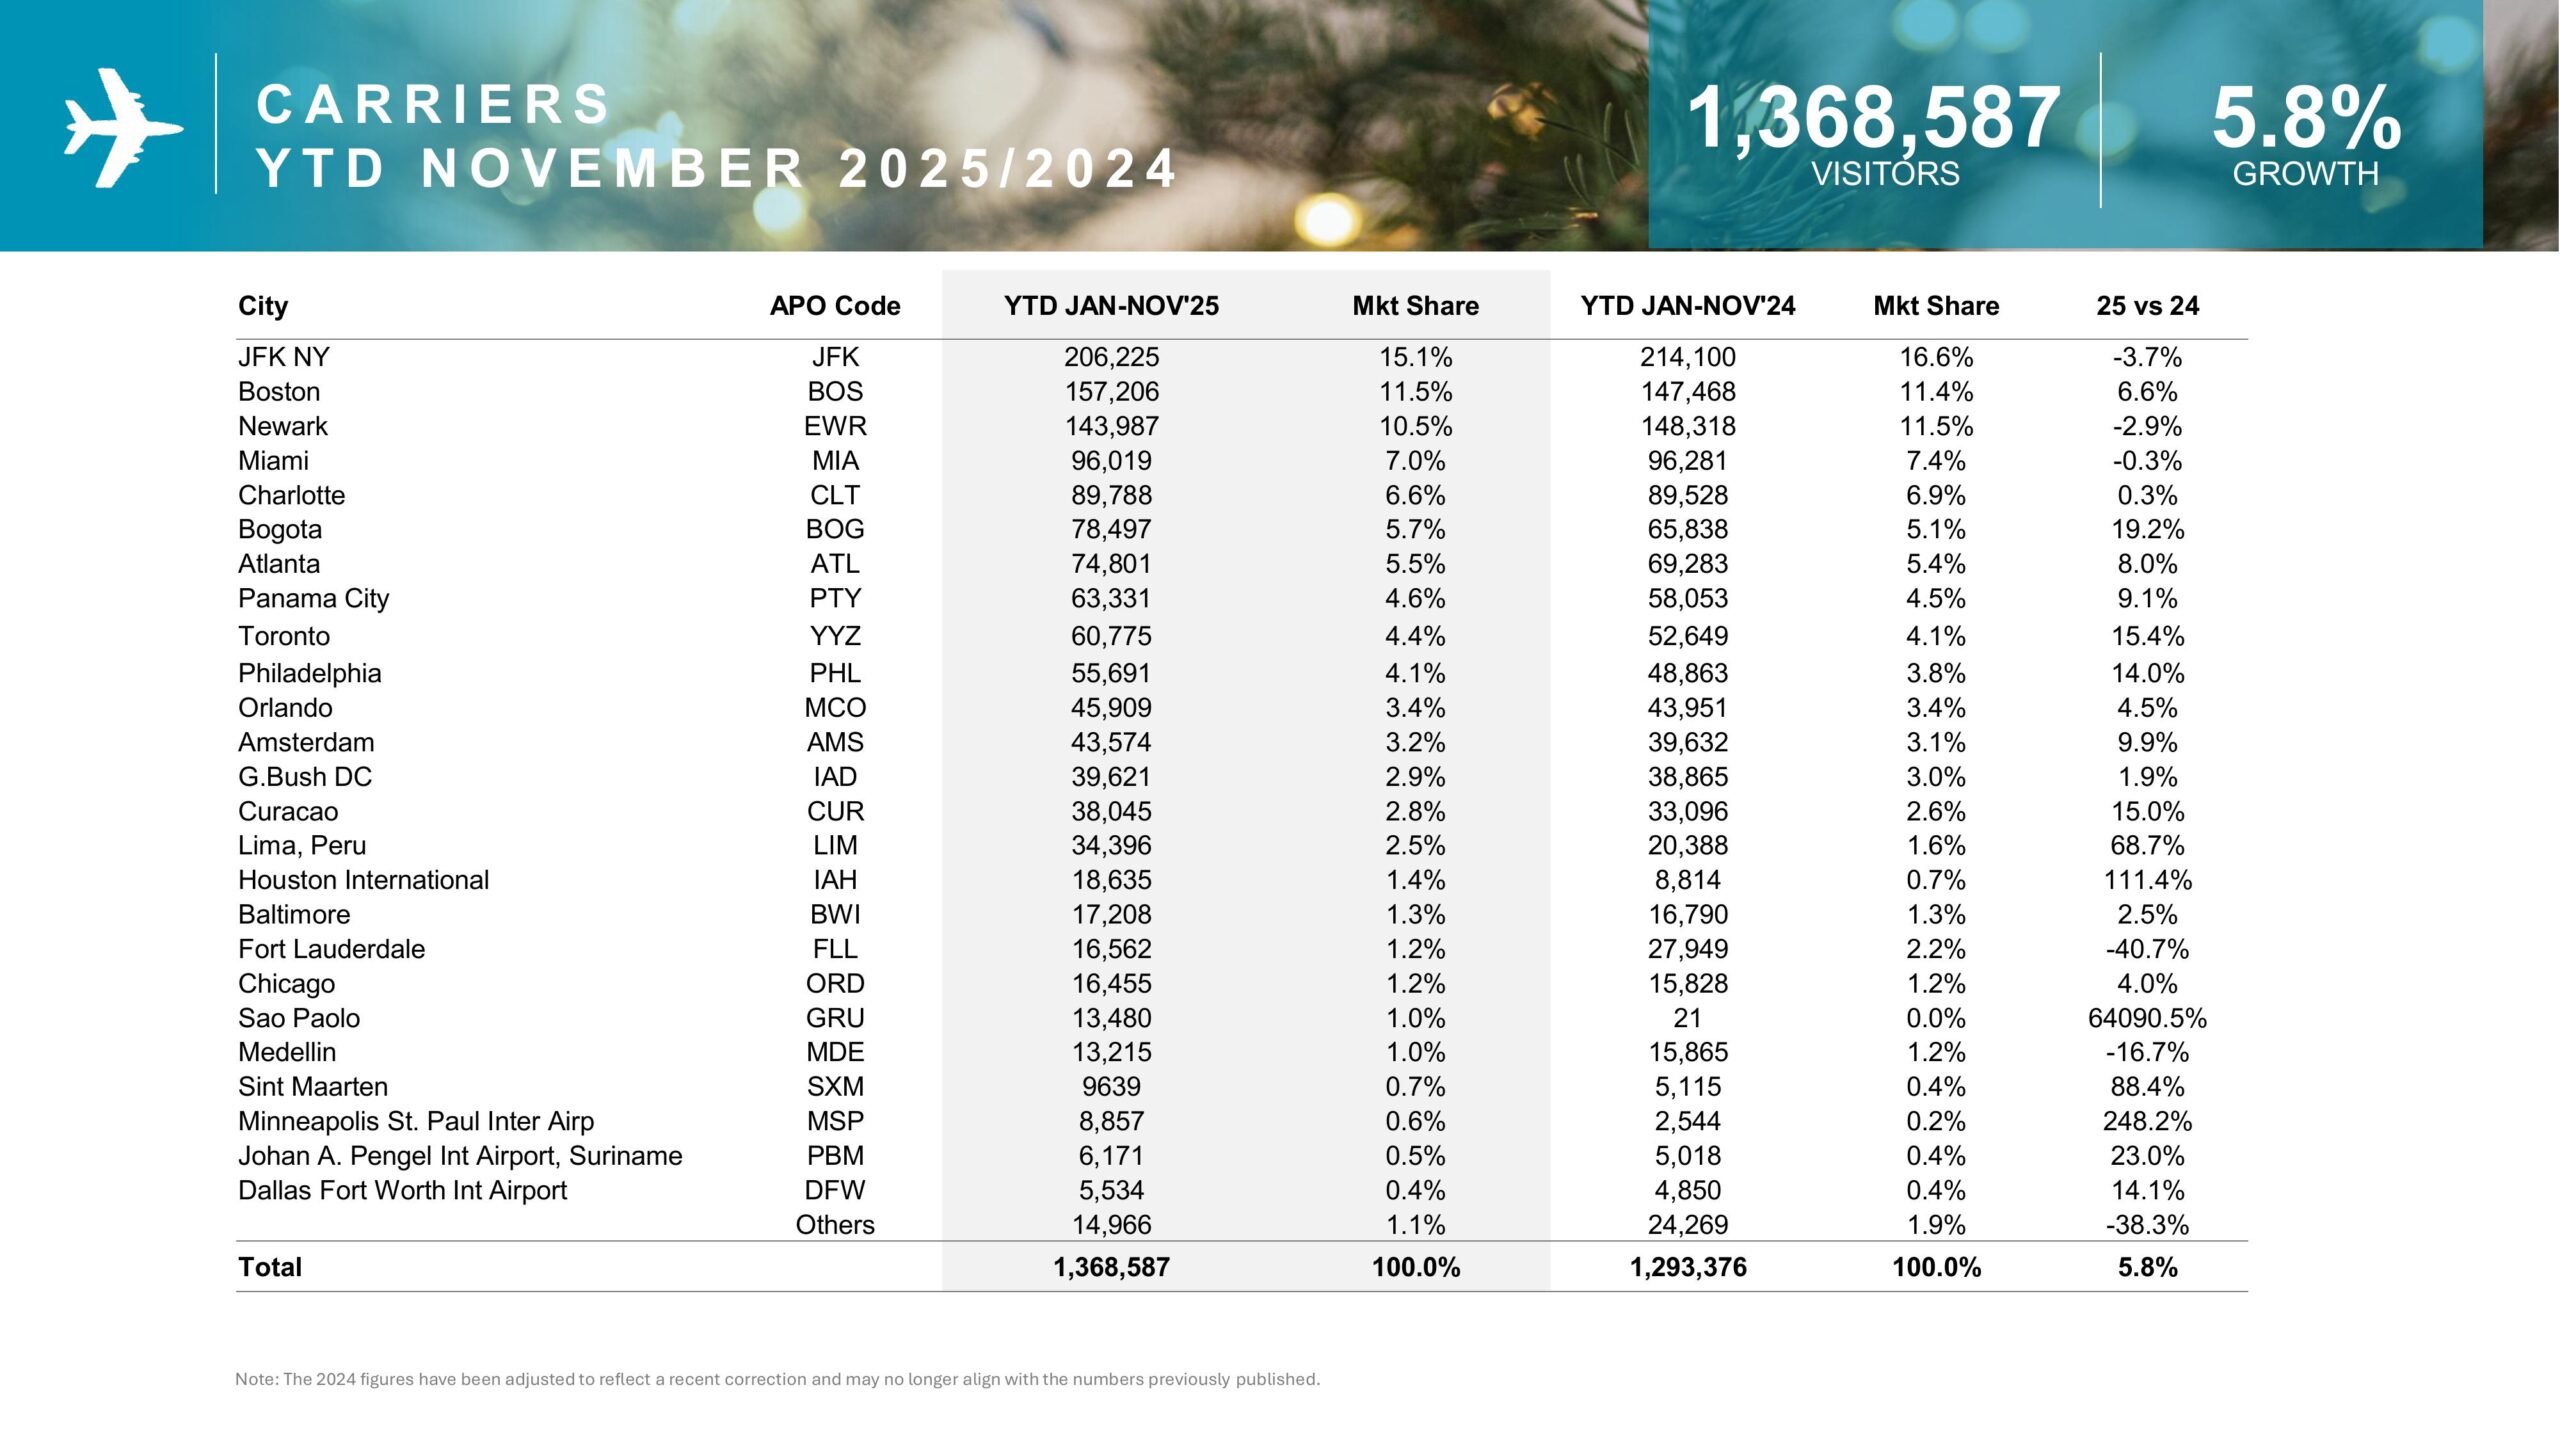
Year-to-Date Stay-Over Arrivals Through November 2025
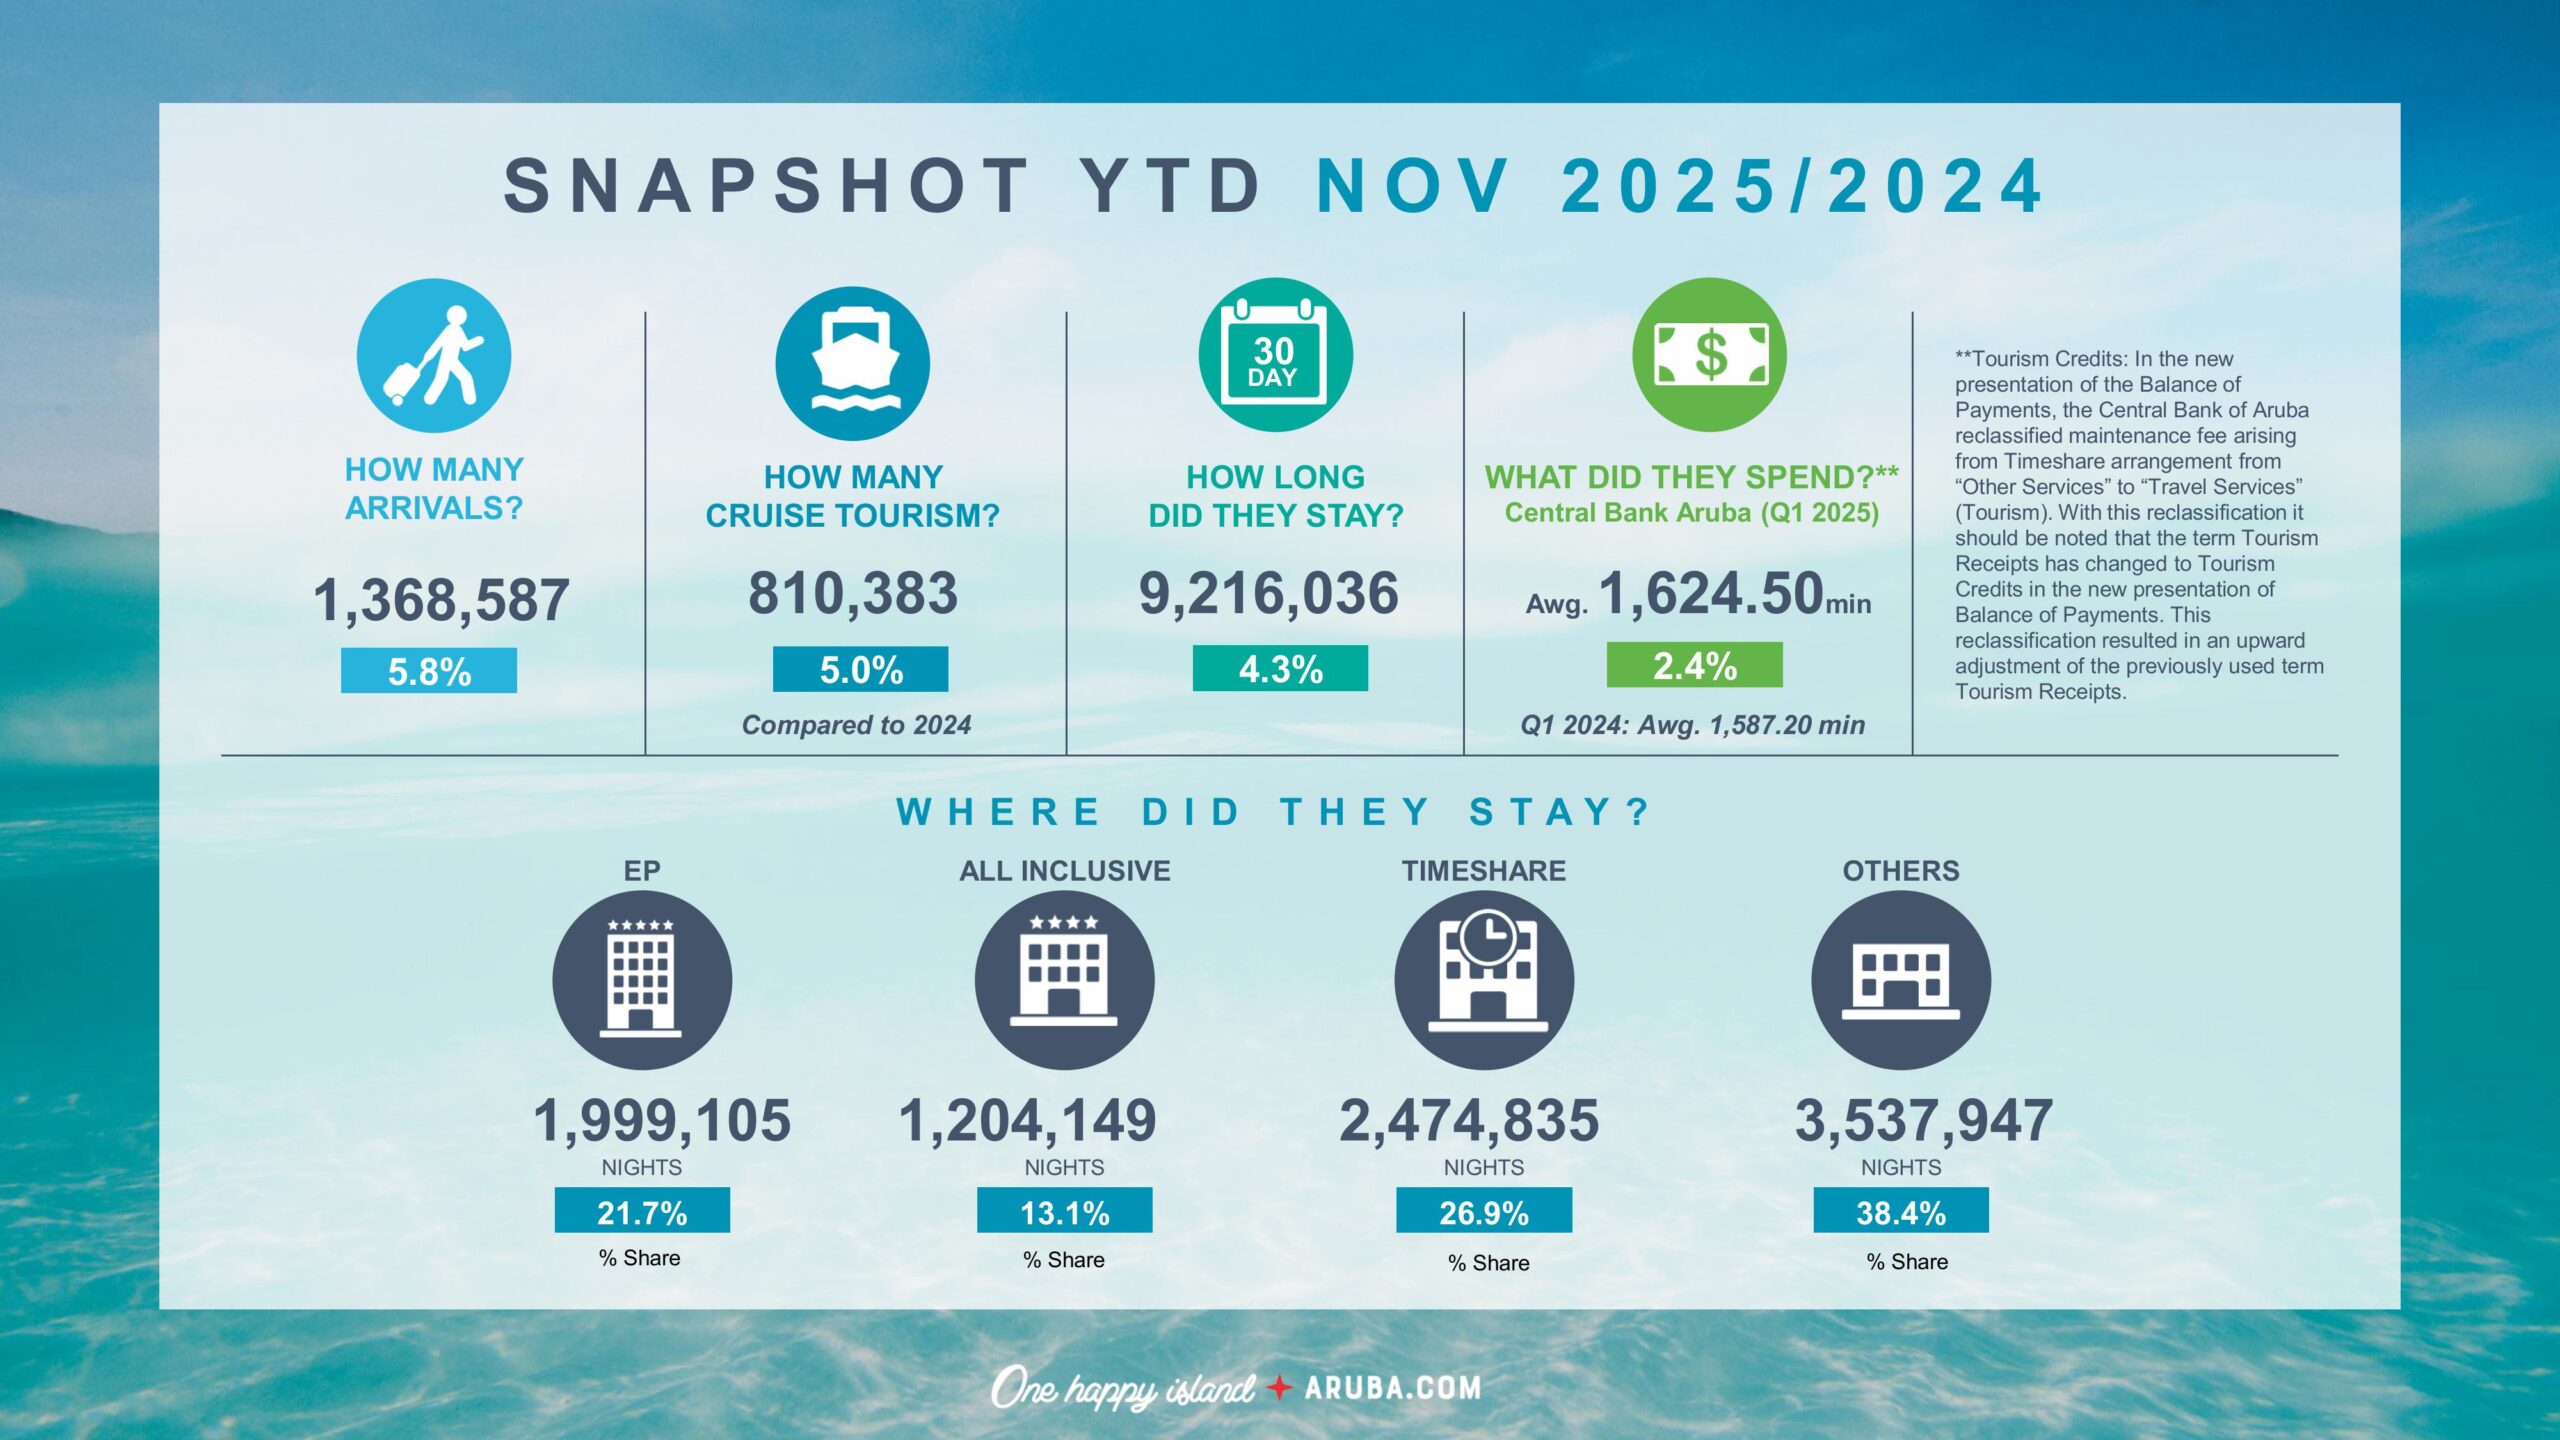
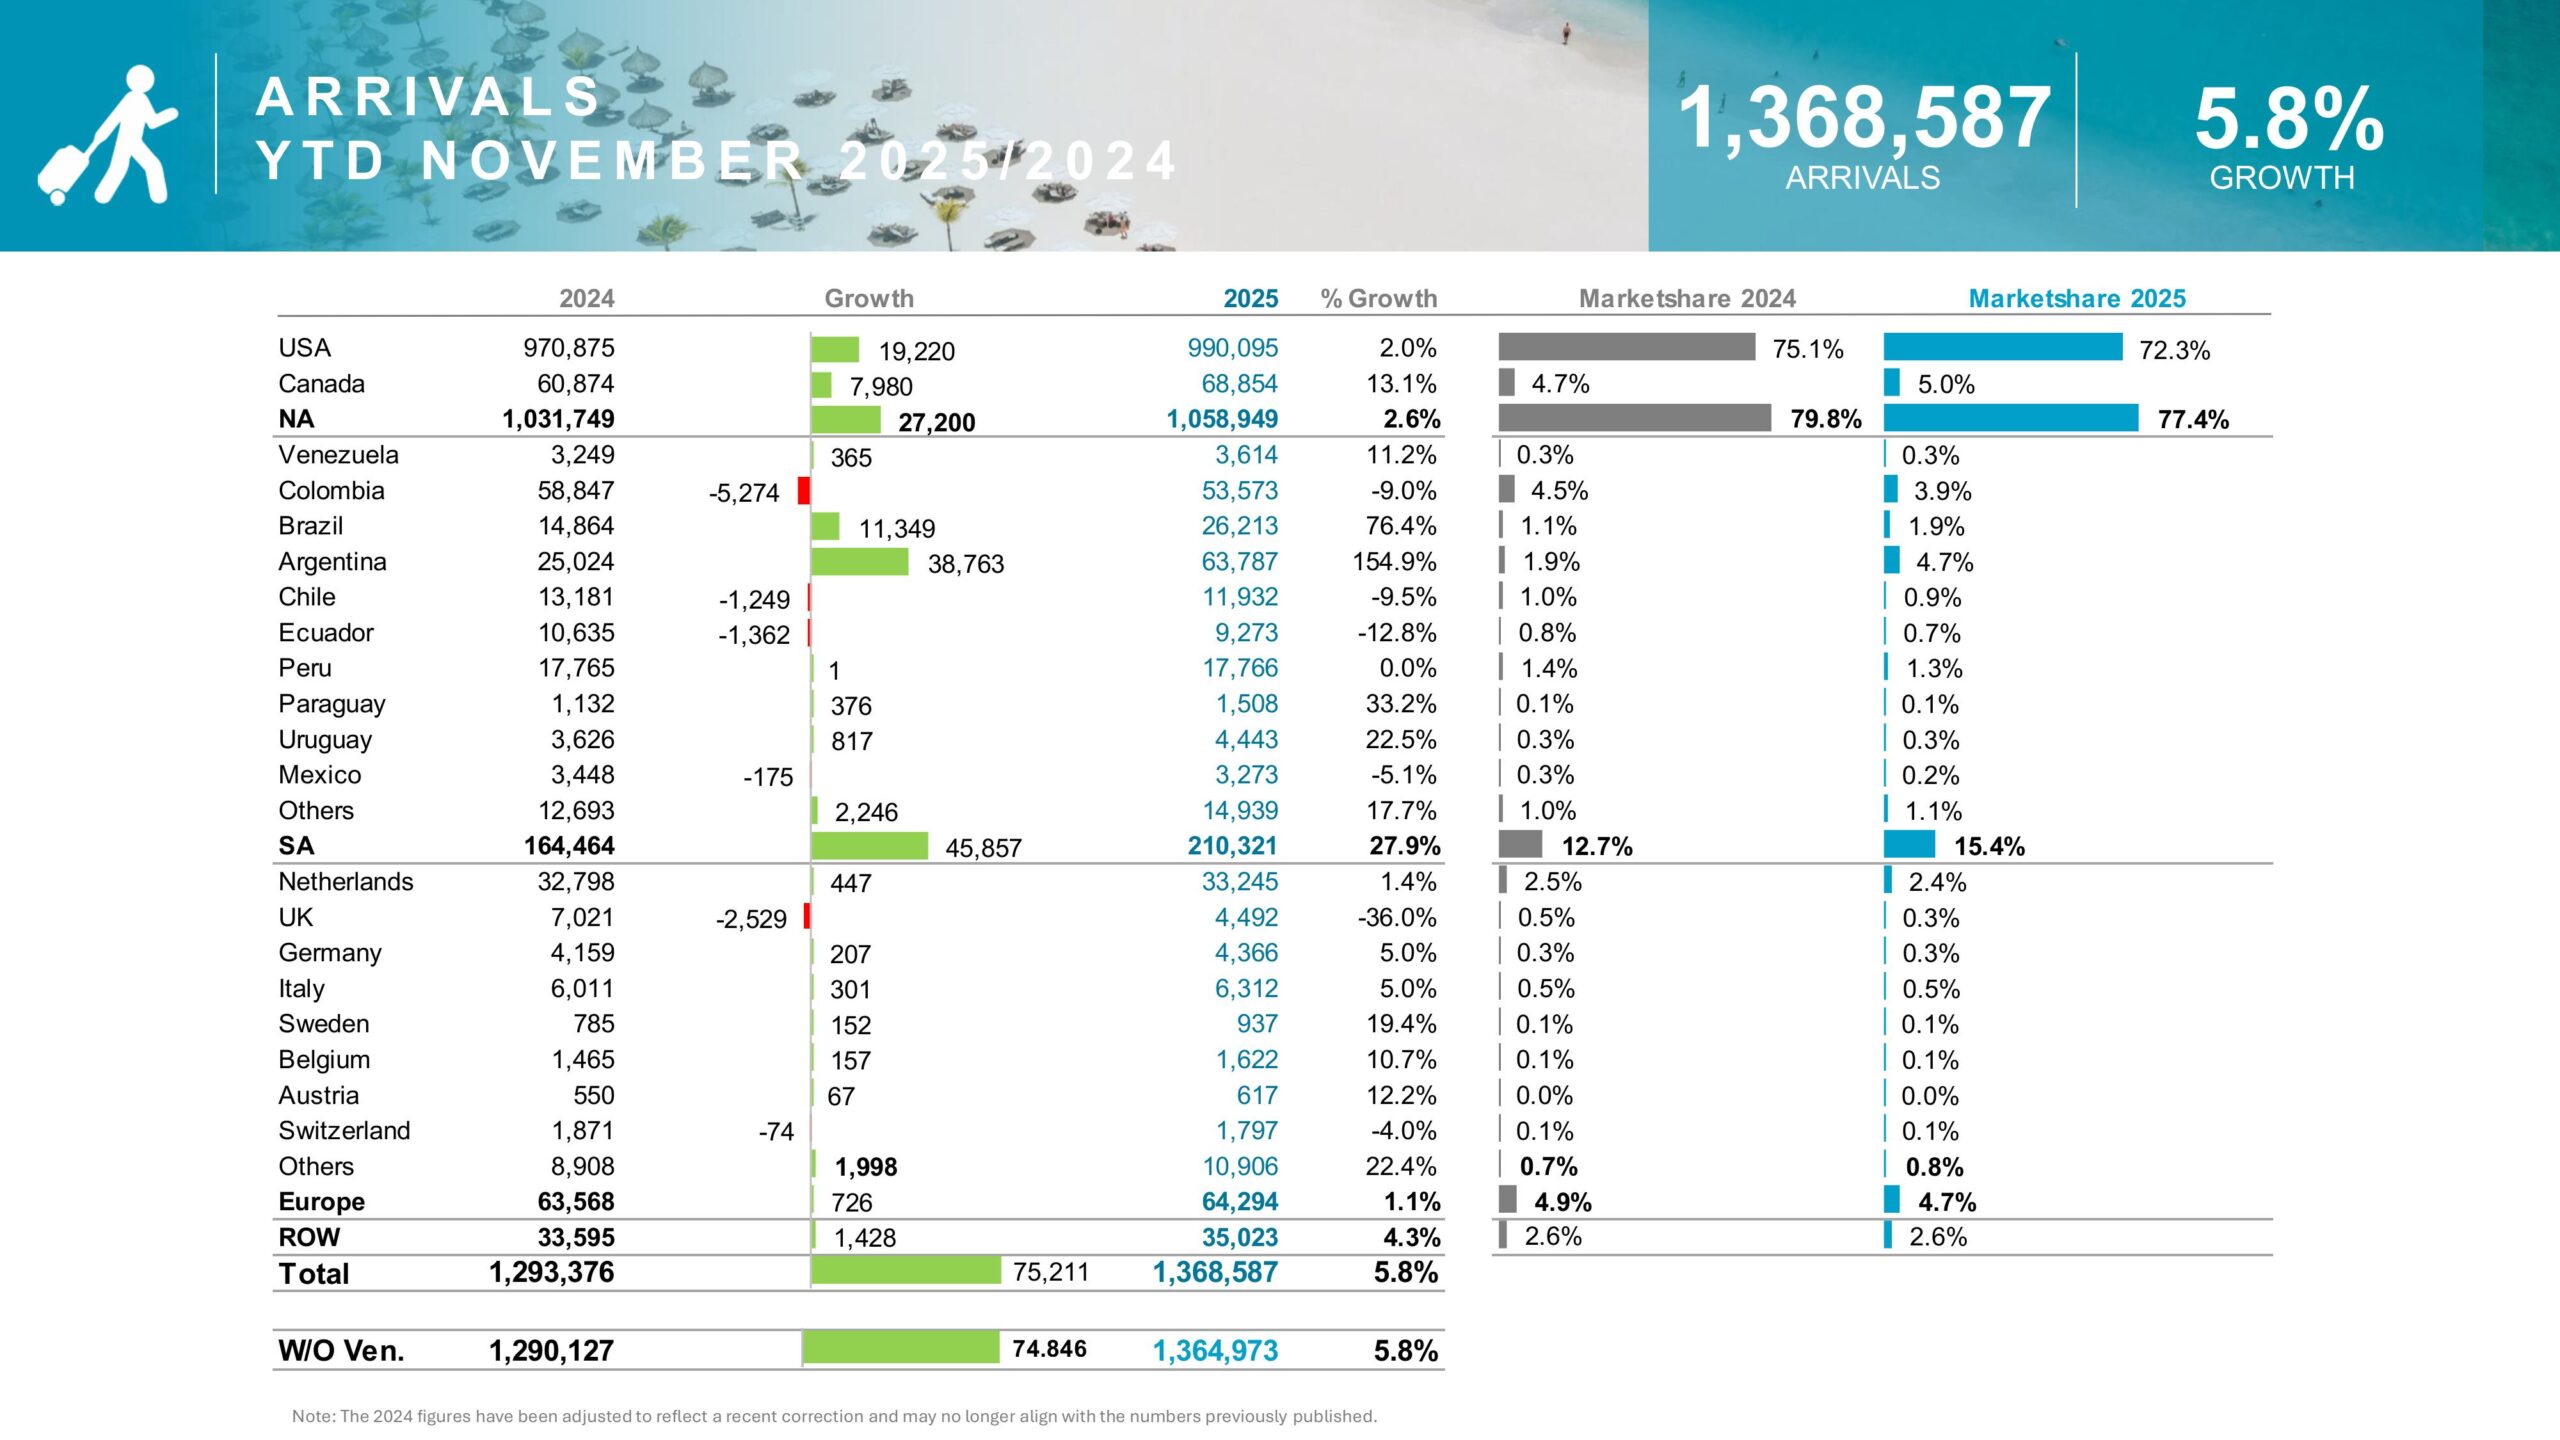
Total stay-over arrivals reached 1,368,587, marking a 5.8% increase compared to 2024.
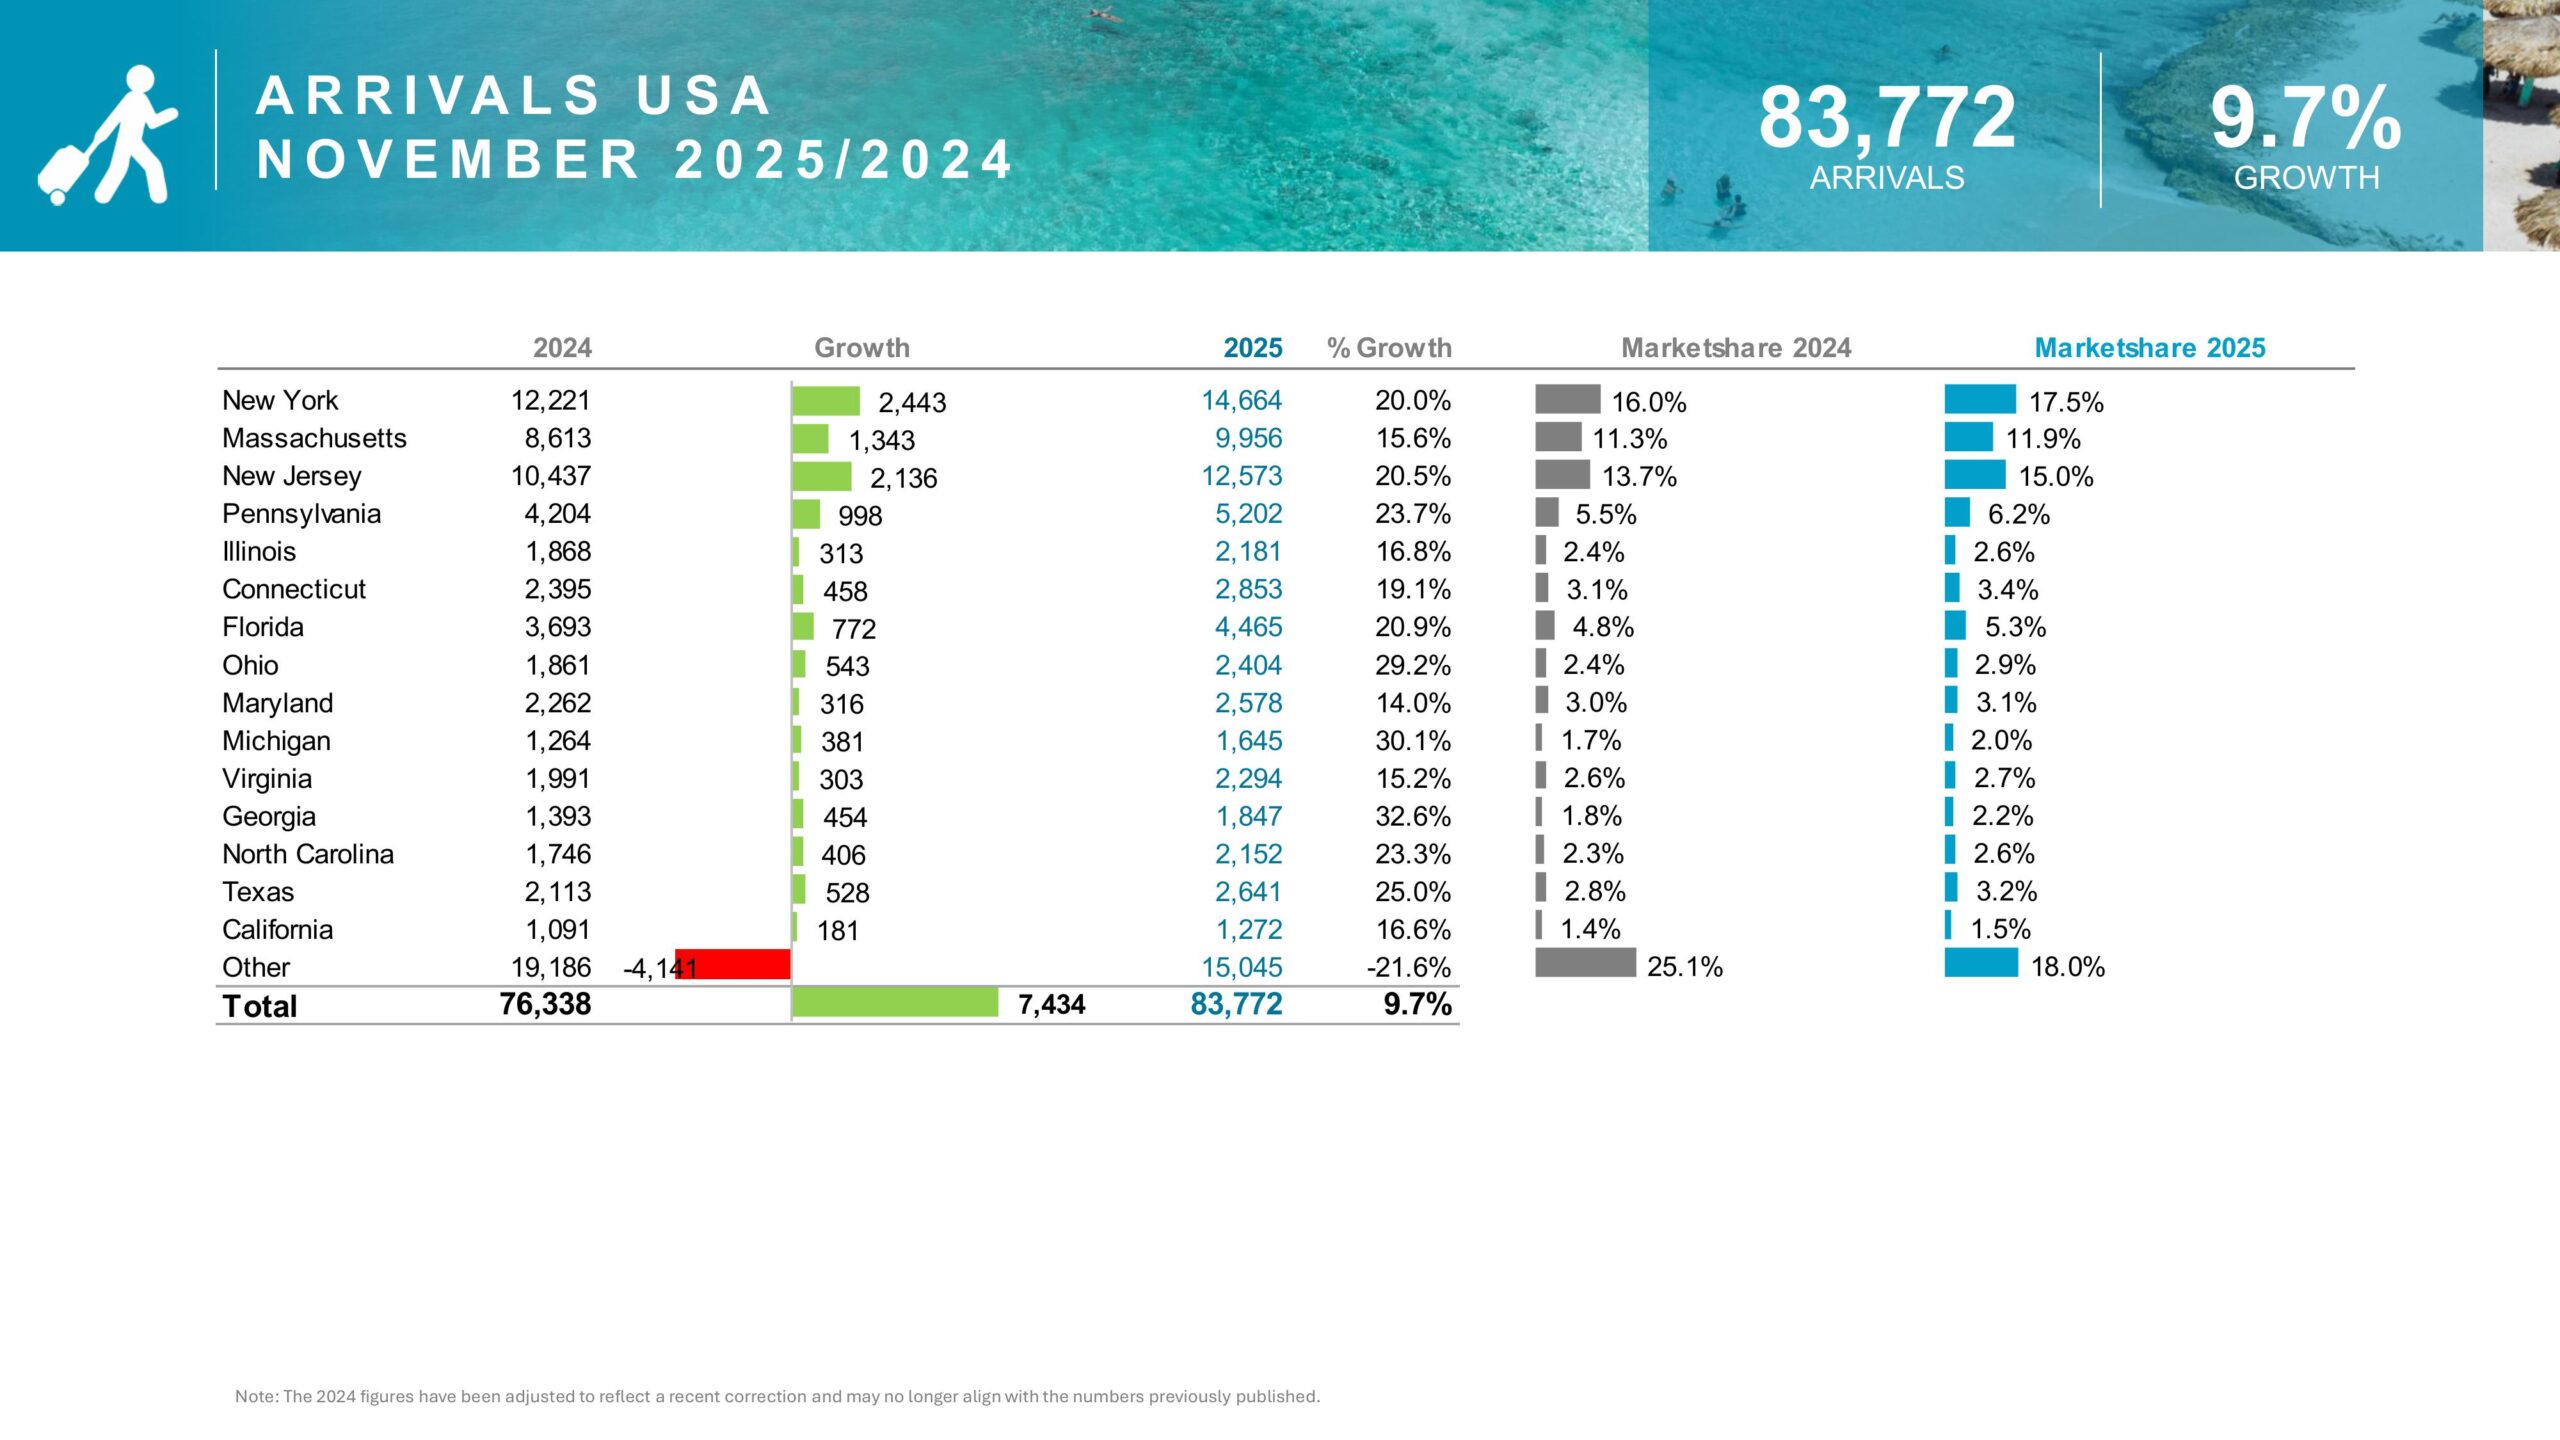
North America Market Performance
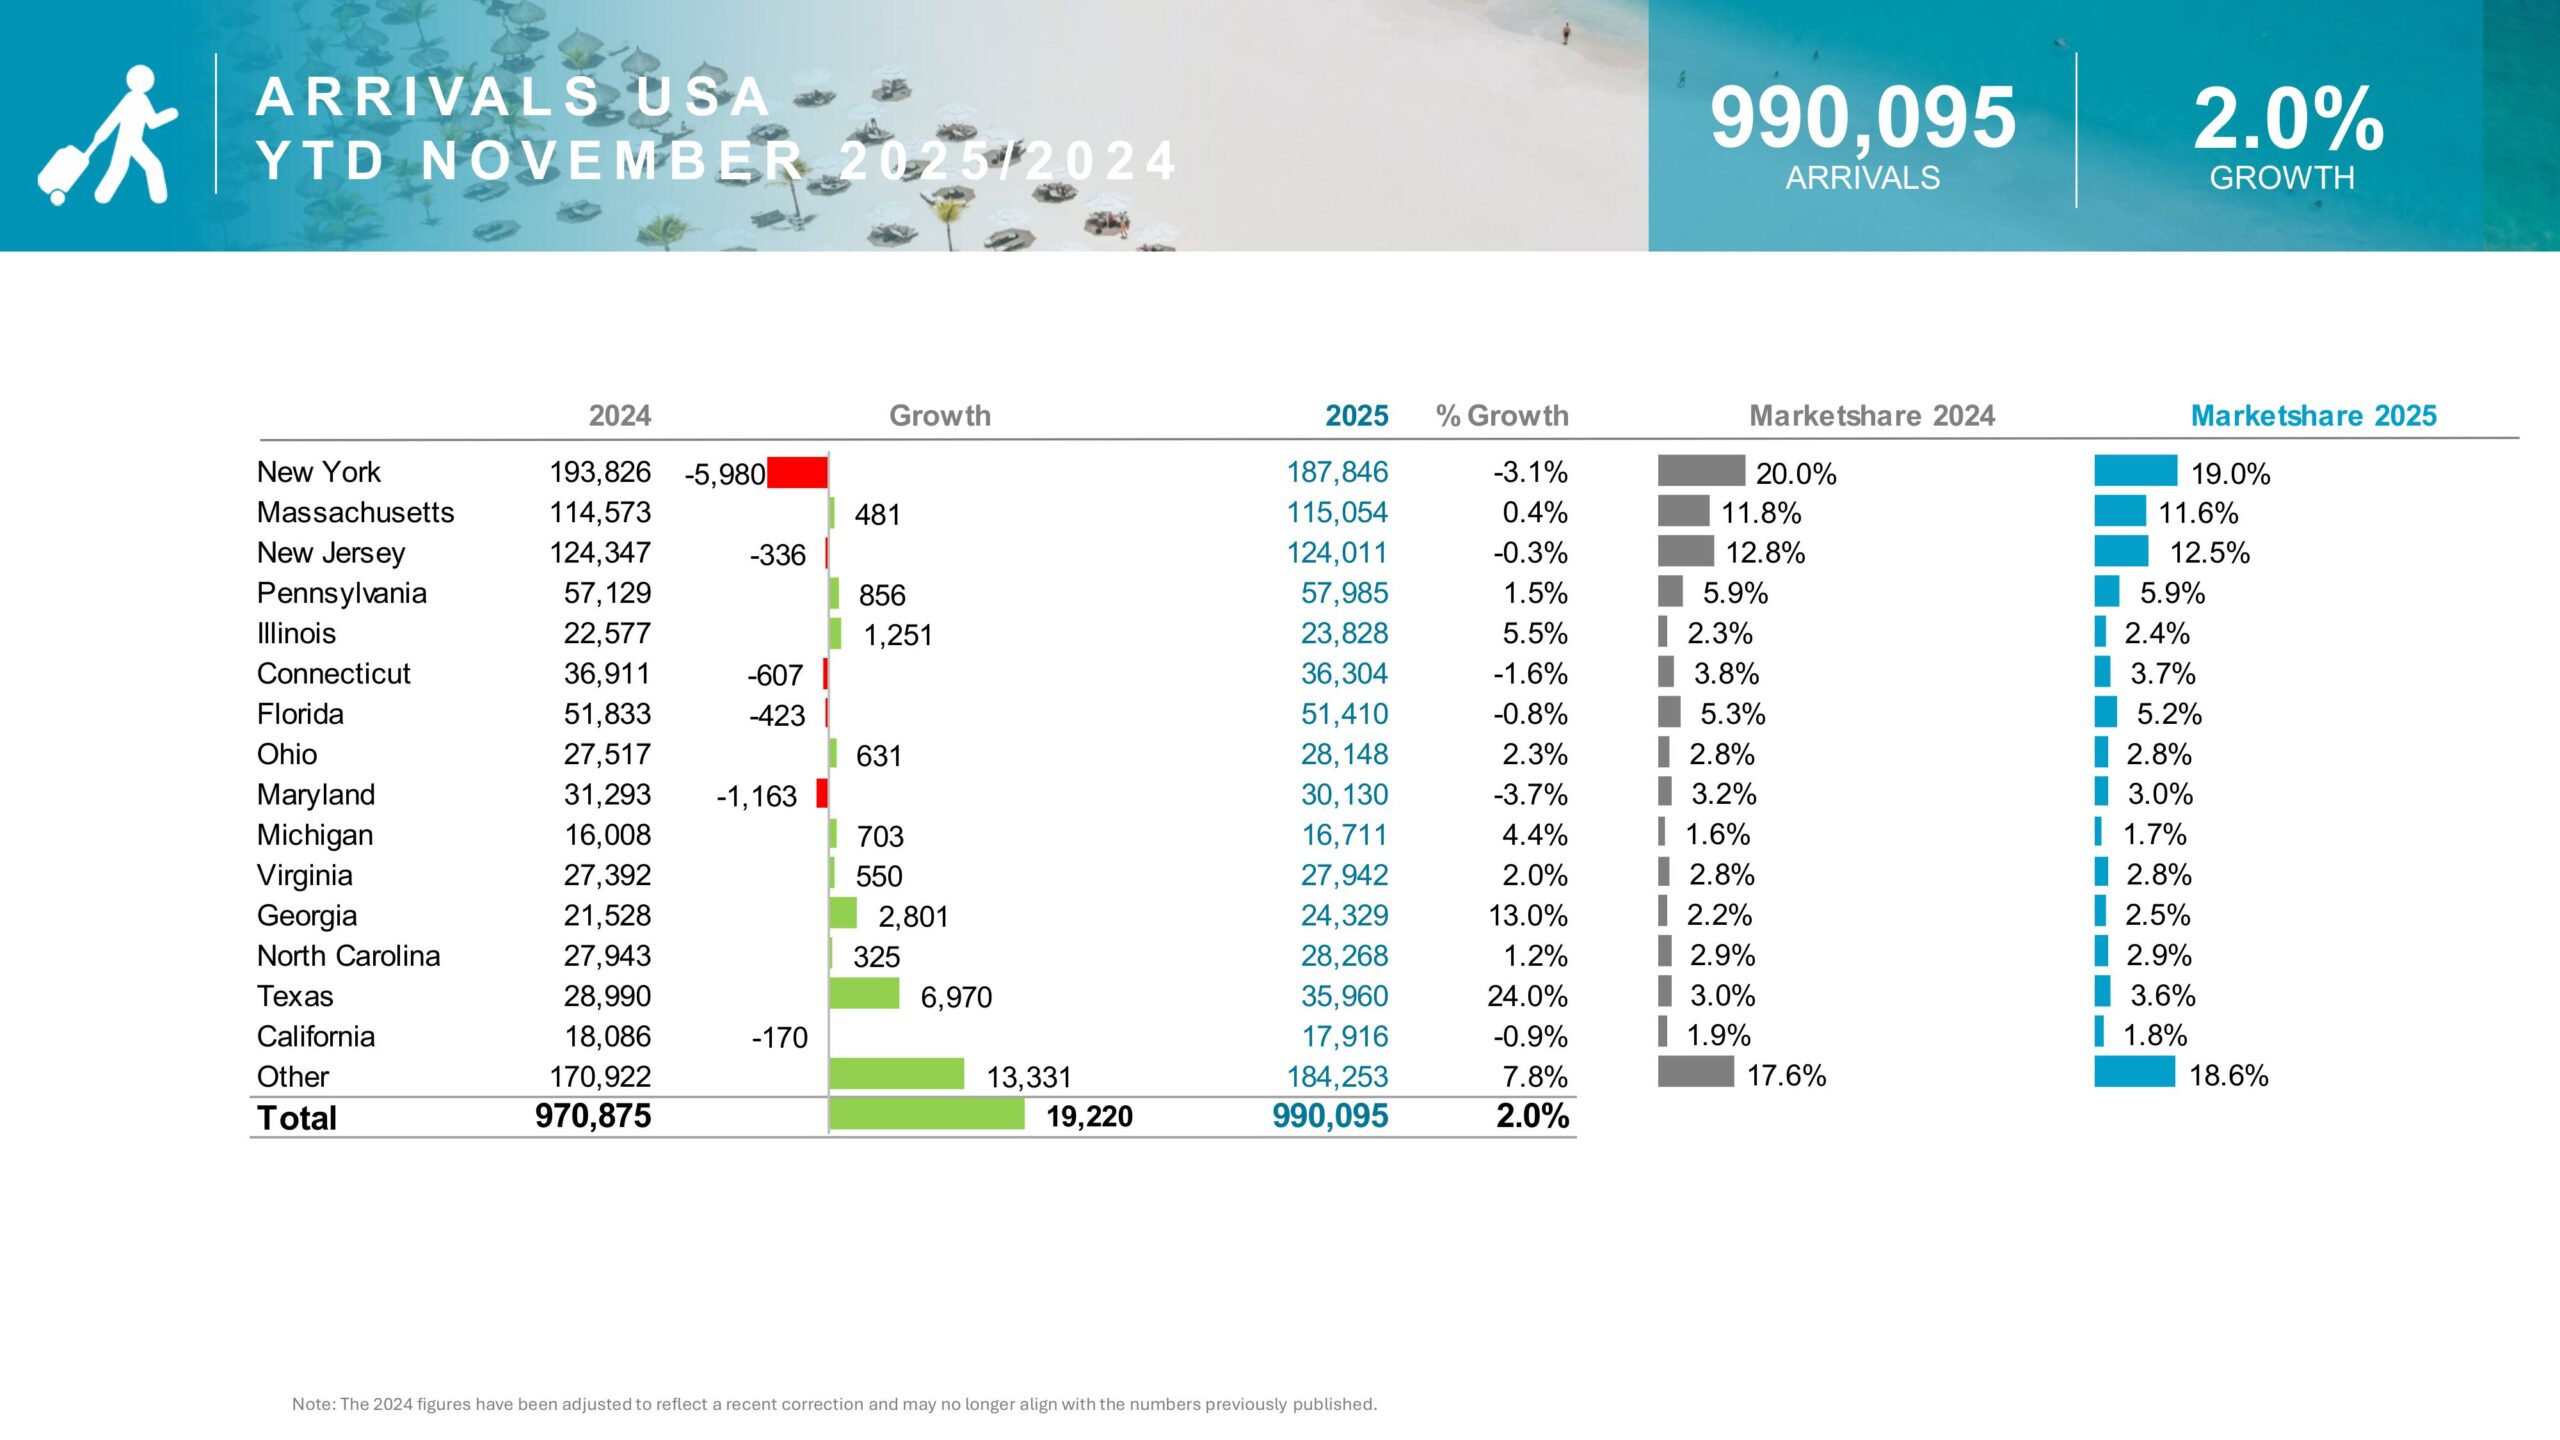
- USA: 990,095 arrivals (+2.0%)
- Canada: 68,854 arrivals (+13.1%)
- Total North America: 1,058,949 arrivals (+2.6%)
North America maintained a 77.4% market share, reinforcing its role as Aruba’s primary source market.
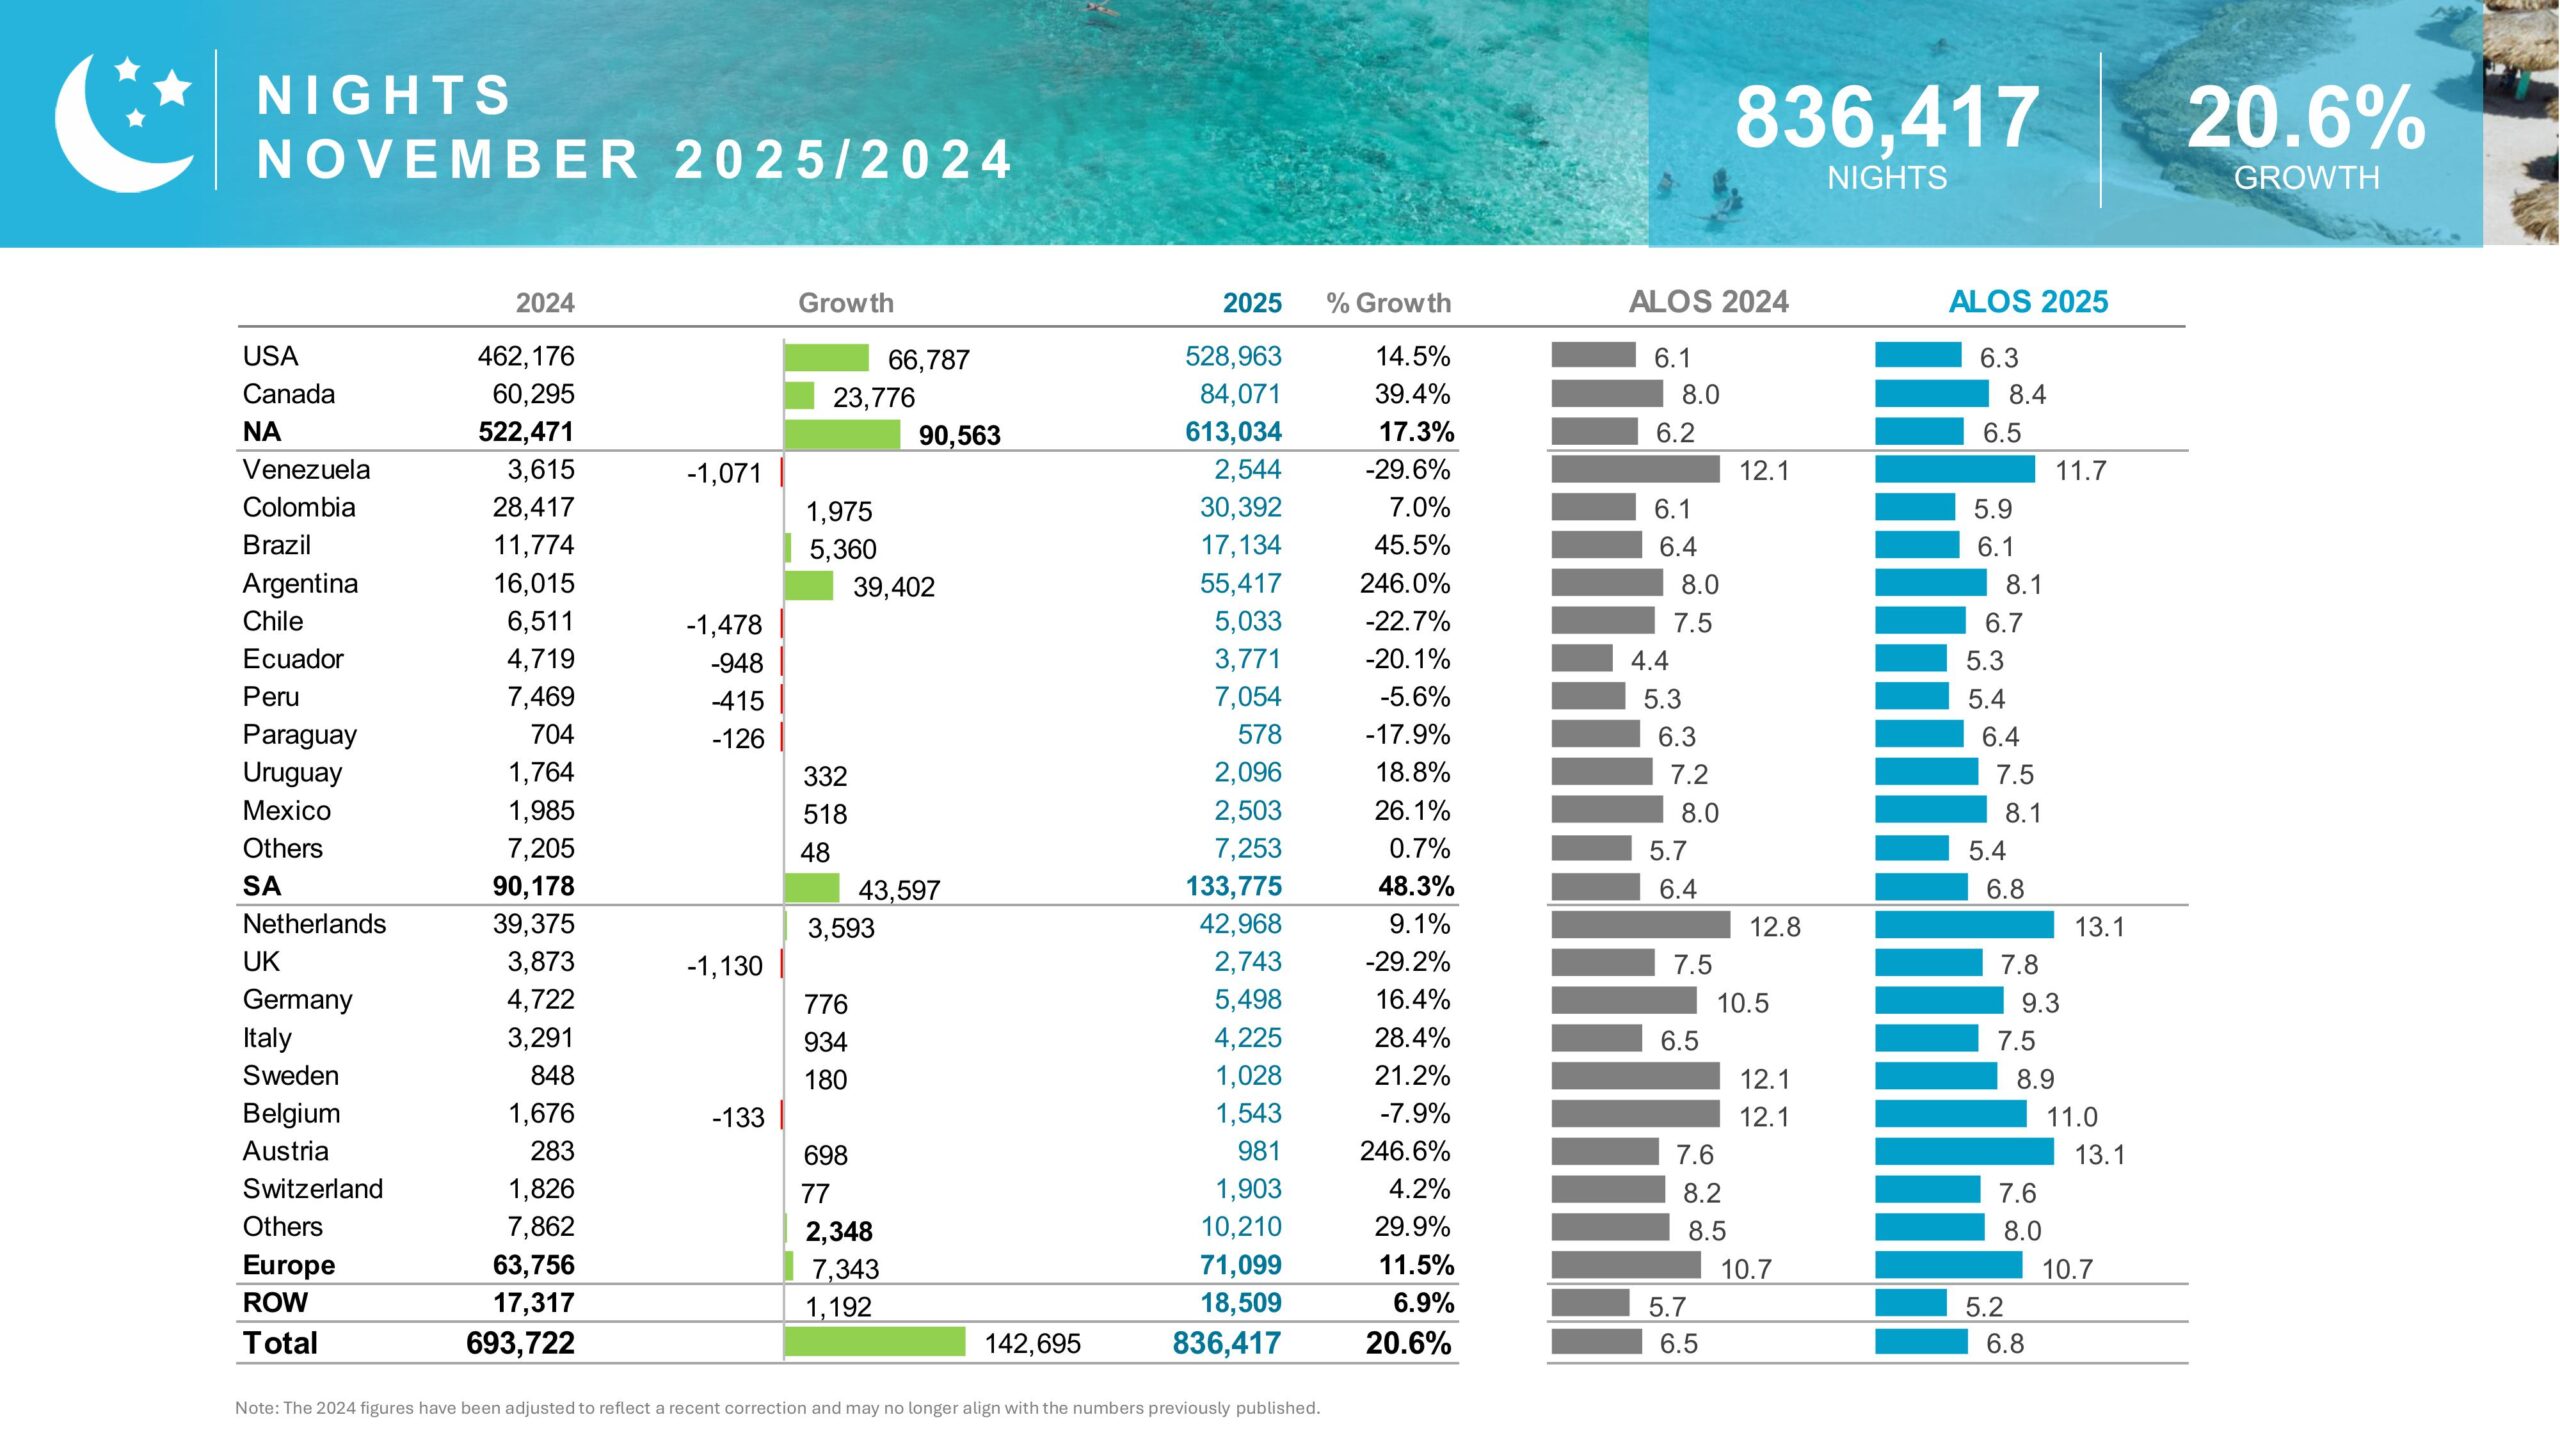
South America Market Expansion
South America posted an impressive 27.9% growth, driven by:
- Argentina: +154.9%
- Brazil: +76.4%
- Uruguay: +22.5%
These results significantly strengthened Aruba tourism performance 2025 and reduced dependence on traditional markets.


Europe and Rest of World Arrivals
European arrivals reached 64,294, reflecting 1.1% growth. While growth remained modest, countries such as Germany, Italy, Sweden, and Belgium posted positive increases.
Meanwhile, the Rest of World (ROW) segment grew by 4.3%, further supporting Aruba’s global appeal.
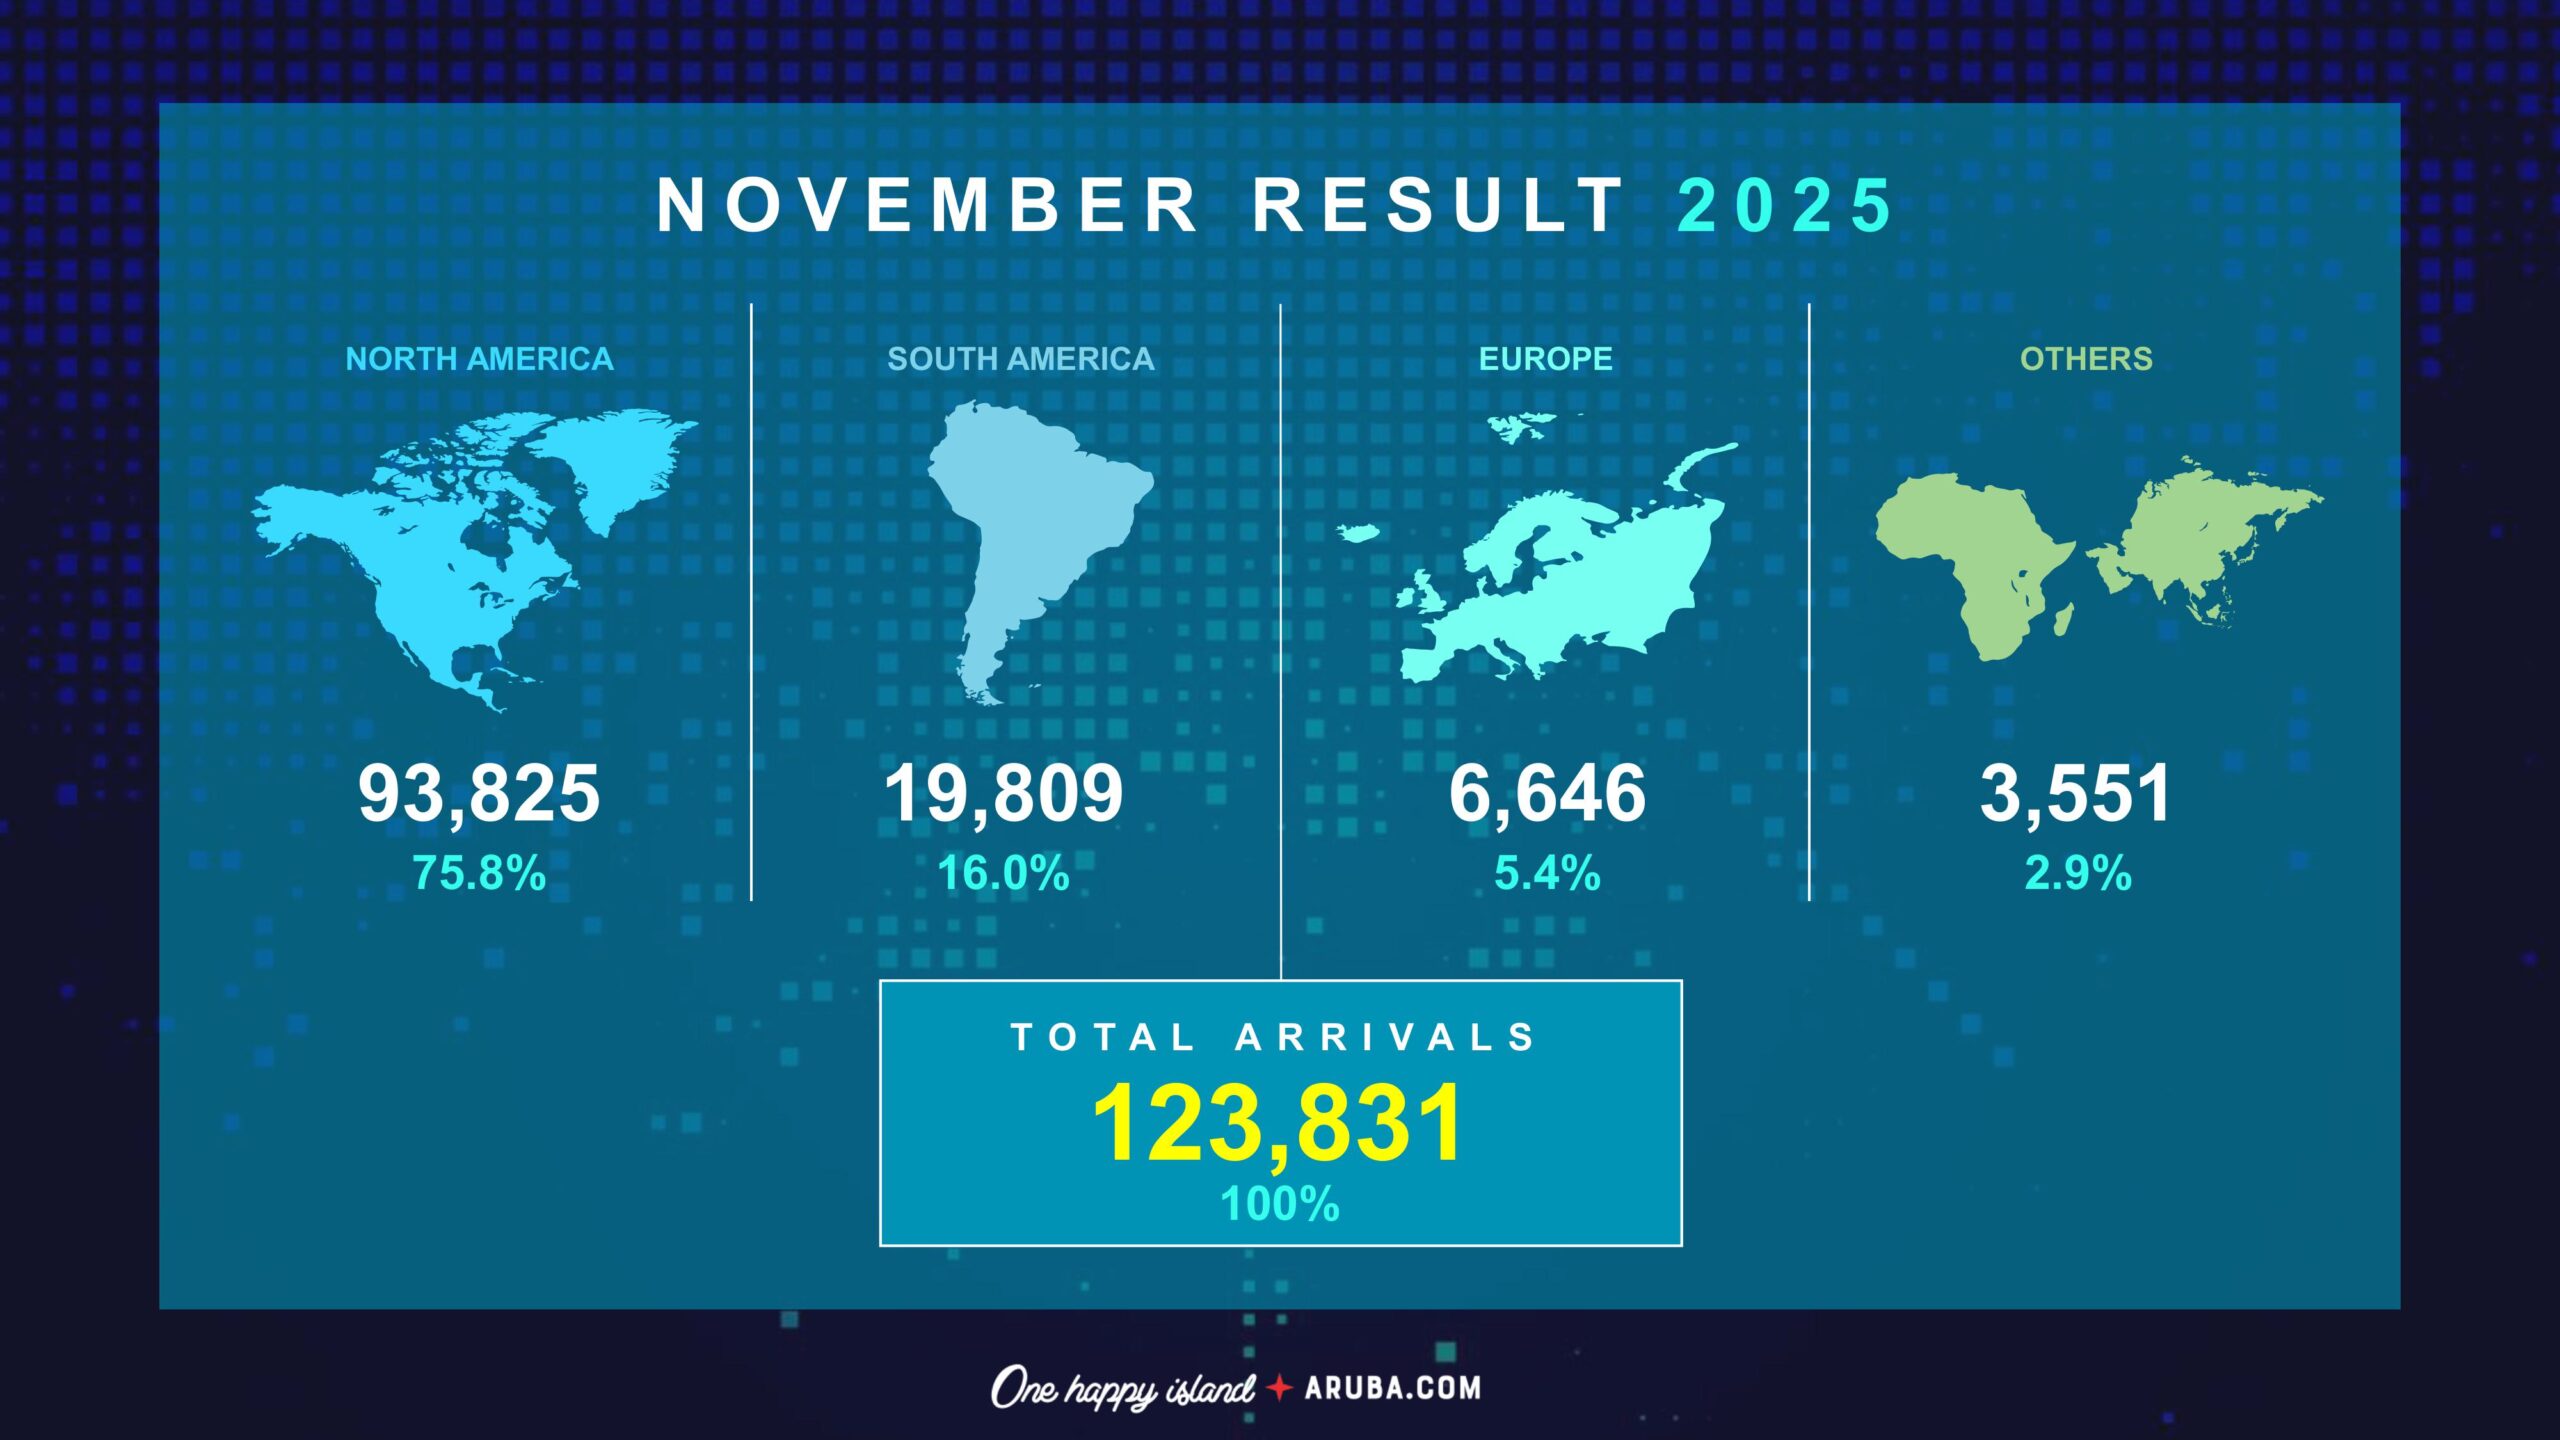
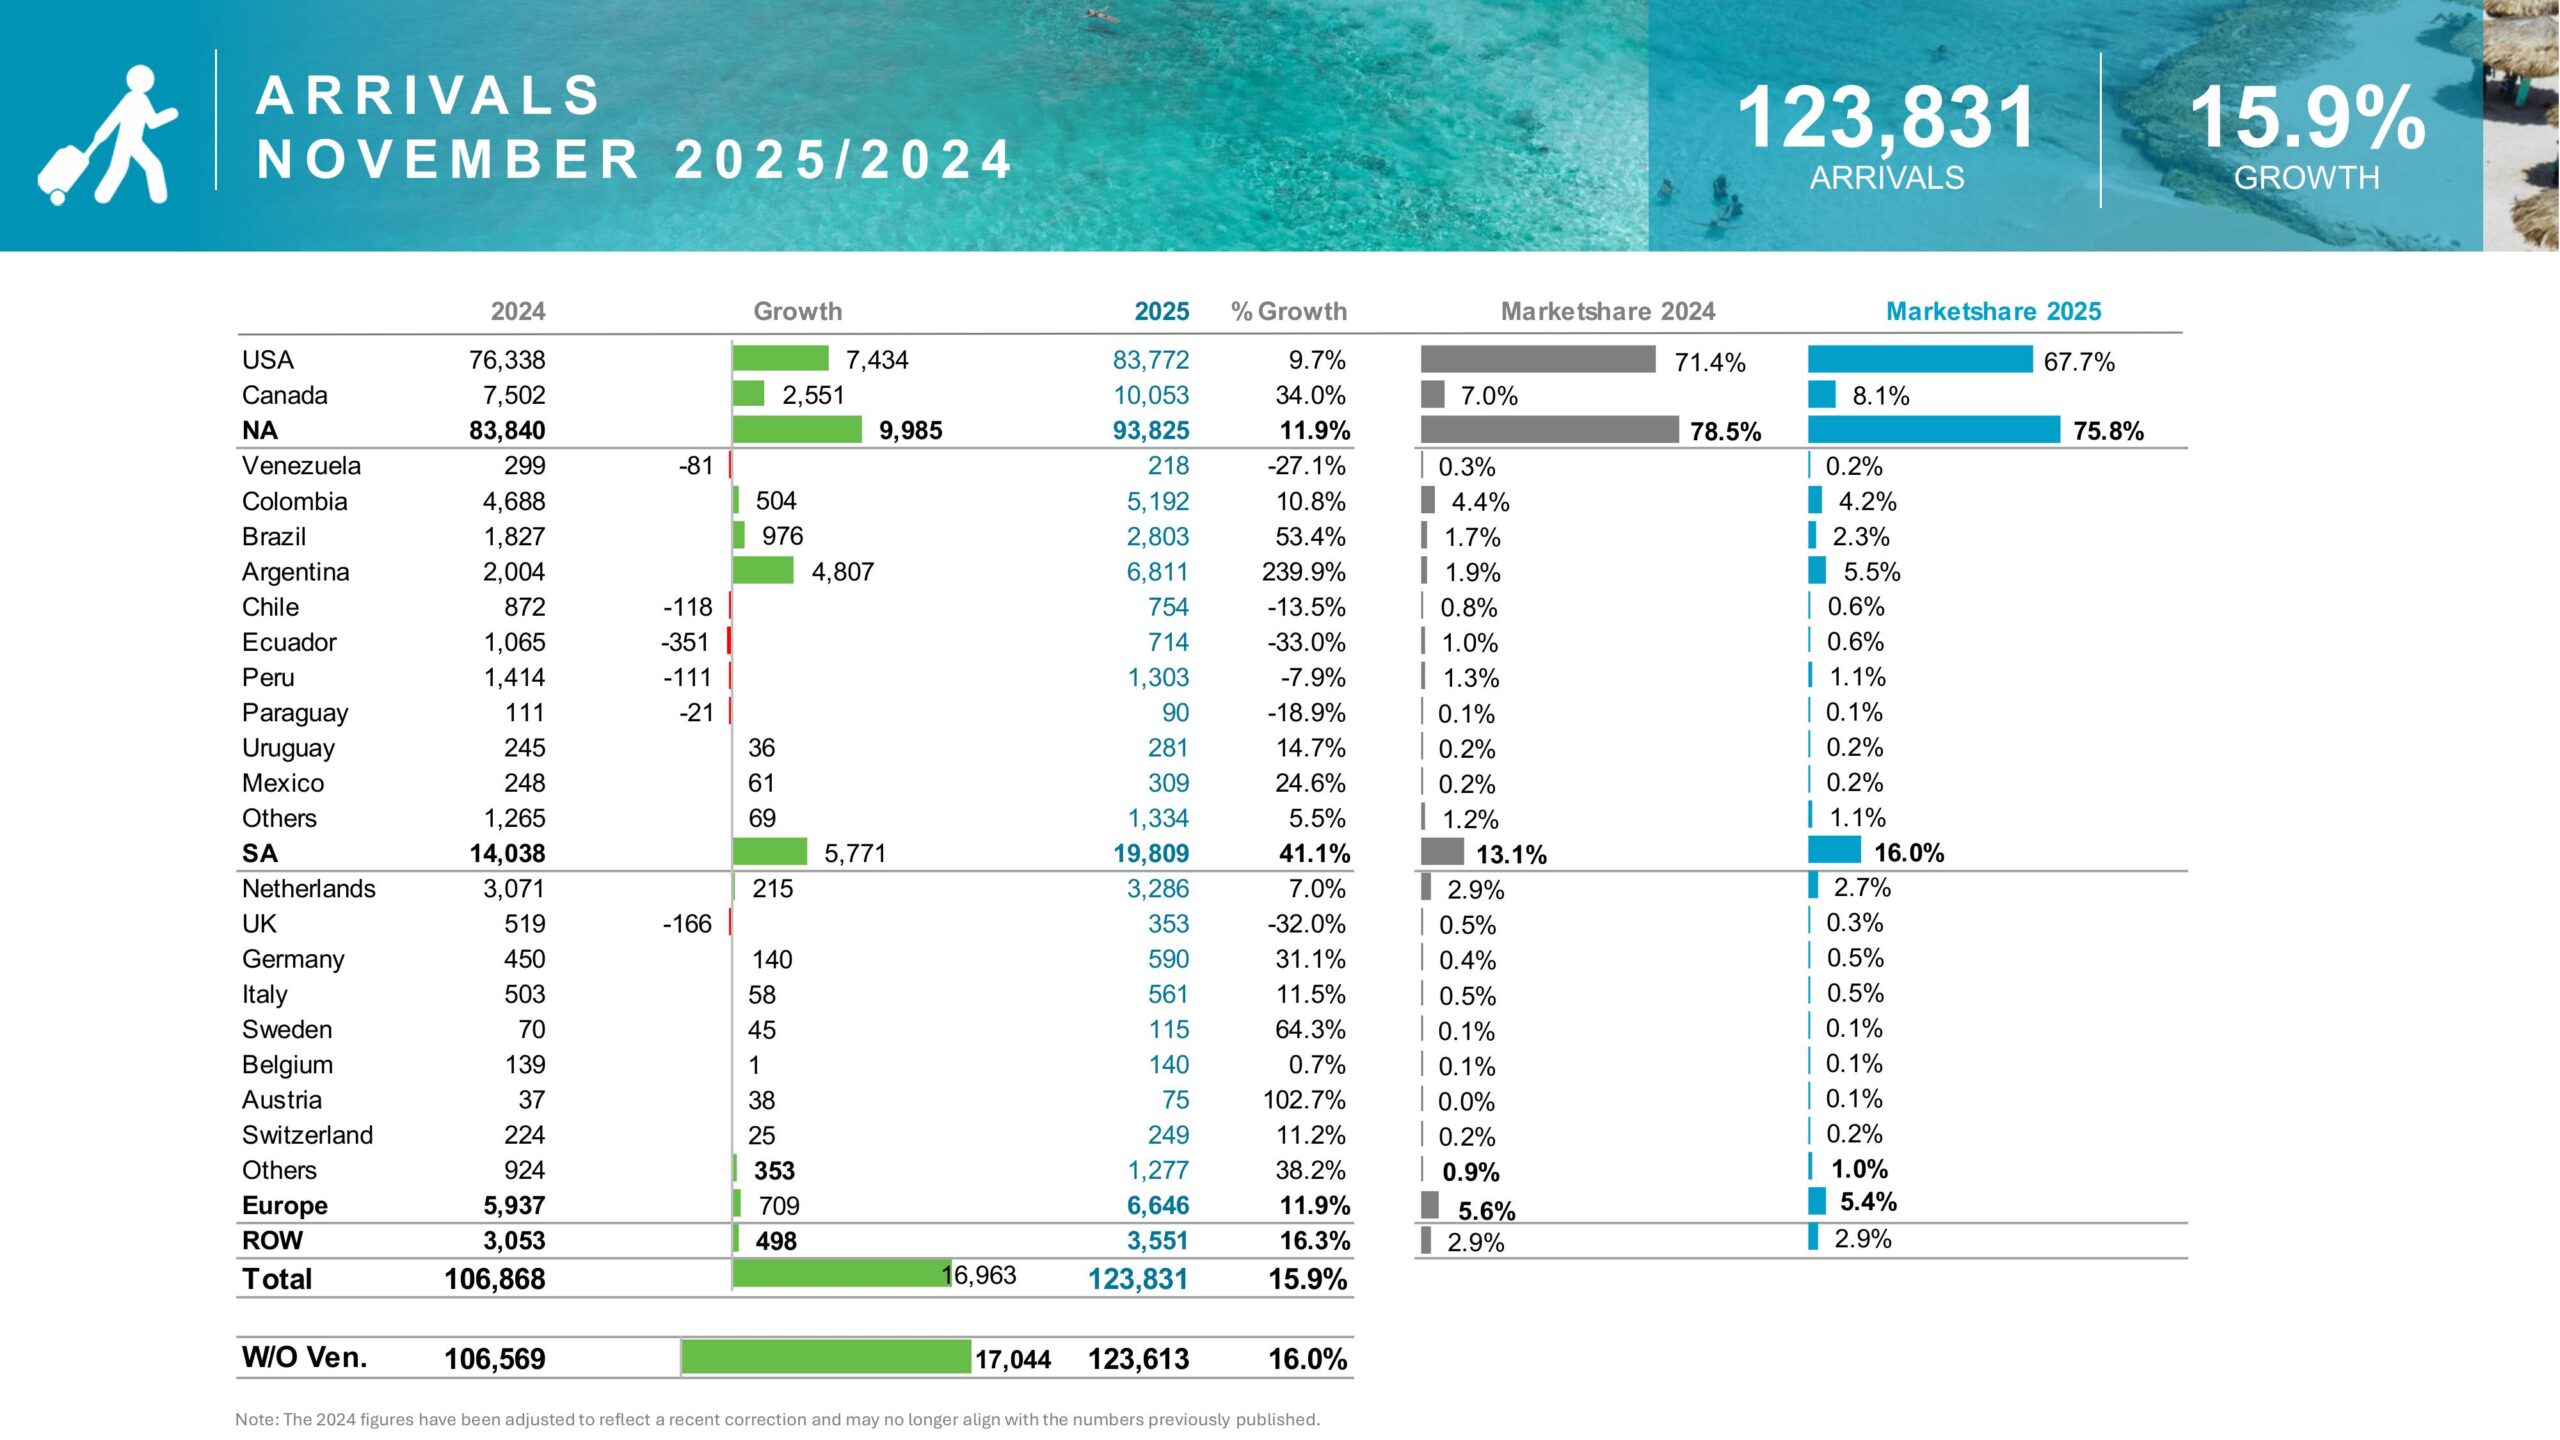
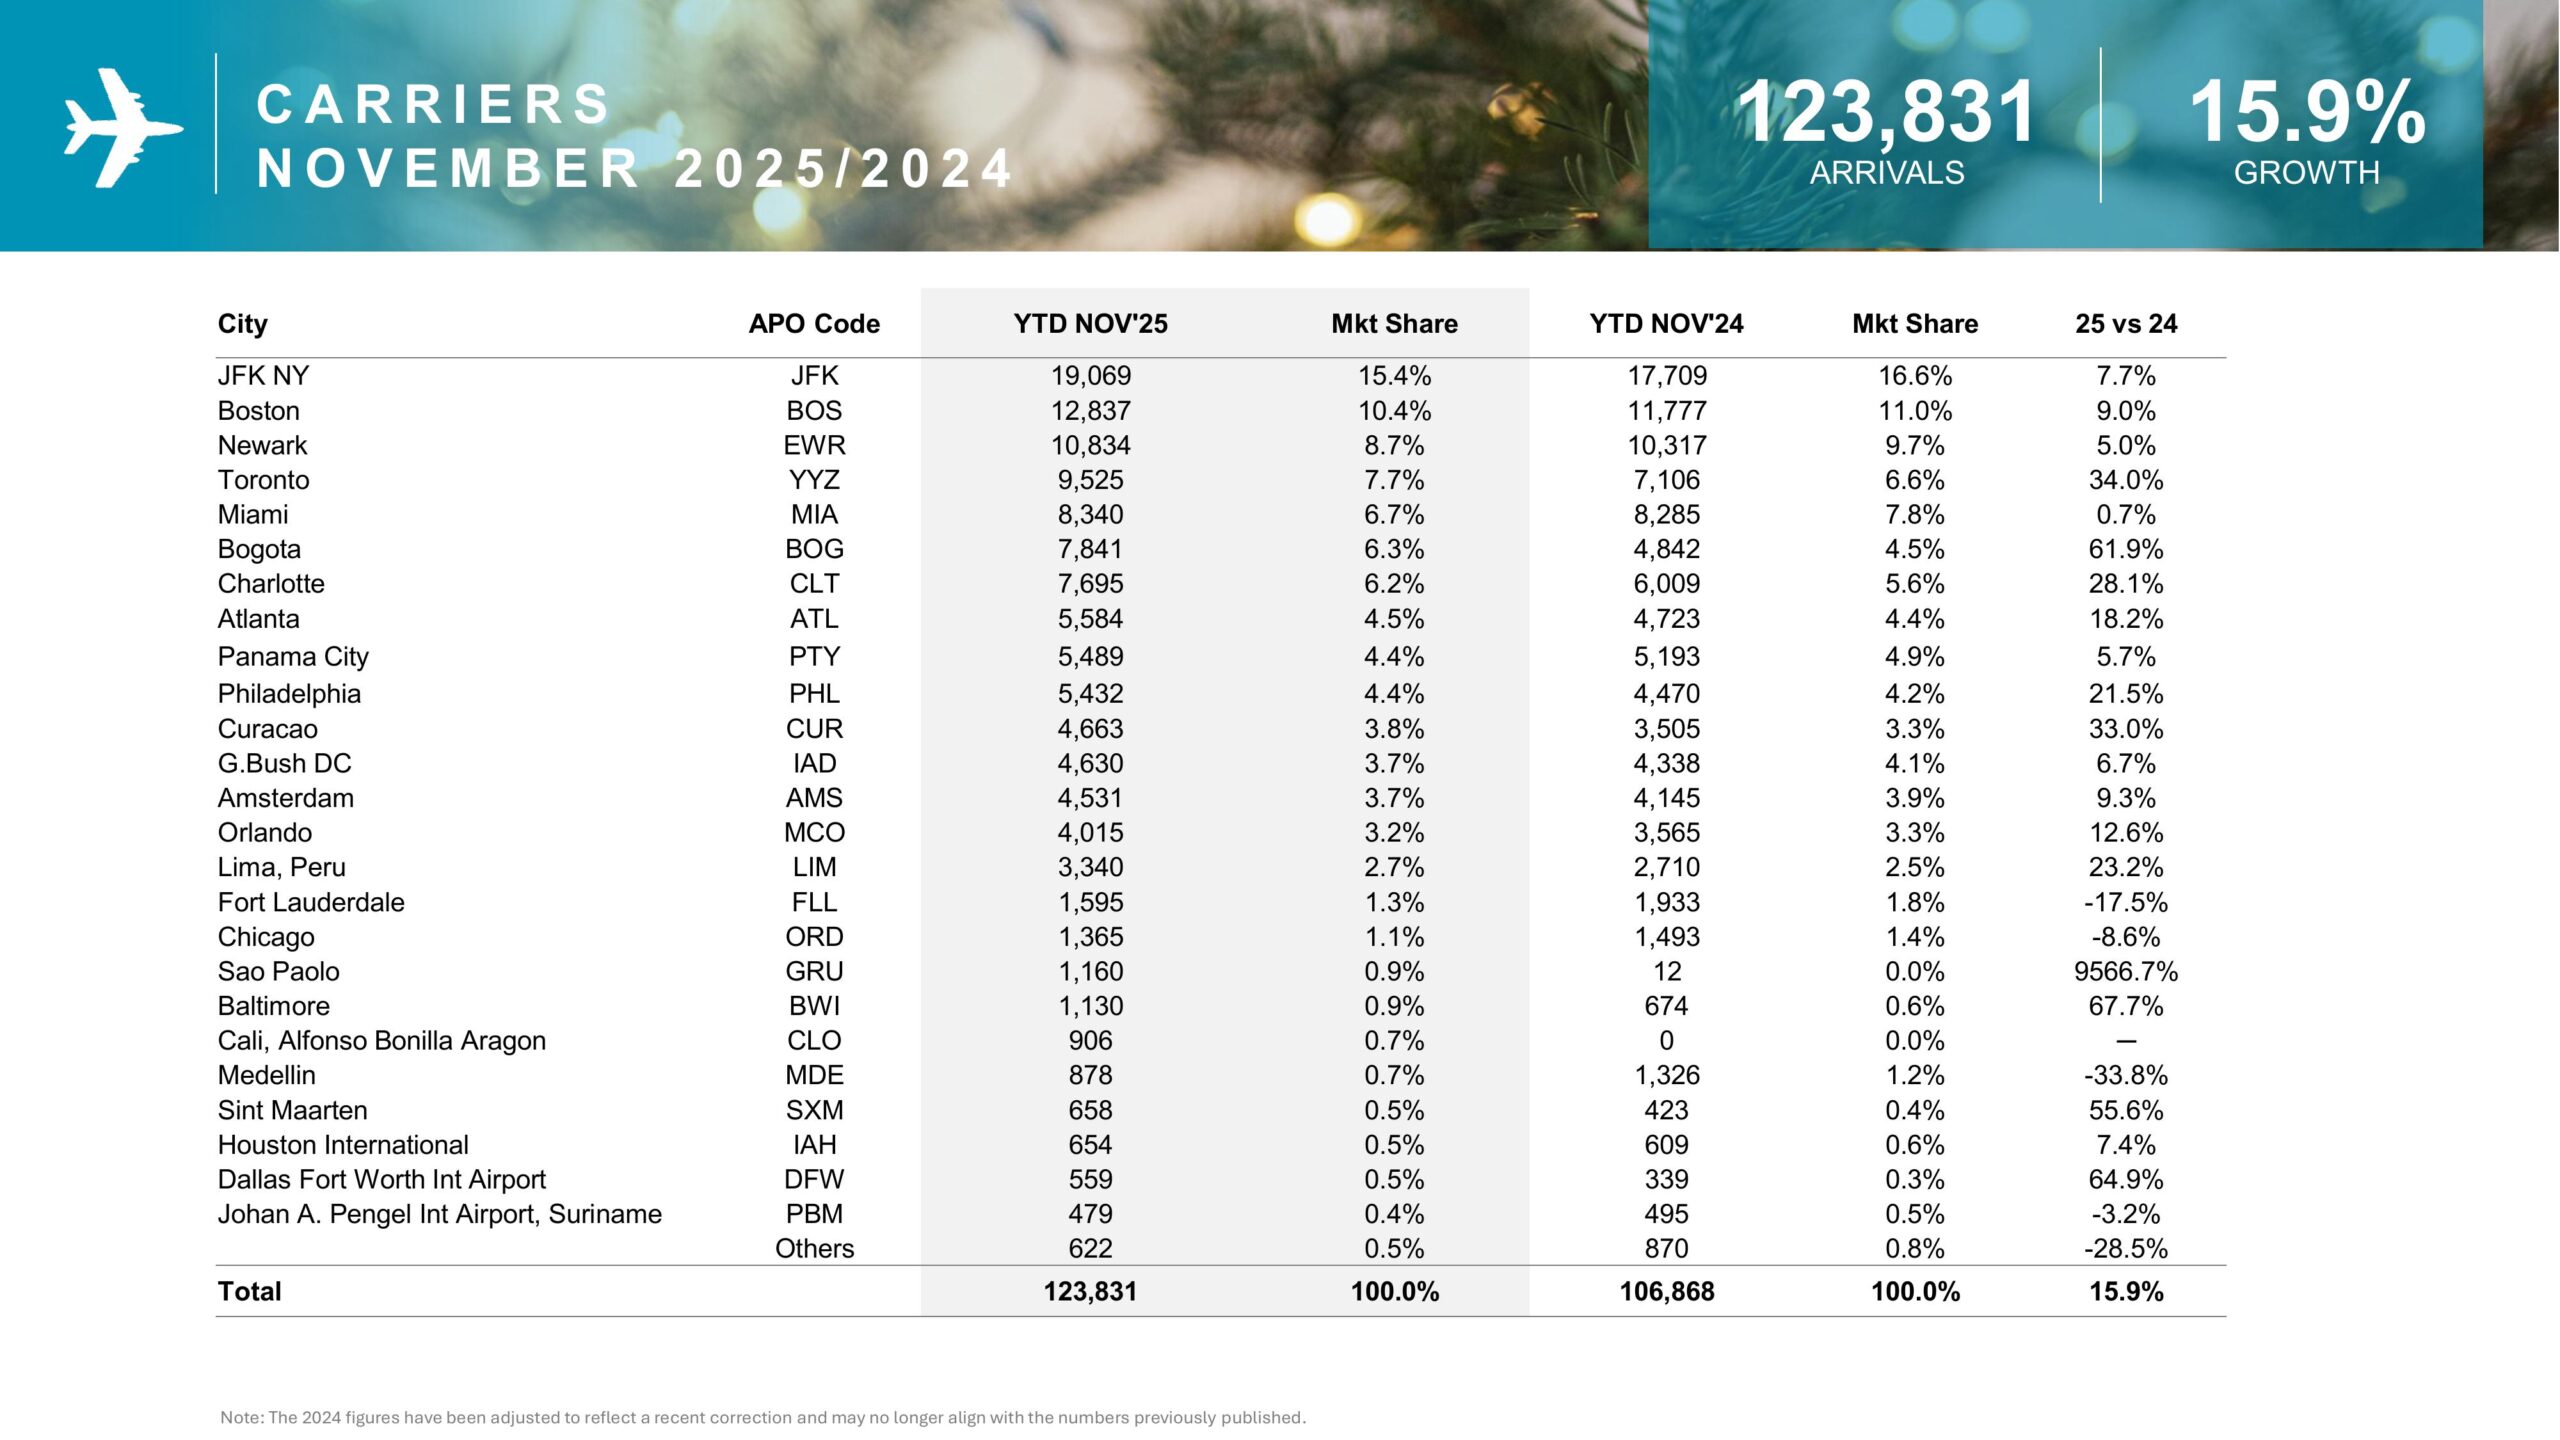
November 2025 Arrival Performance
November 2025 delivered strong monthly momentum, as Aruba recorded 123,831 total arrivals, marking a 15.9% year-over-year increase. This robust result highlights rising seasonal demand and continued confidence in Aruba as a preferred Caribbean destination. Moreover, improved airlift and targeted marketing efforts helped sustain positive visitor flows during the month.


Regional Breakdown for November 2025
Arrival trends varied by region, yet overall performance remained positive. North America led the market with 93,825 arrivals, reflecting an 11.9% increase compared to November 2024. At the same time, South America showed exceptional strength, welcoming 19,809 visitors, a notable 41.1% growth, driven primarily by Argentina and Brazil.
Meanwhile, Europe contributed 6,646 arrivals, posting 11.9% growth, supported by improved connectivity and steady demand from key source countries. Additionally, other international markets accounted for 3,551 arrivals, reinforcing Aruba’s diversified tourism base and strengthening overall November performance.

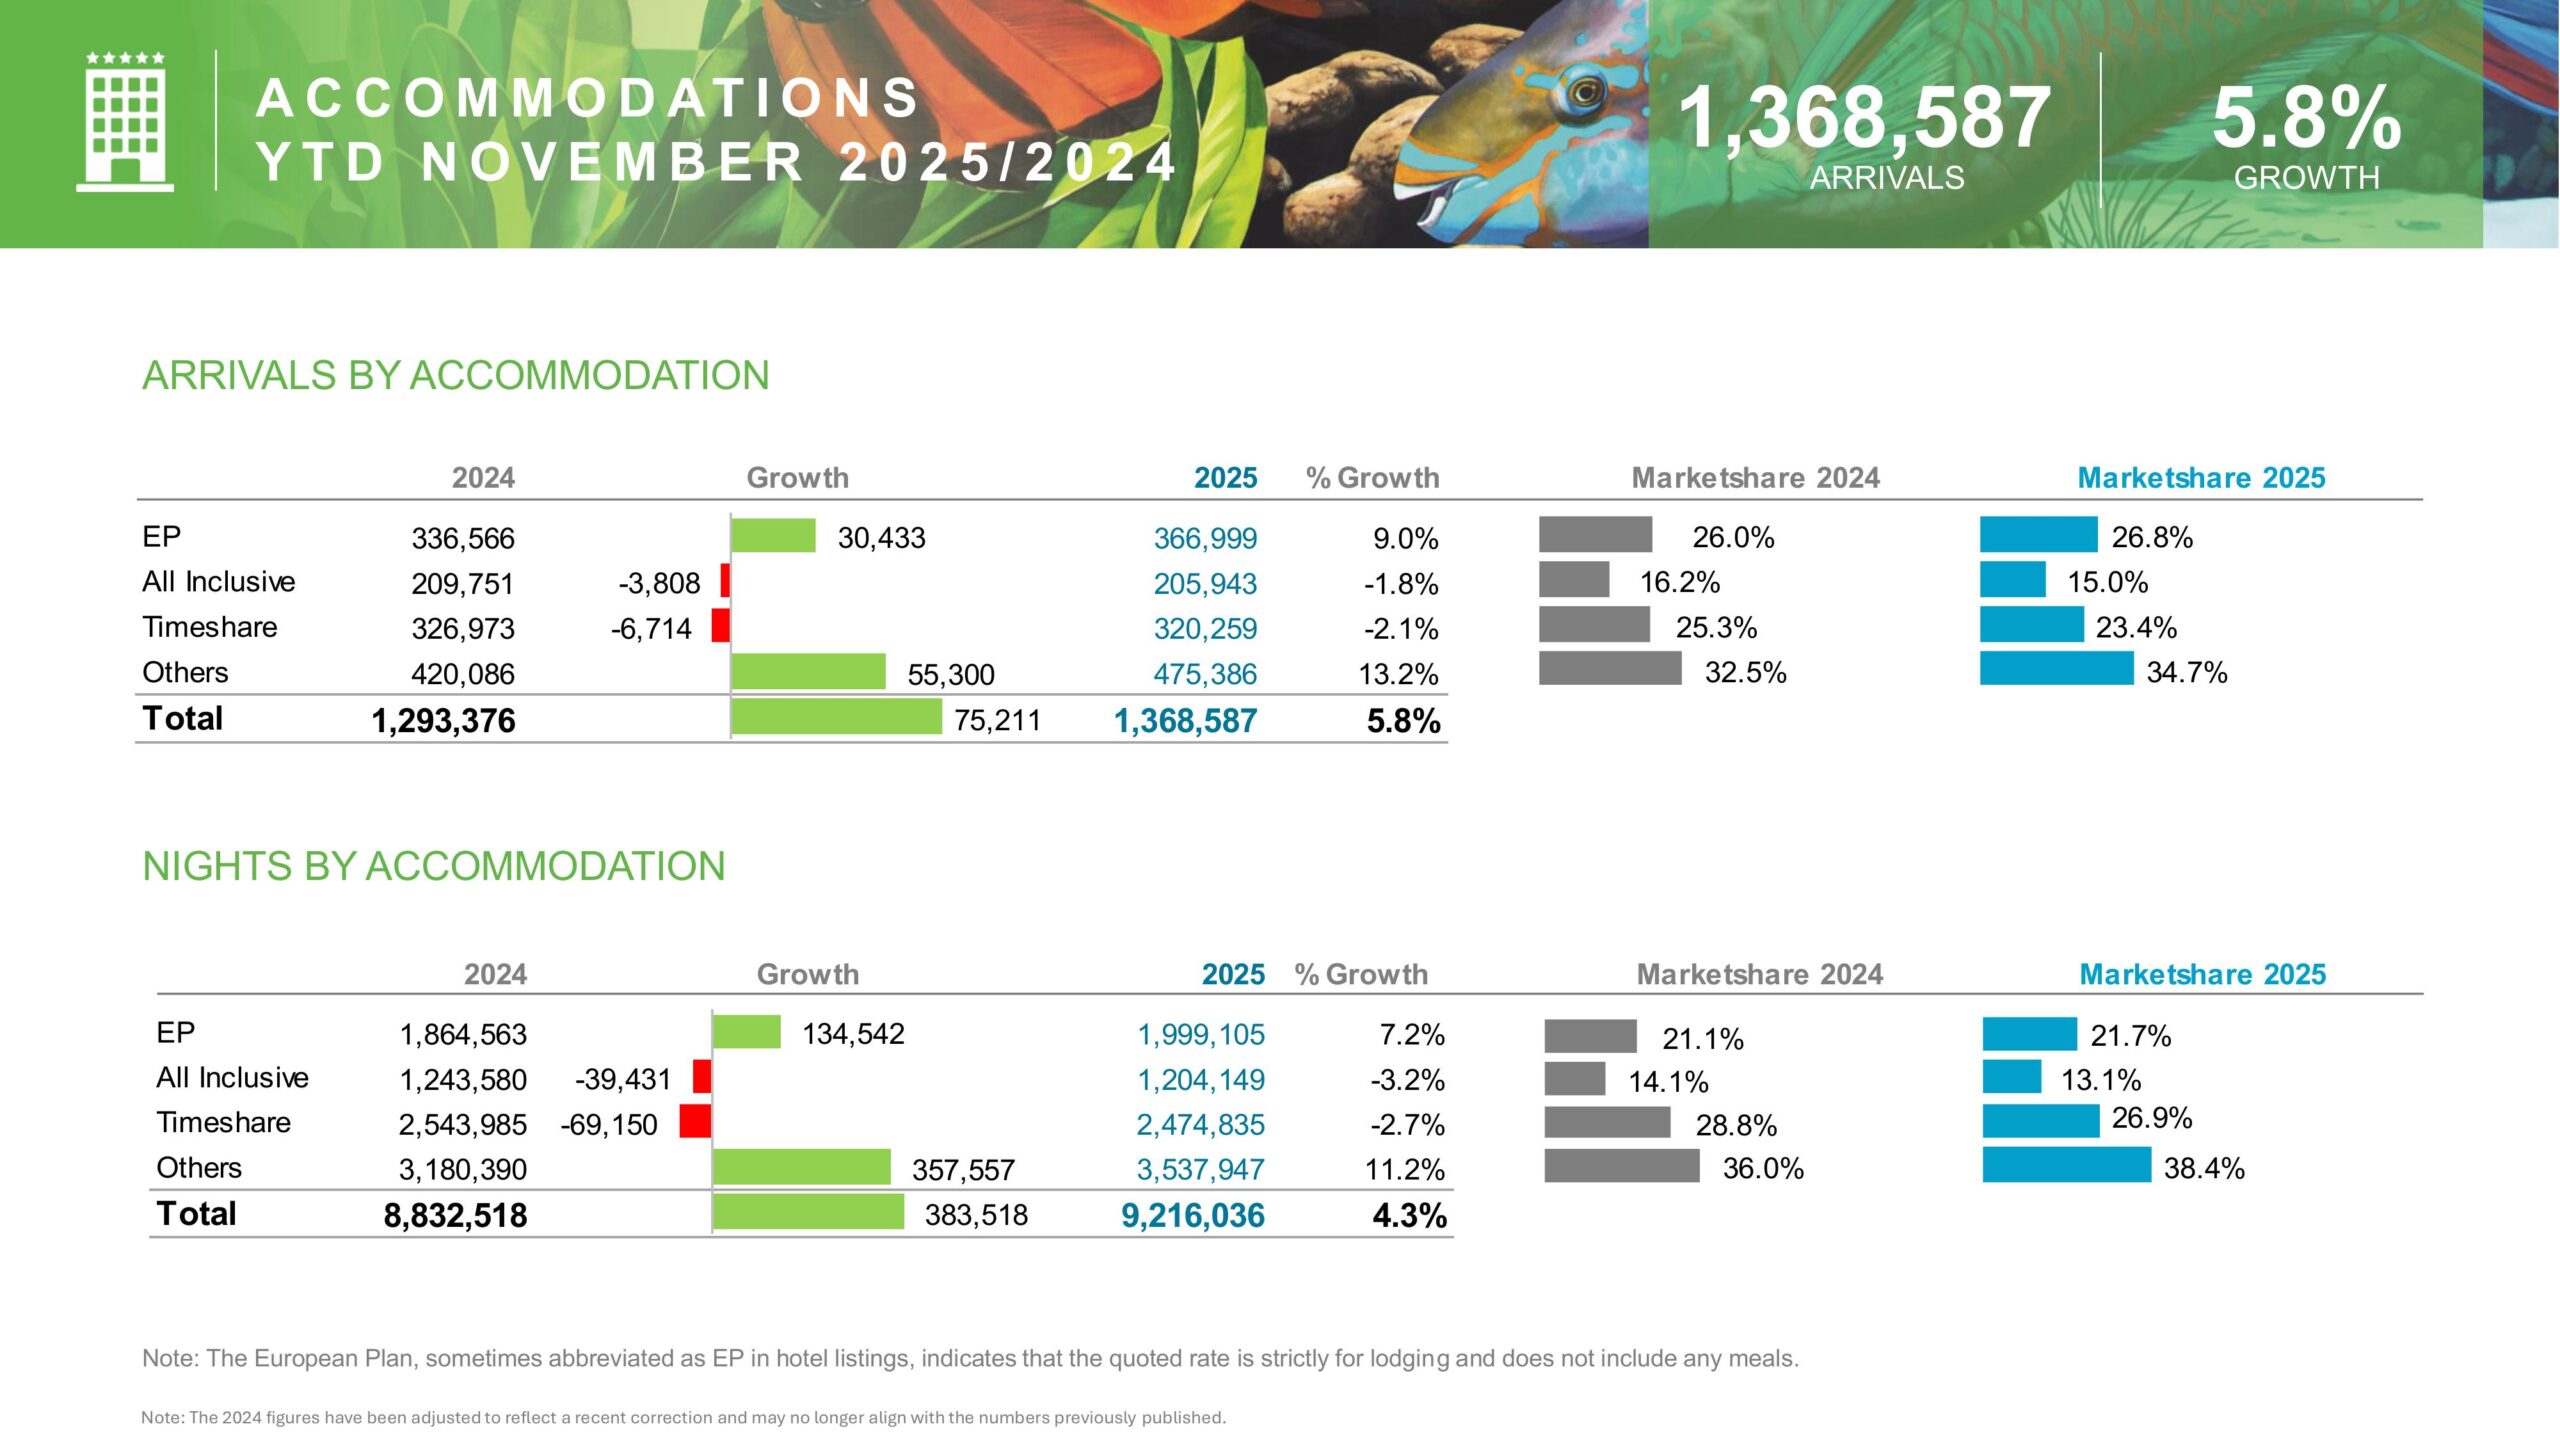
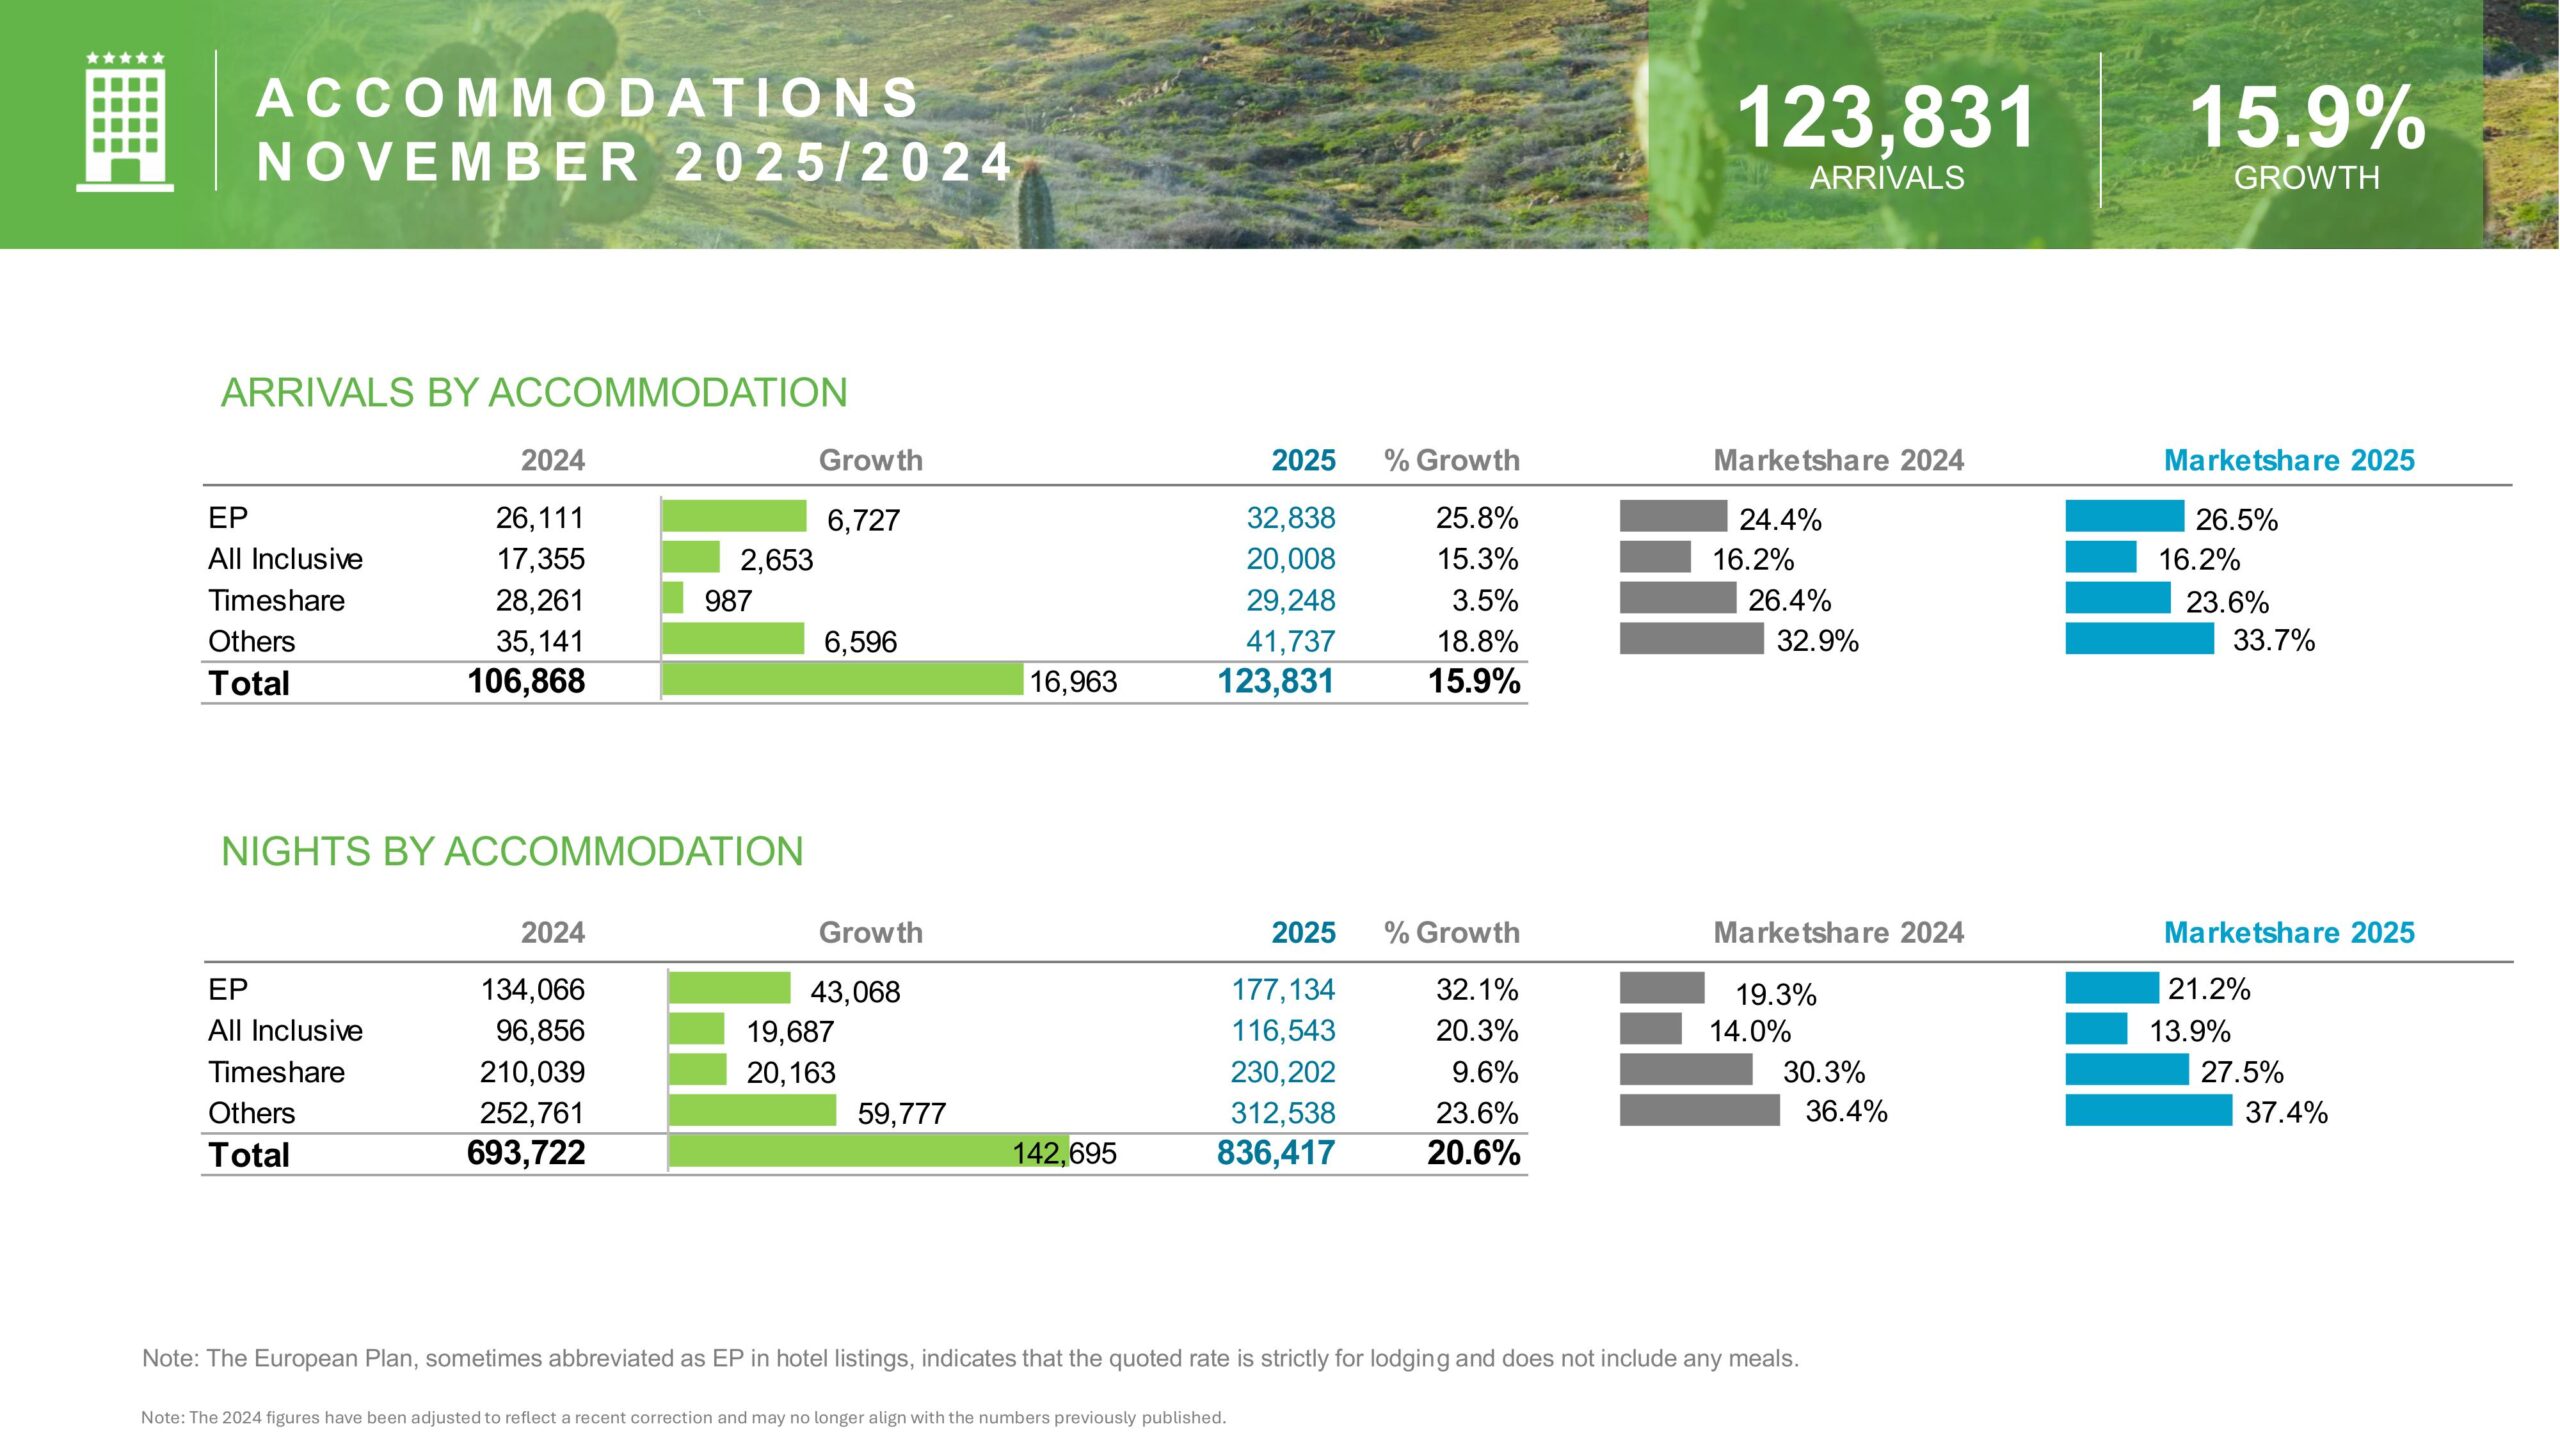
Accommodation Trends Supporting Aruba Tourism Performance 2025
Accommodation choices reveal evolving visitor preferences.
Year-to-Date Accommodation Share
- European Plan (EP): 21.7%
- All-Inclusive Resorts: 13.1%
- Timeshare: 26.9%
- Other Accommodations: 38.4%
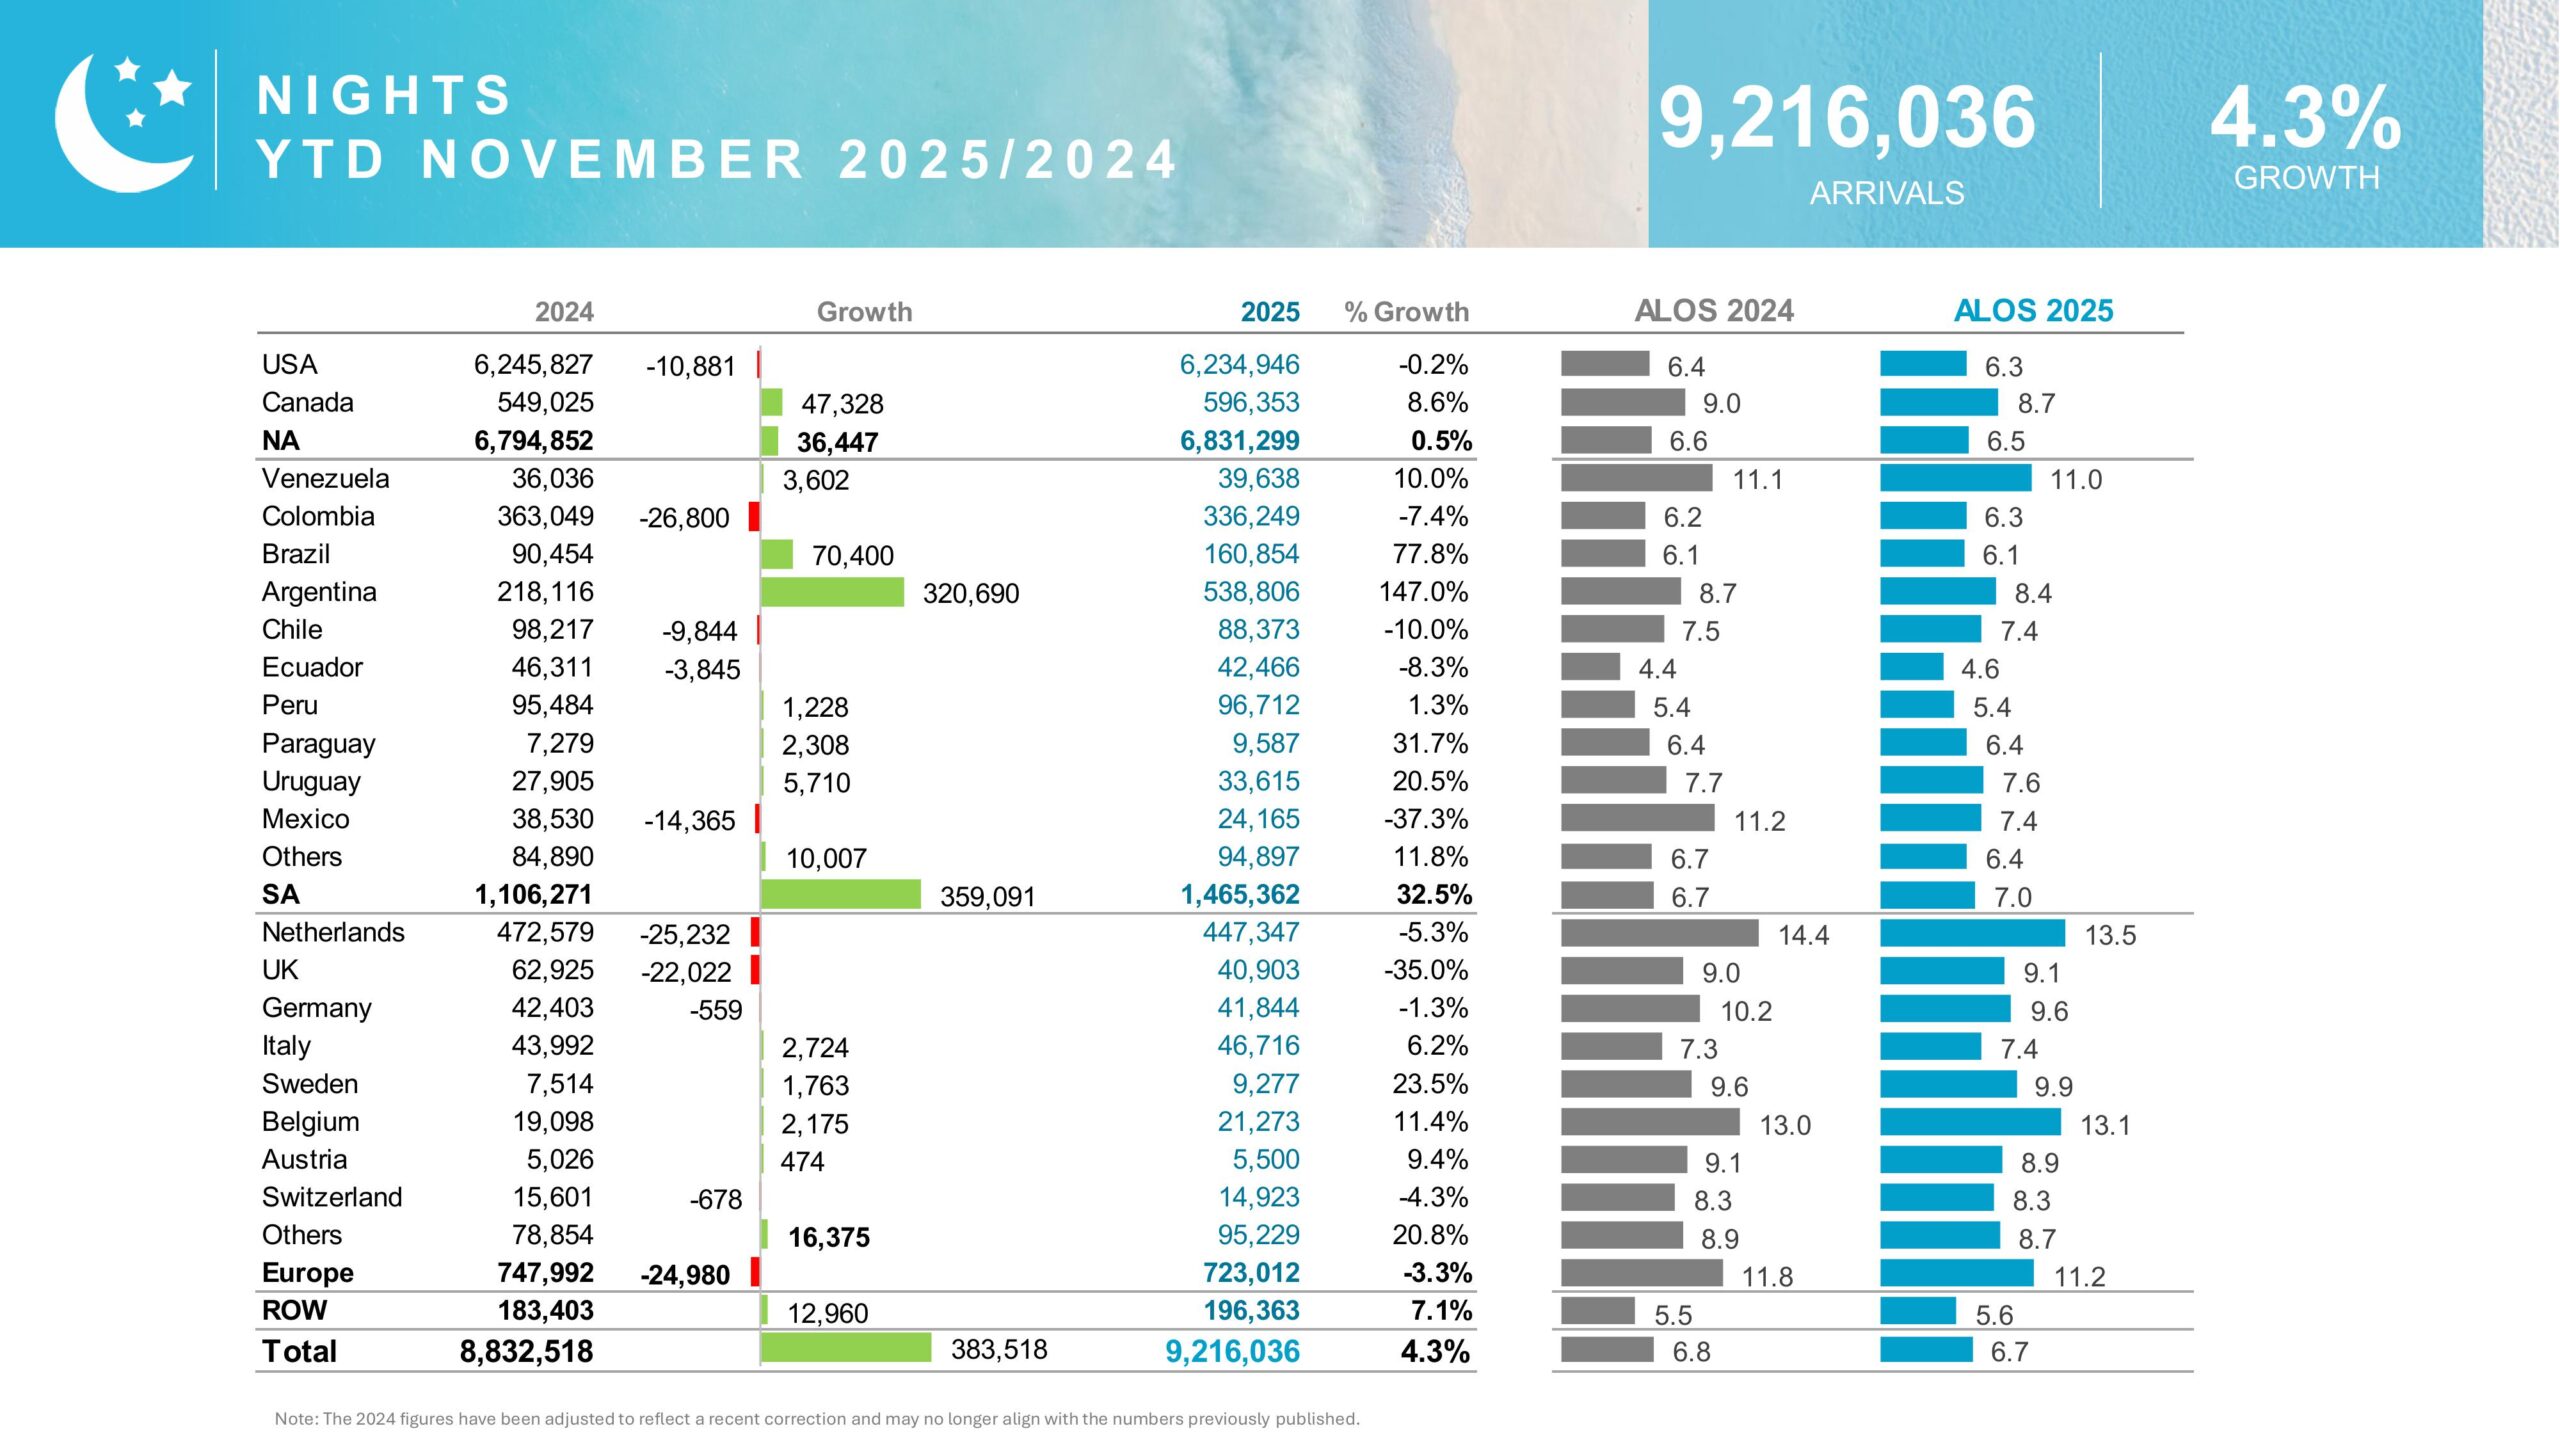
Additionally, total nights stayed increased by 4.3%, reaching 9.2 million nights. Therefore, longer stays continue to support local businesses and tourism revenue.

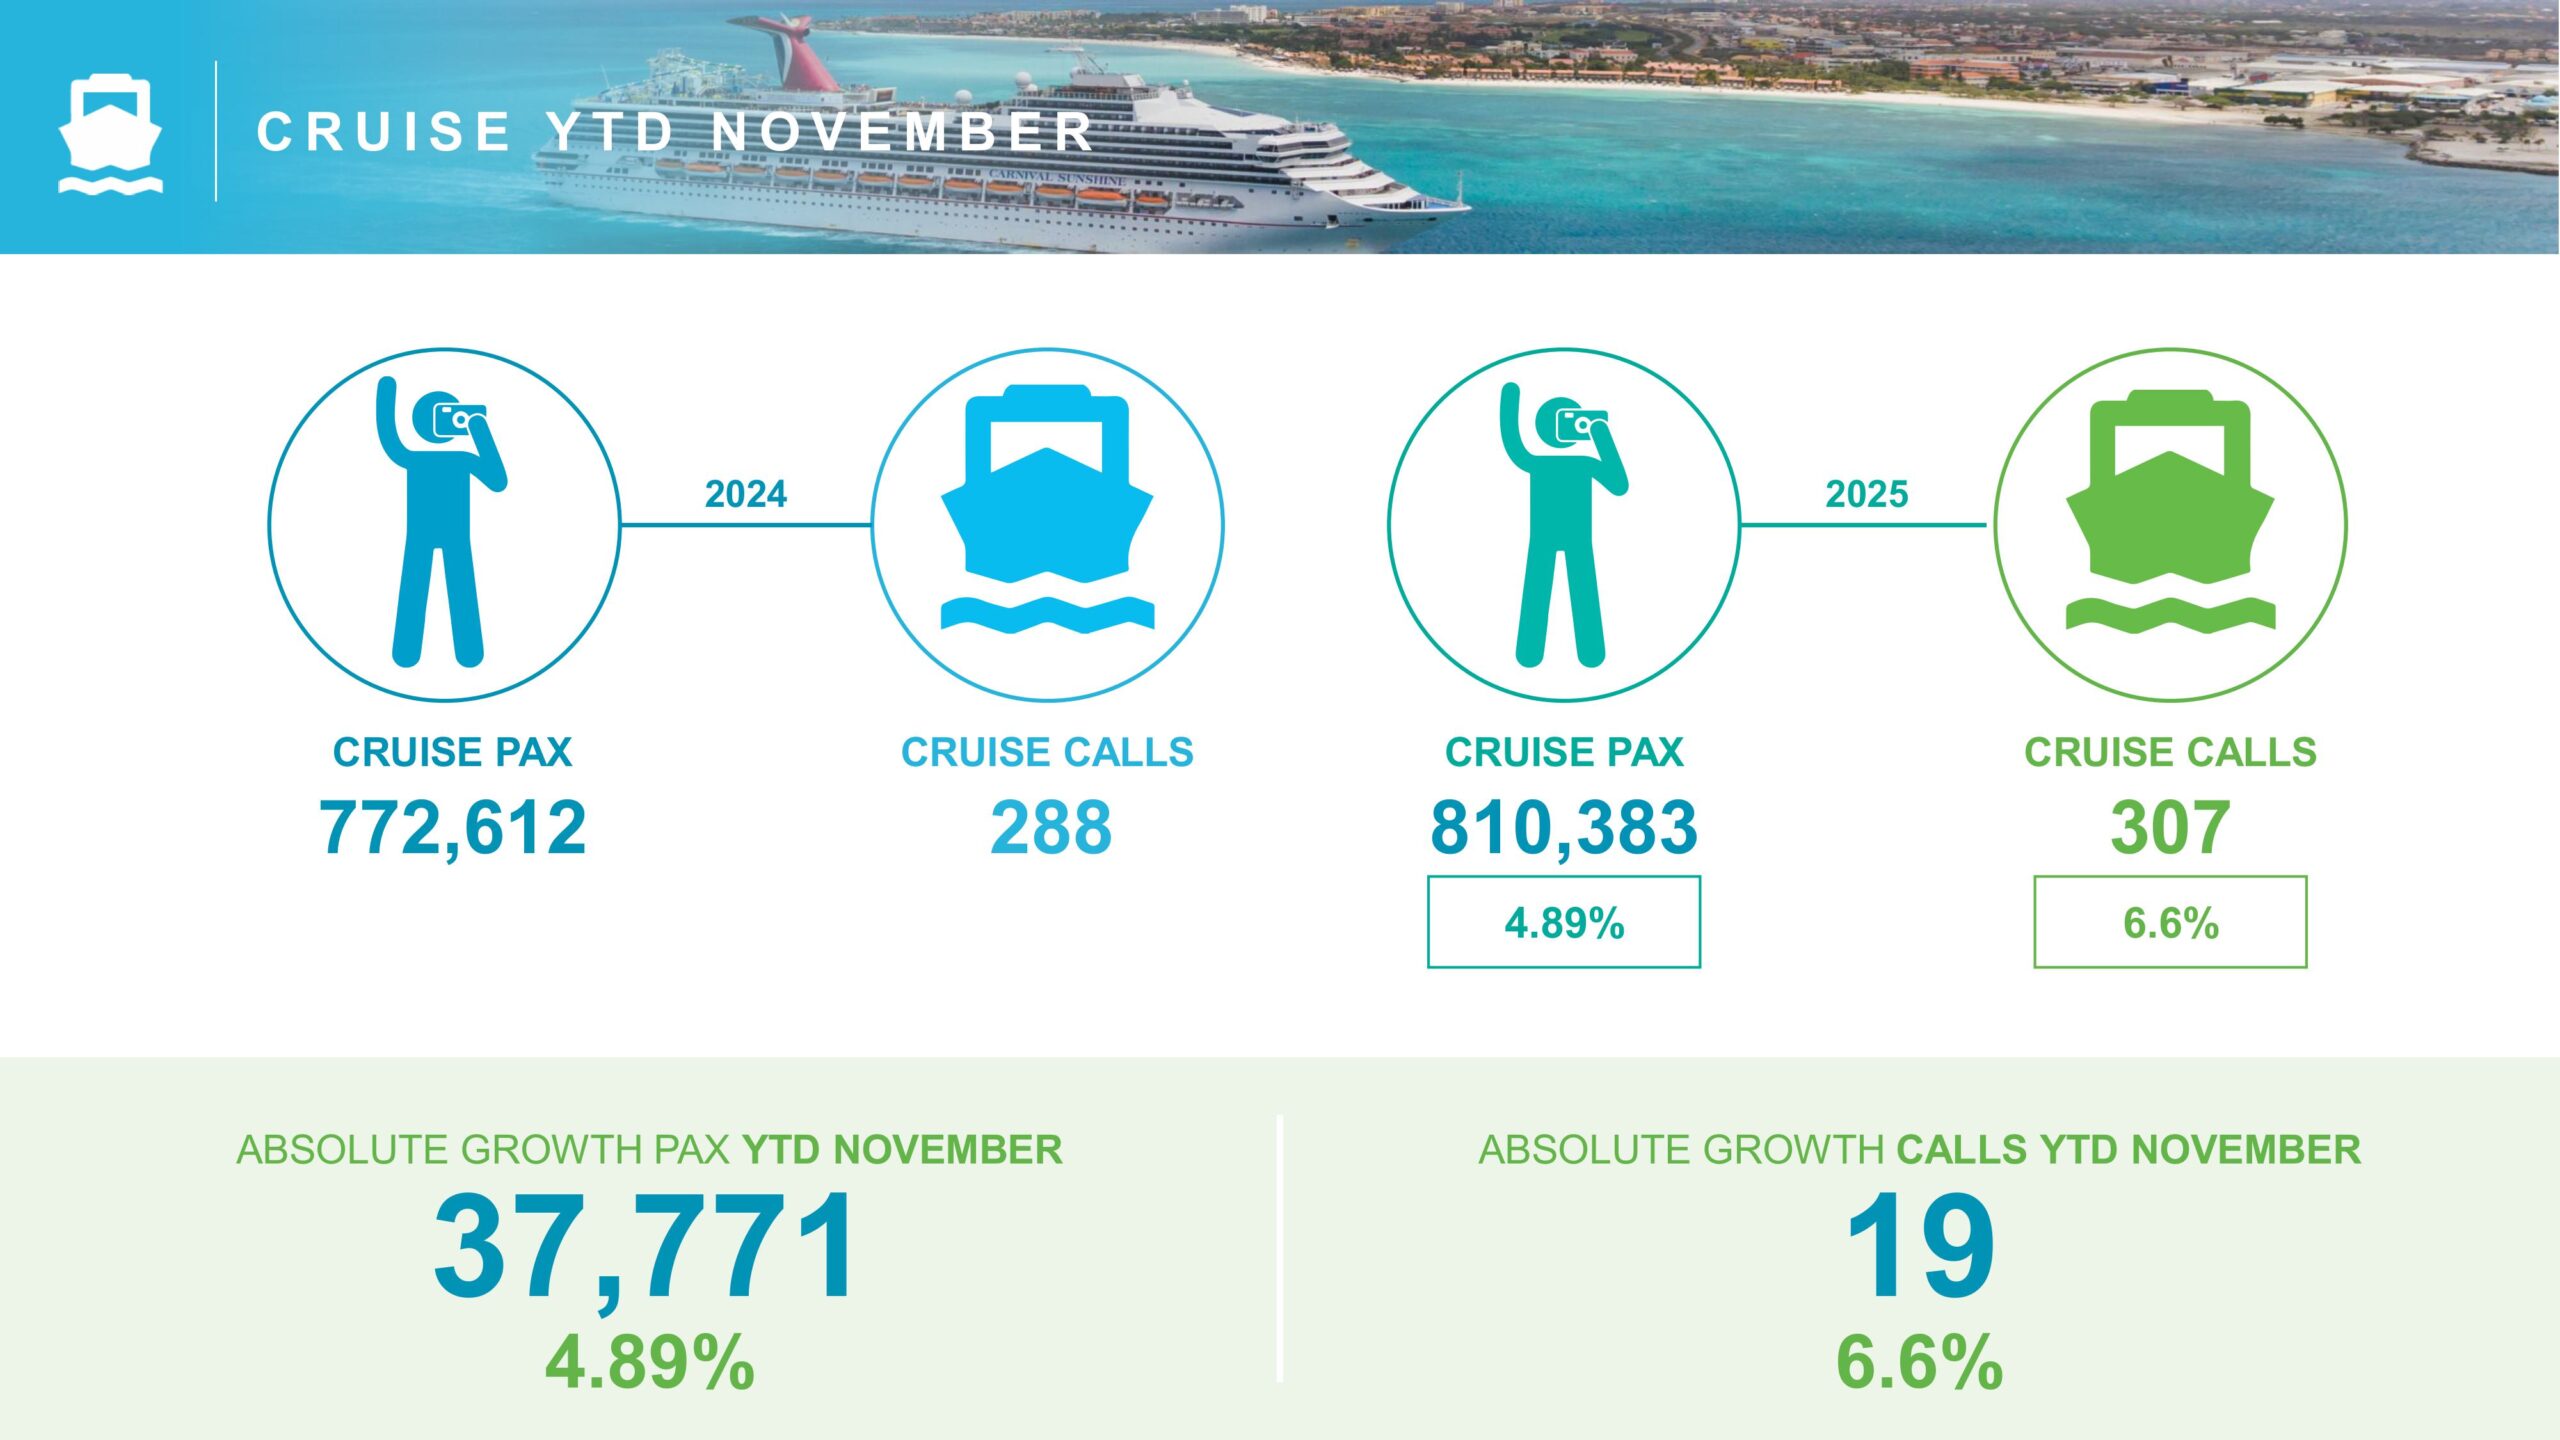
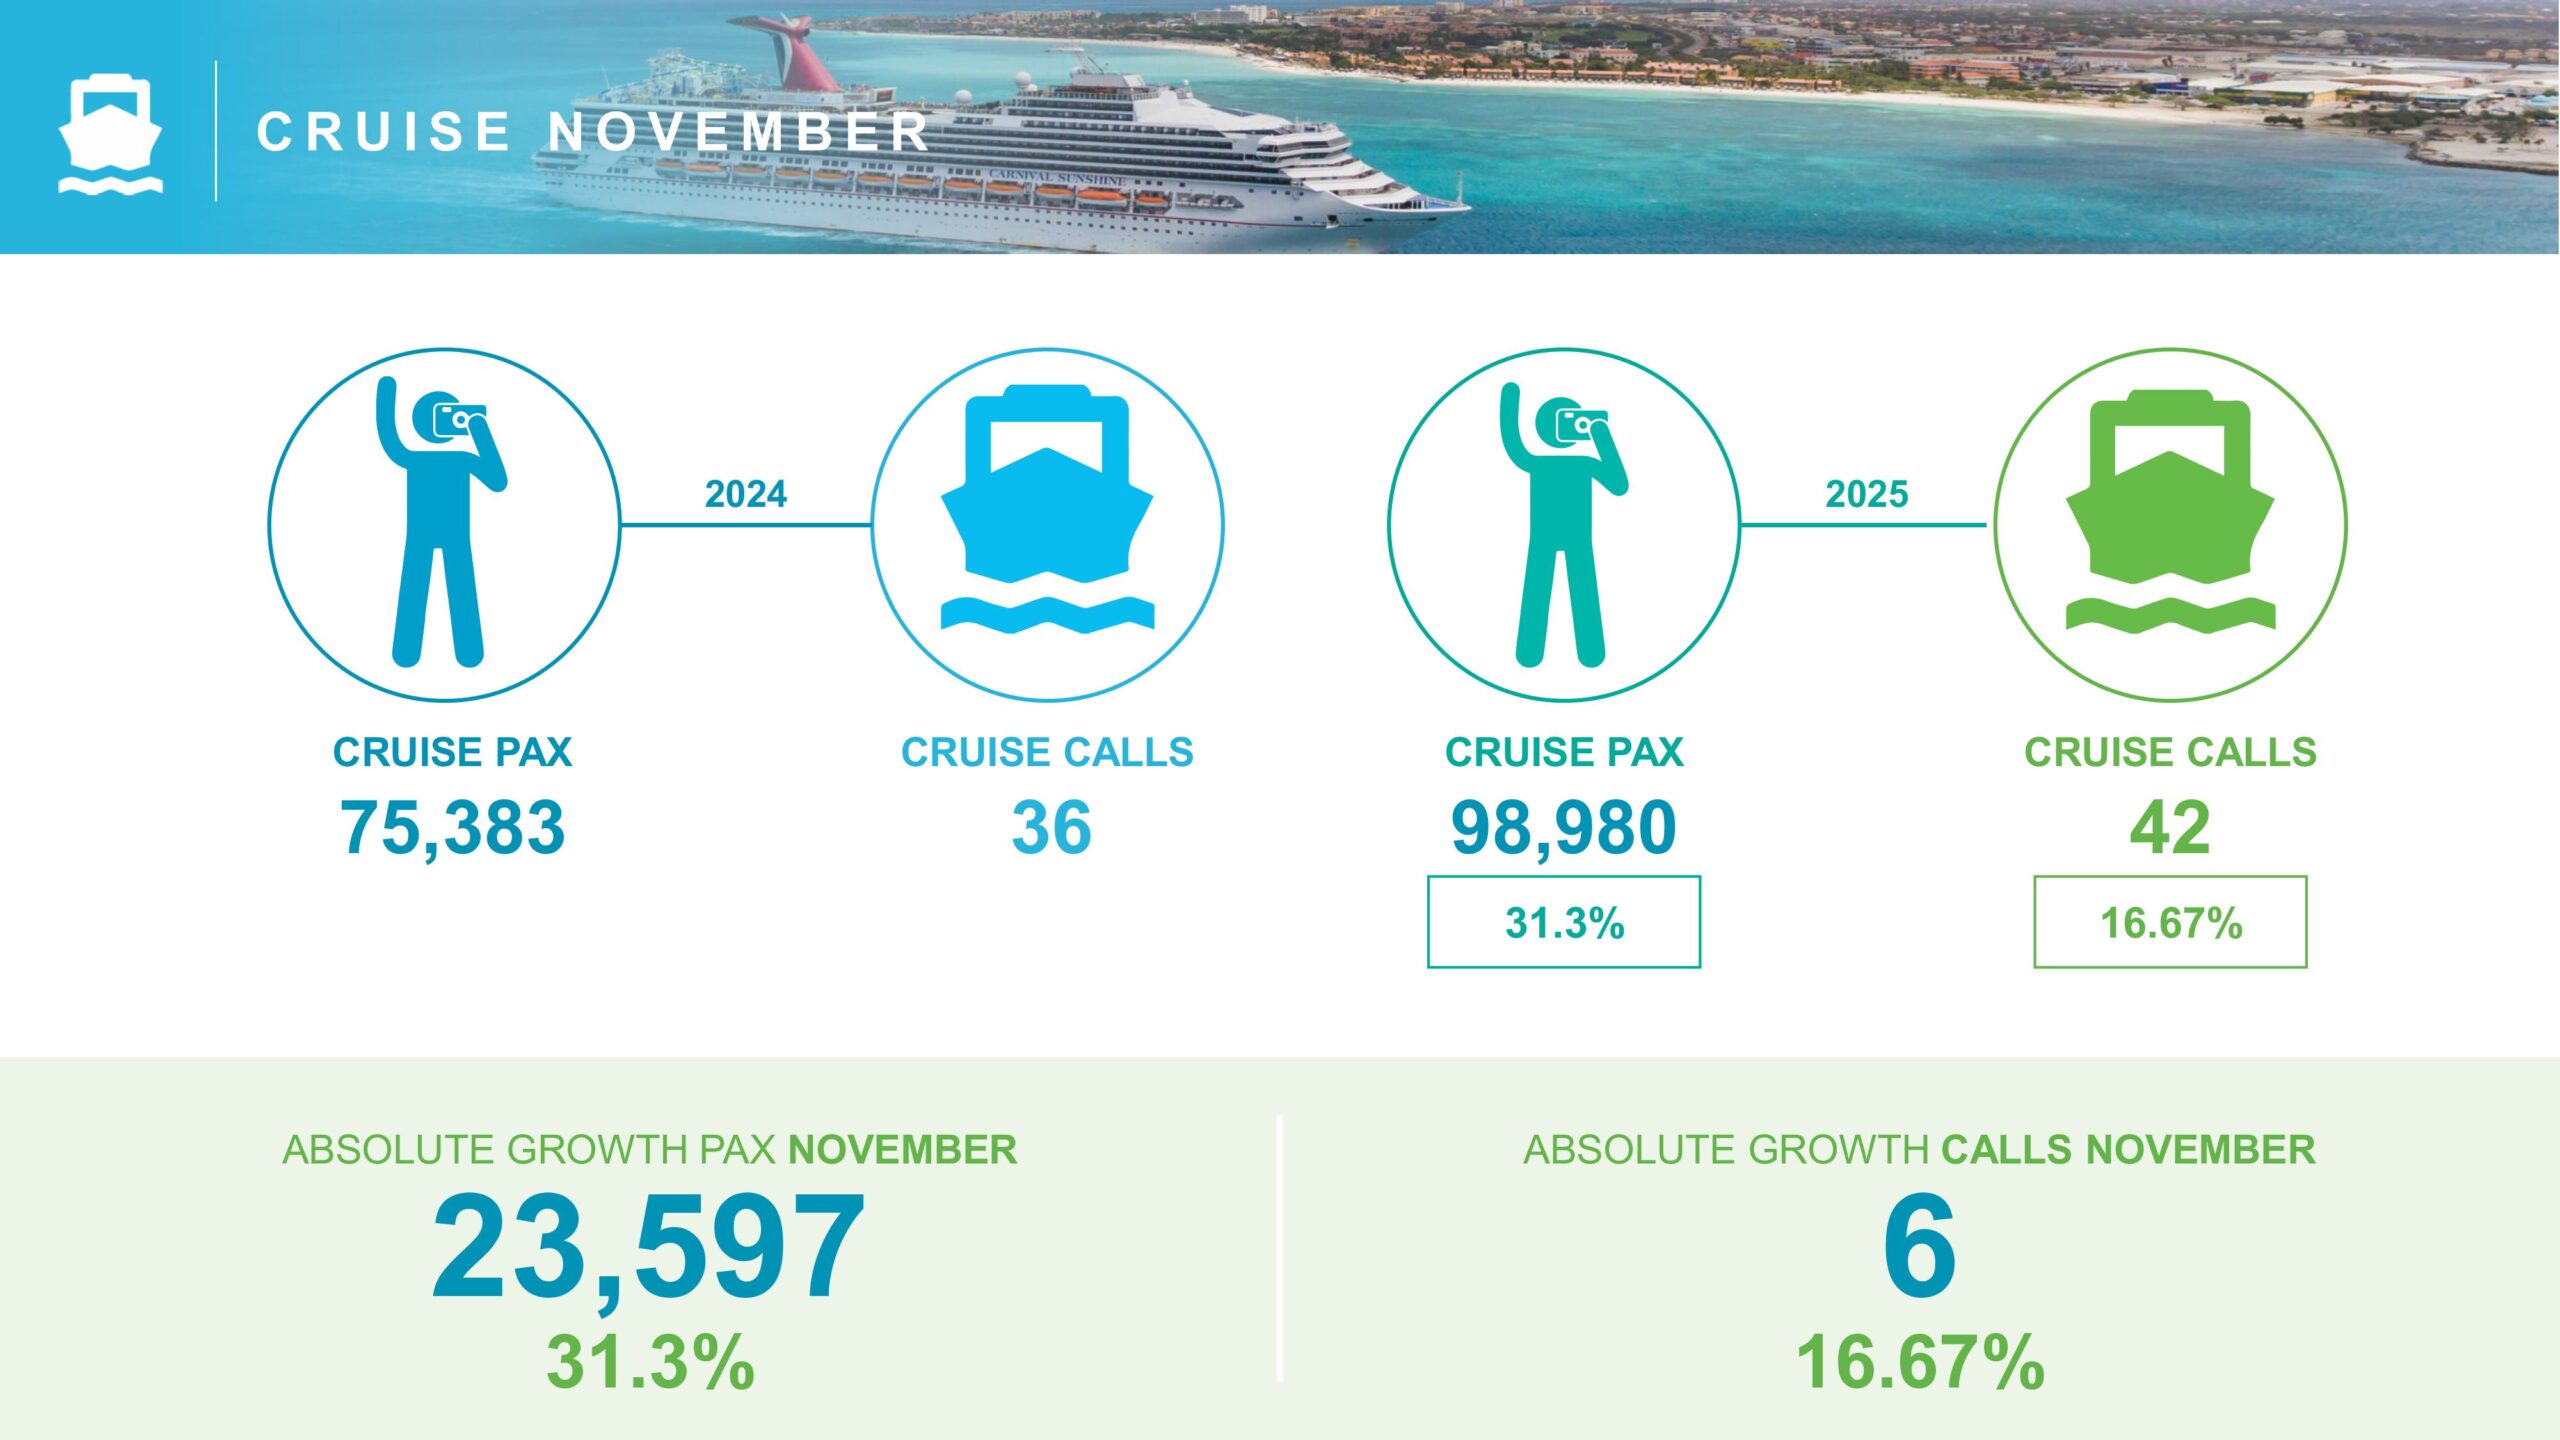
Cruise Tourism Performance in 2025
Cruise tourism also contributed to Aruba tourism performance 2025. Year-to-date cruise passenger arrivals reached 810,383, reflecting 5.0% growth compared to 2024.
In November alone, cruise passenger volume rose by 31.3%, supported by increased cruise calls. Consequently, cruise tourism remains a vital component of Aruba’s tourism mix.
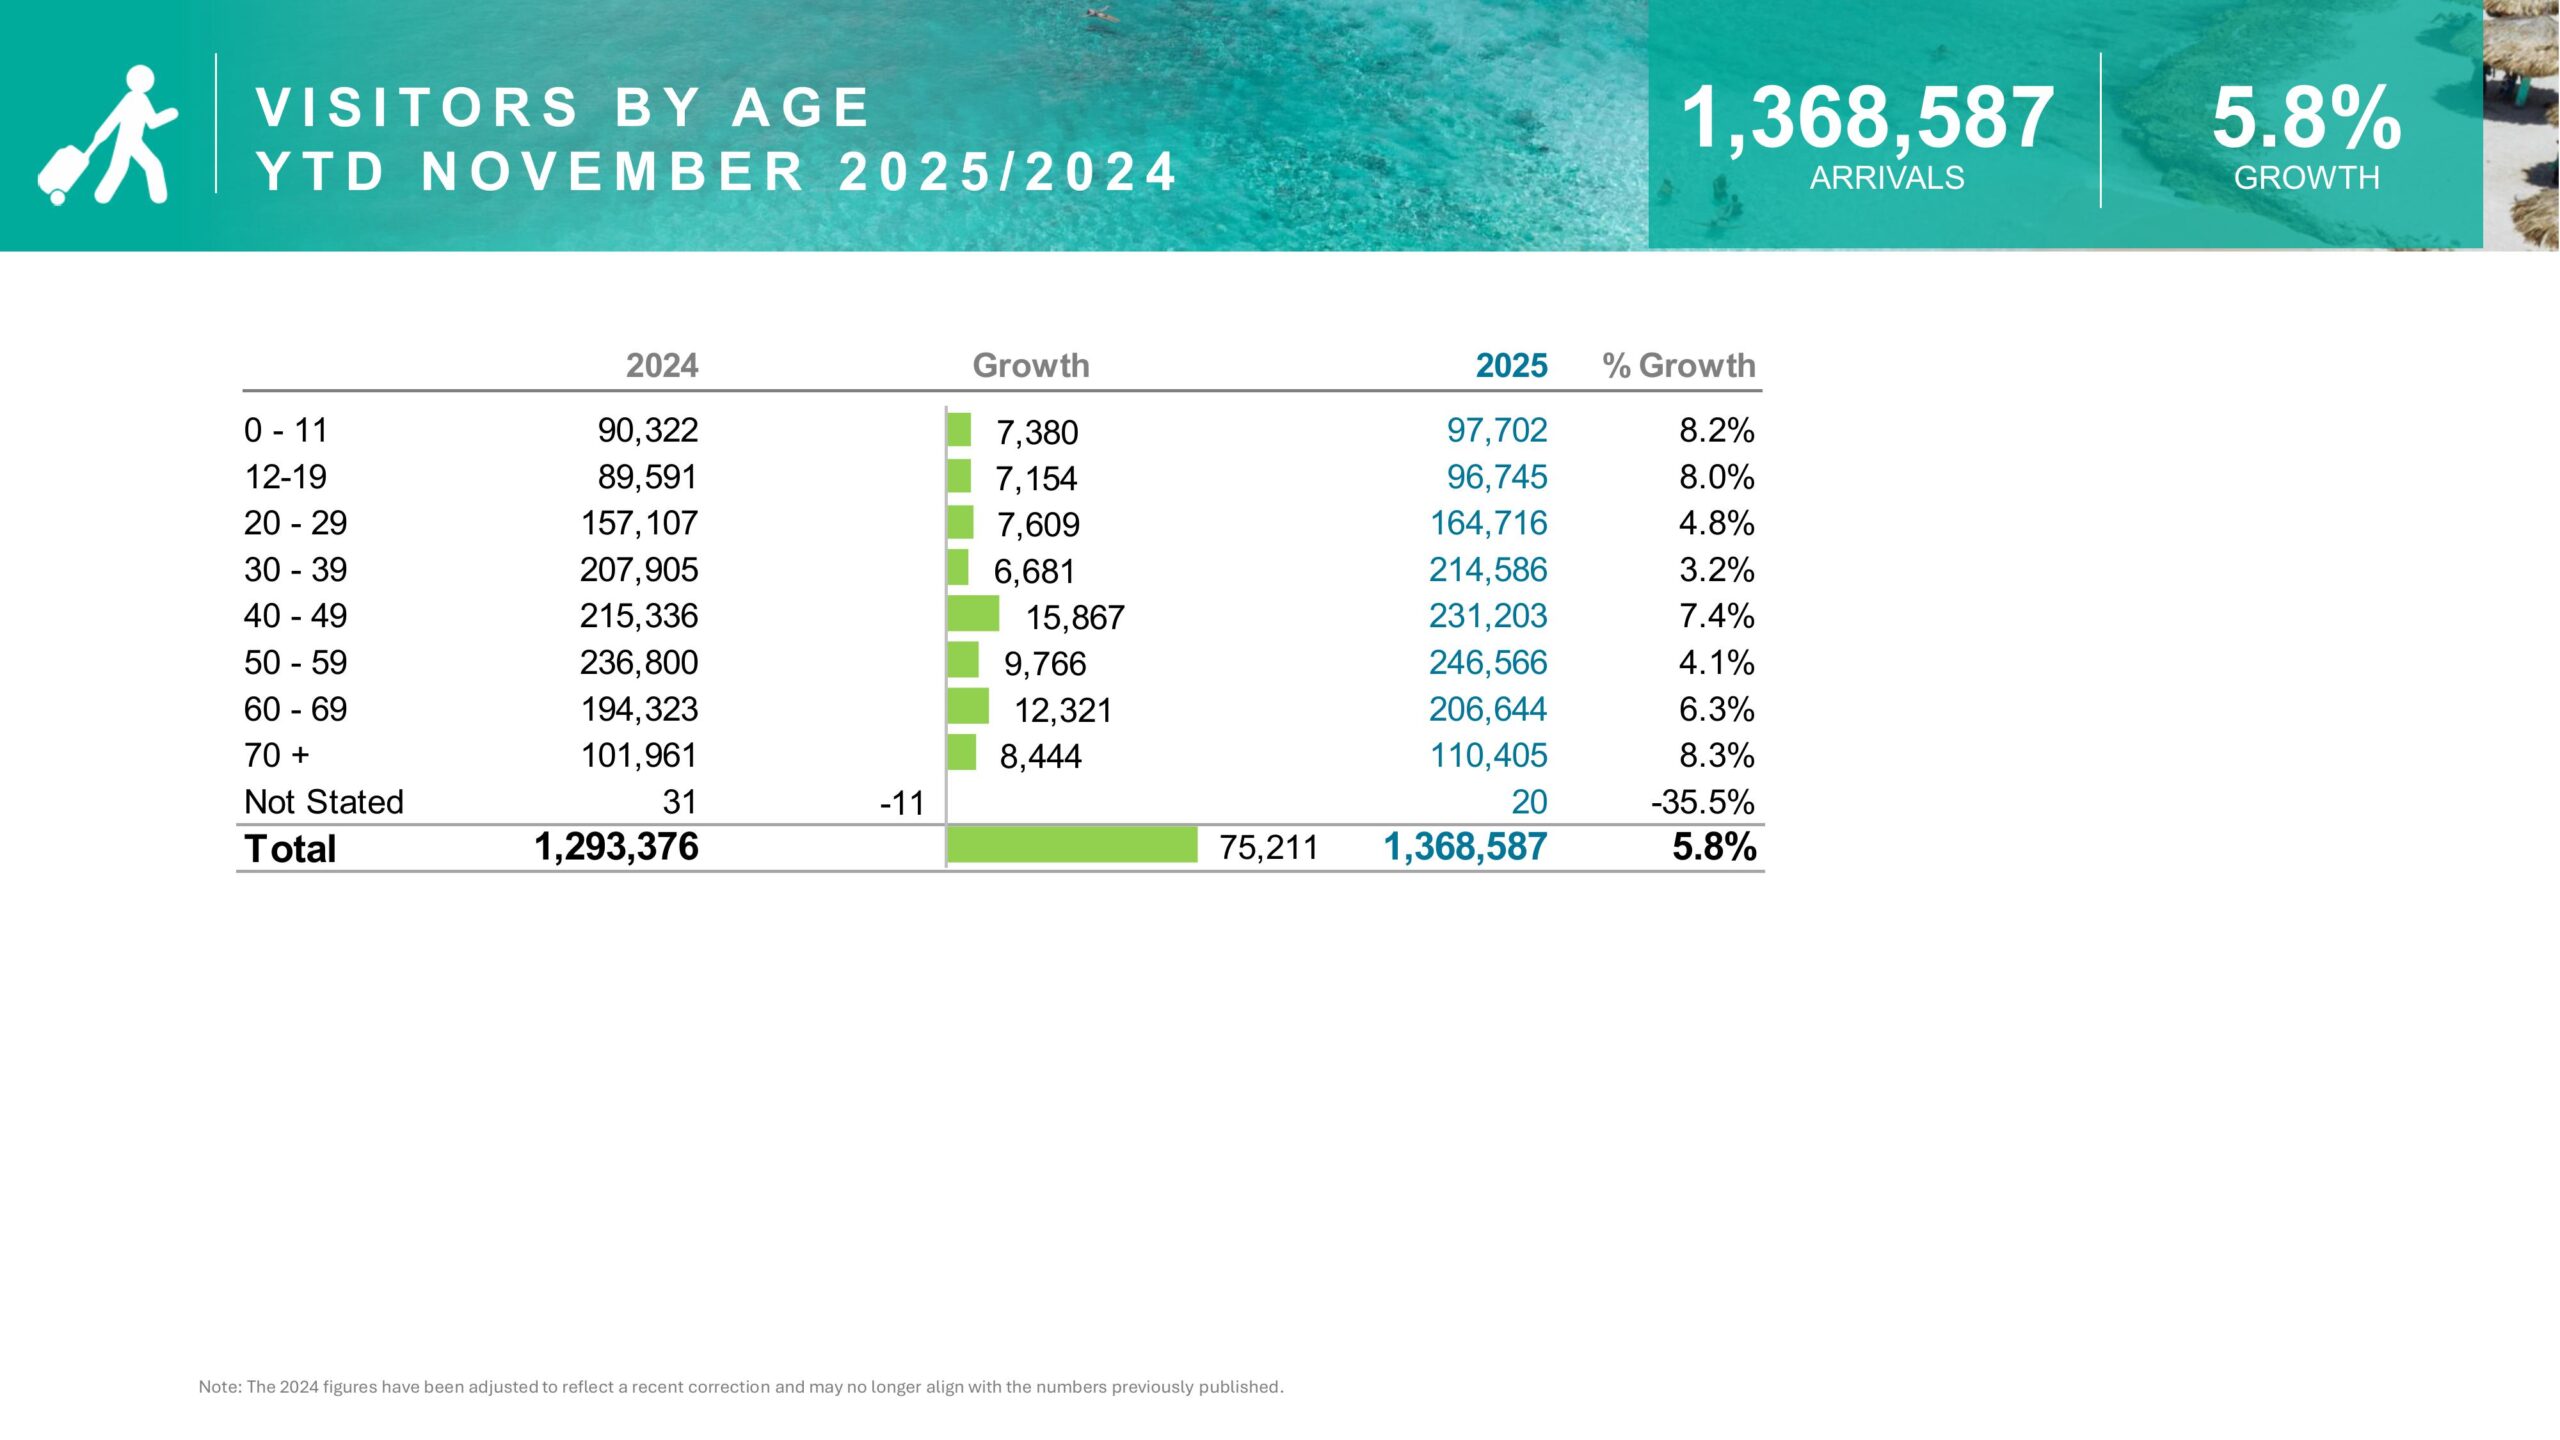
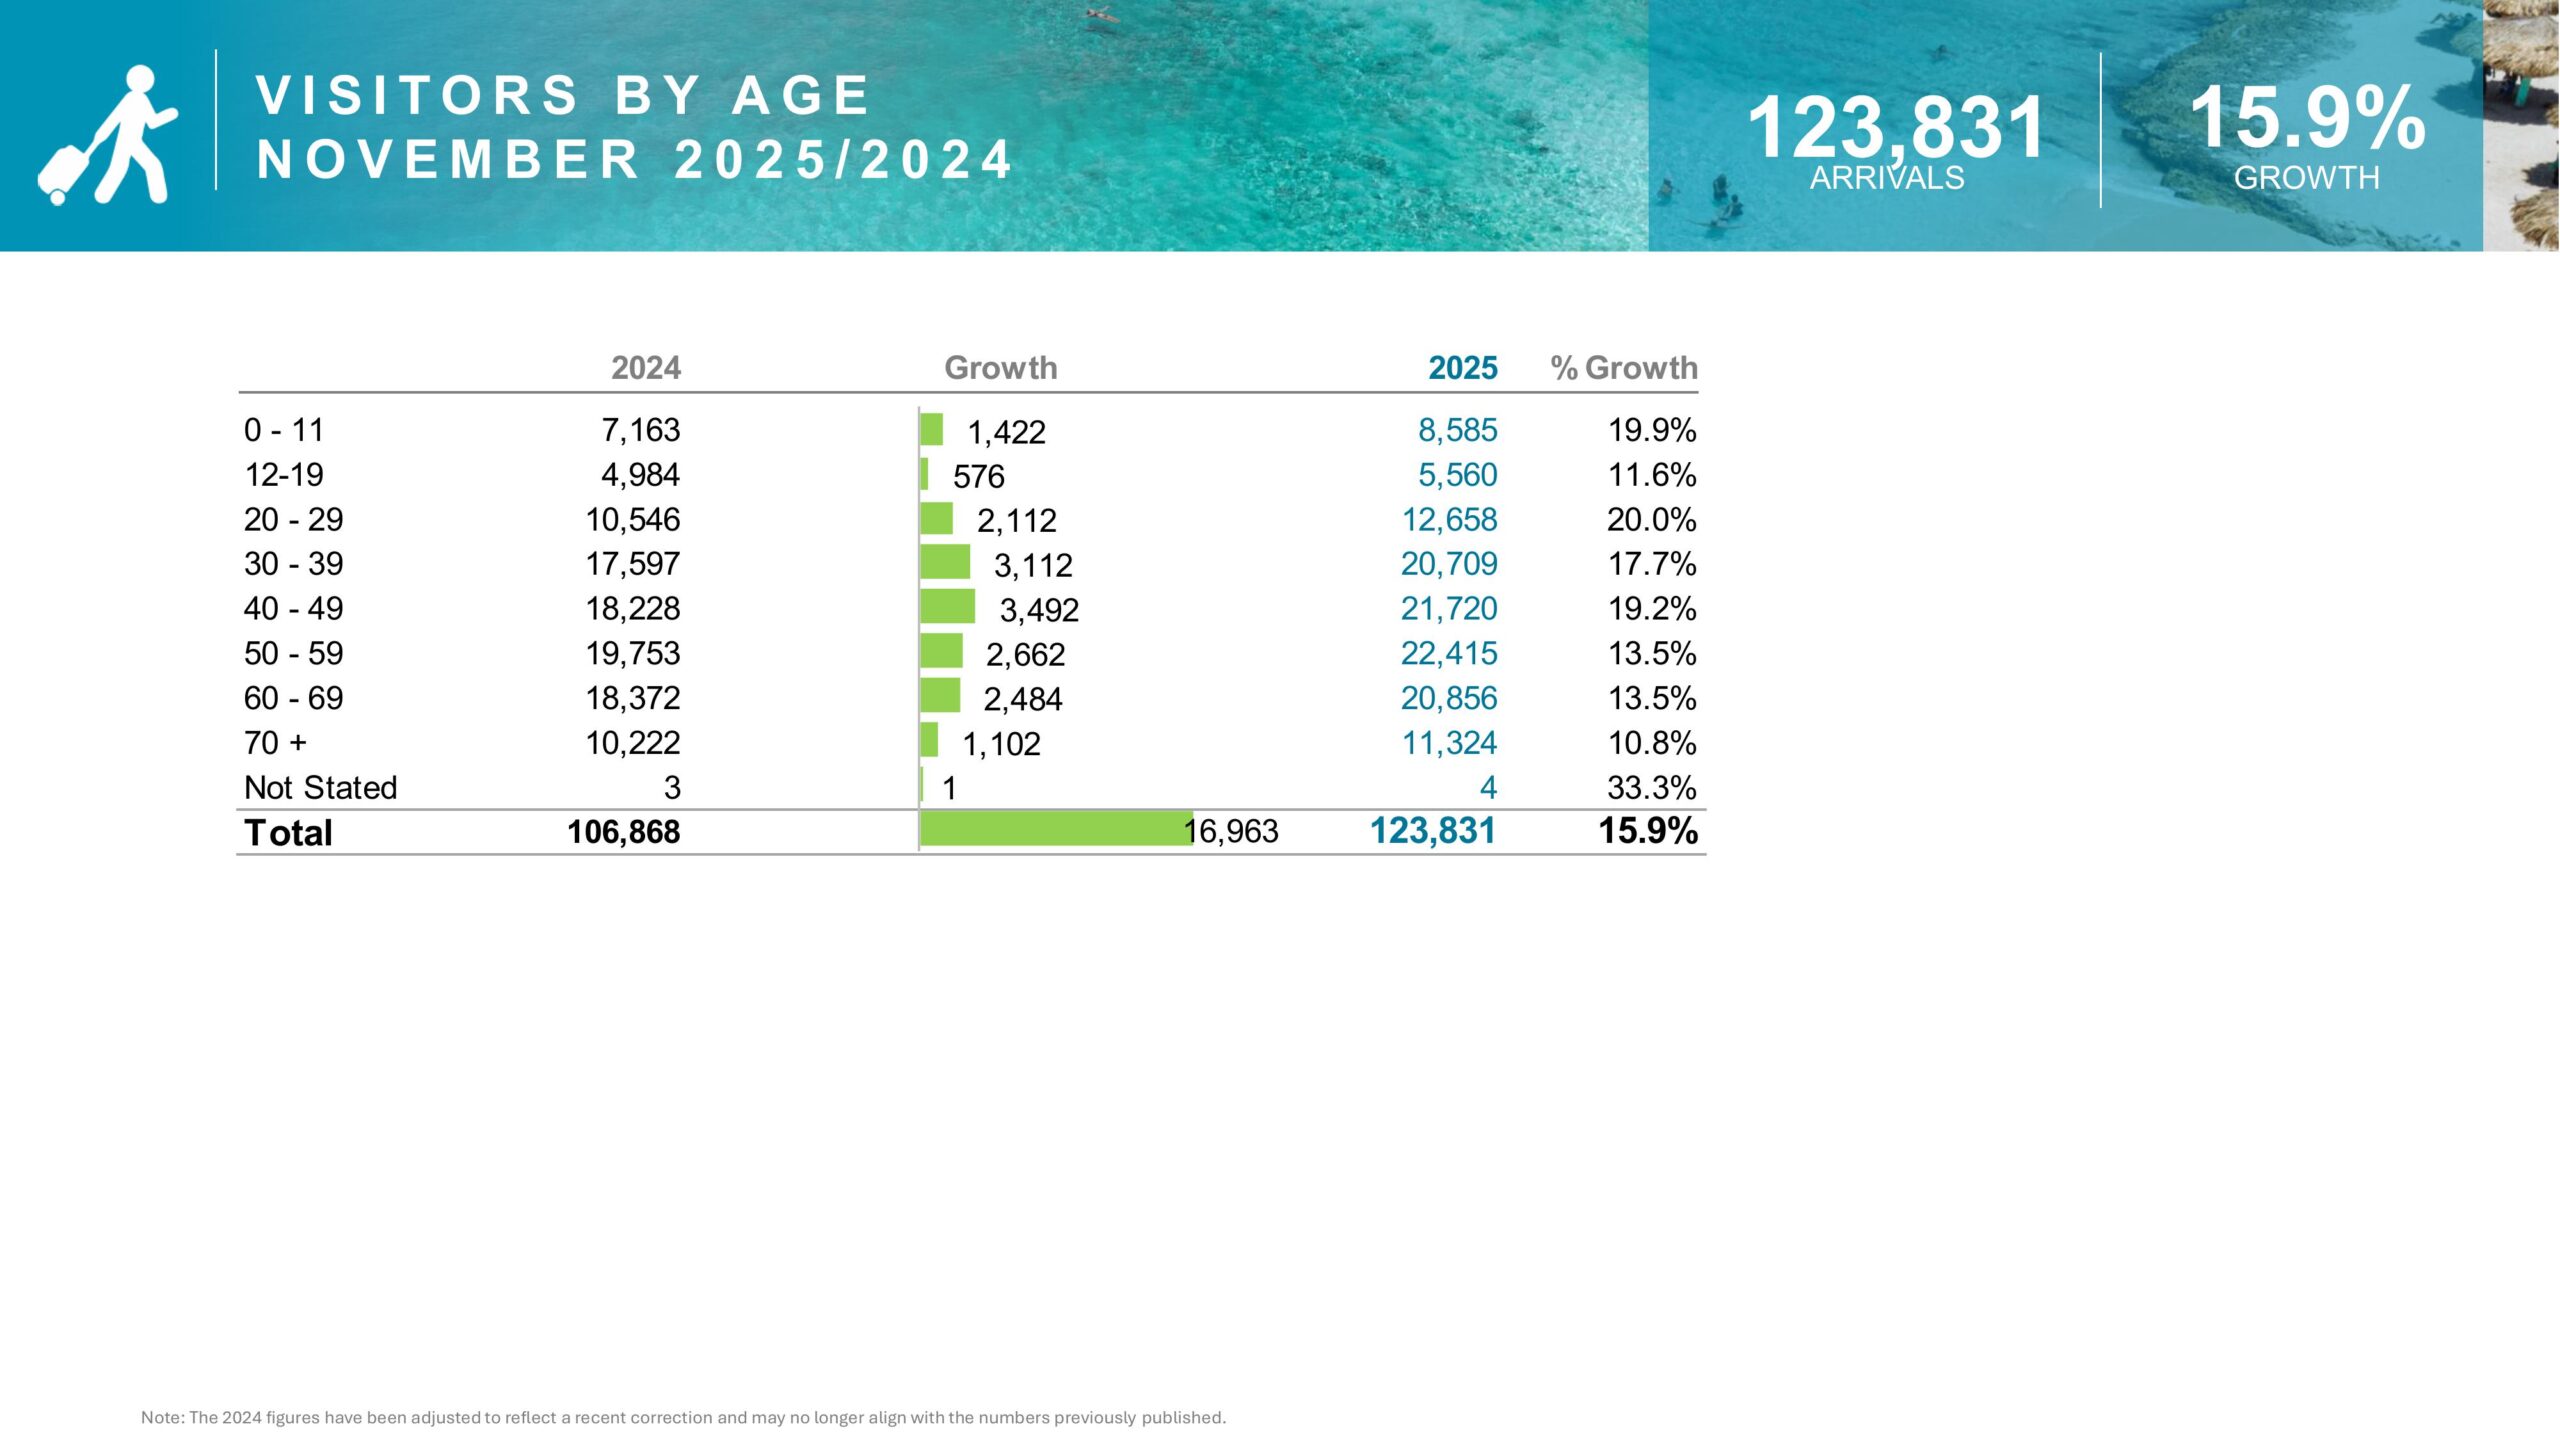
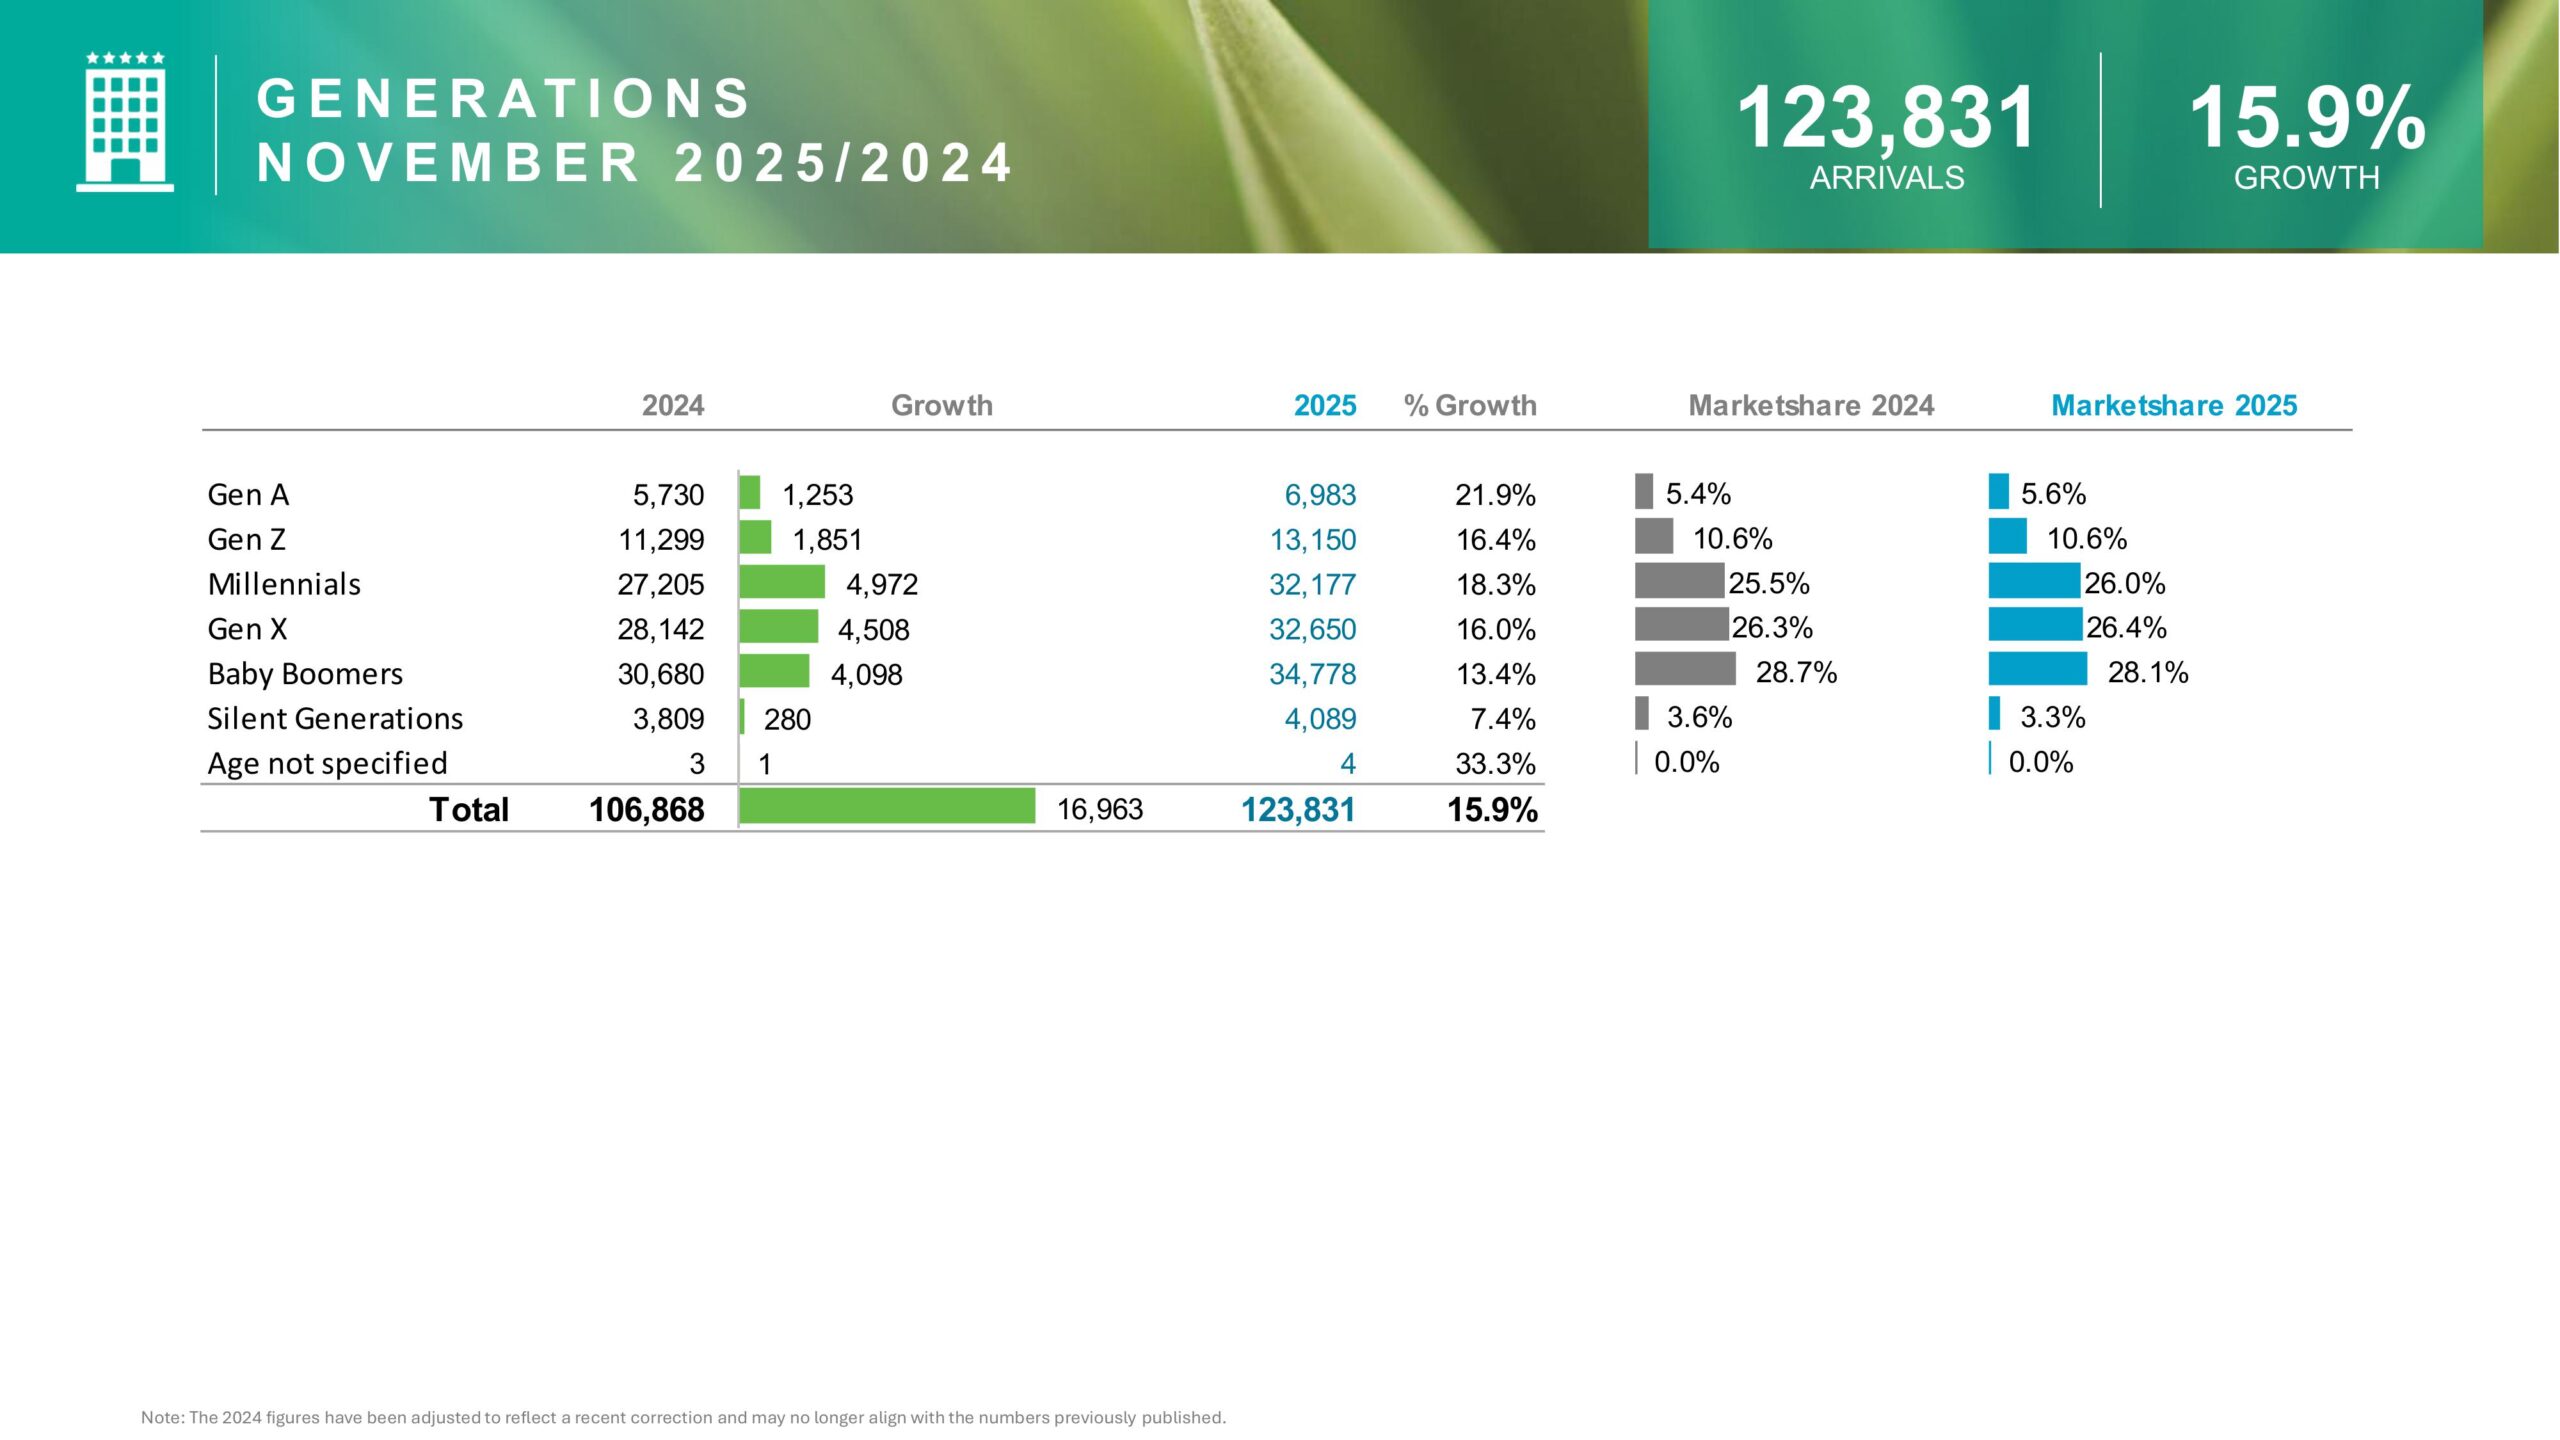
Visitor Demographics and Travel Behavior
Age Group Trends
Growth occurred across nearly all age segments:
- Children (0–11): +8.2%
- Millennials: +3.5%
- Baby Boomers: +6.0%
- Seniors (70+): +8.3%
This balanced growth highlights Aruba’s broad appeal across generations.
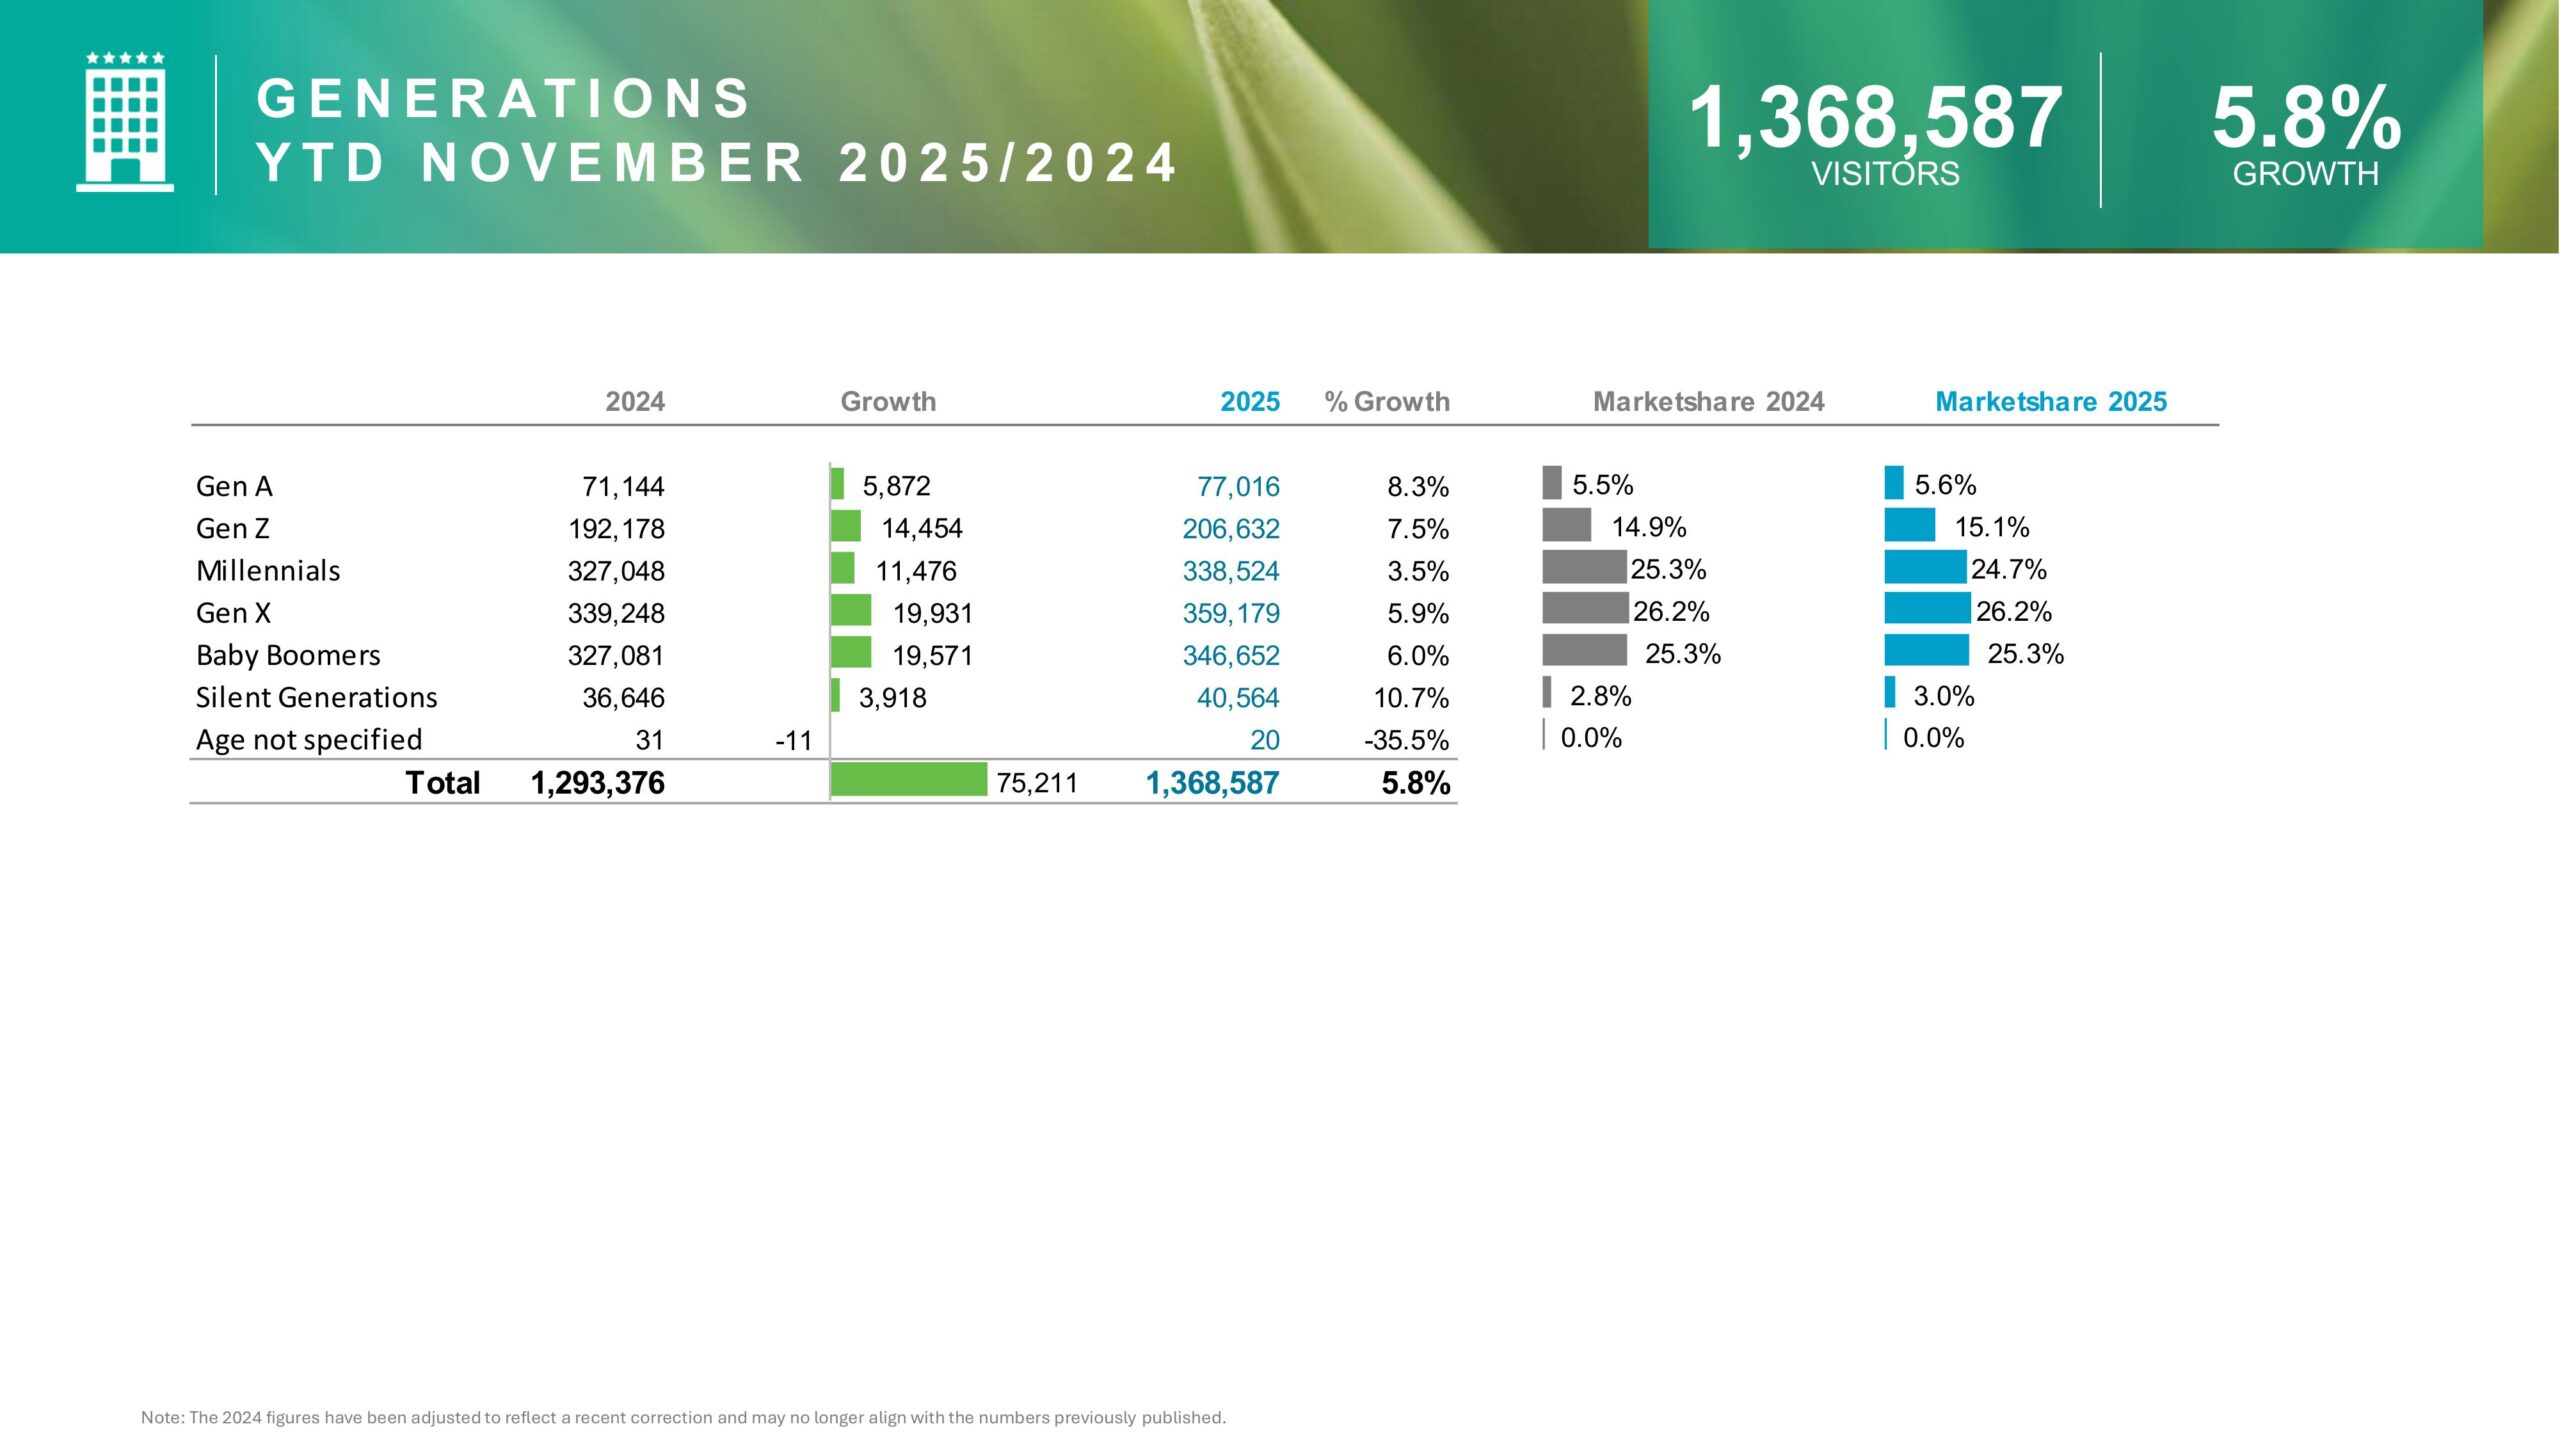
Generational Insights
Millennials and Gen X travelers together accounted for more than 50% of arrivals, reinforcing Aruba’s positioning as both a family and lifestyle destination.
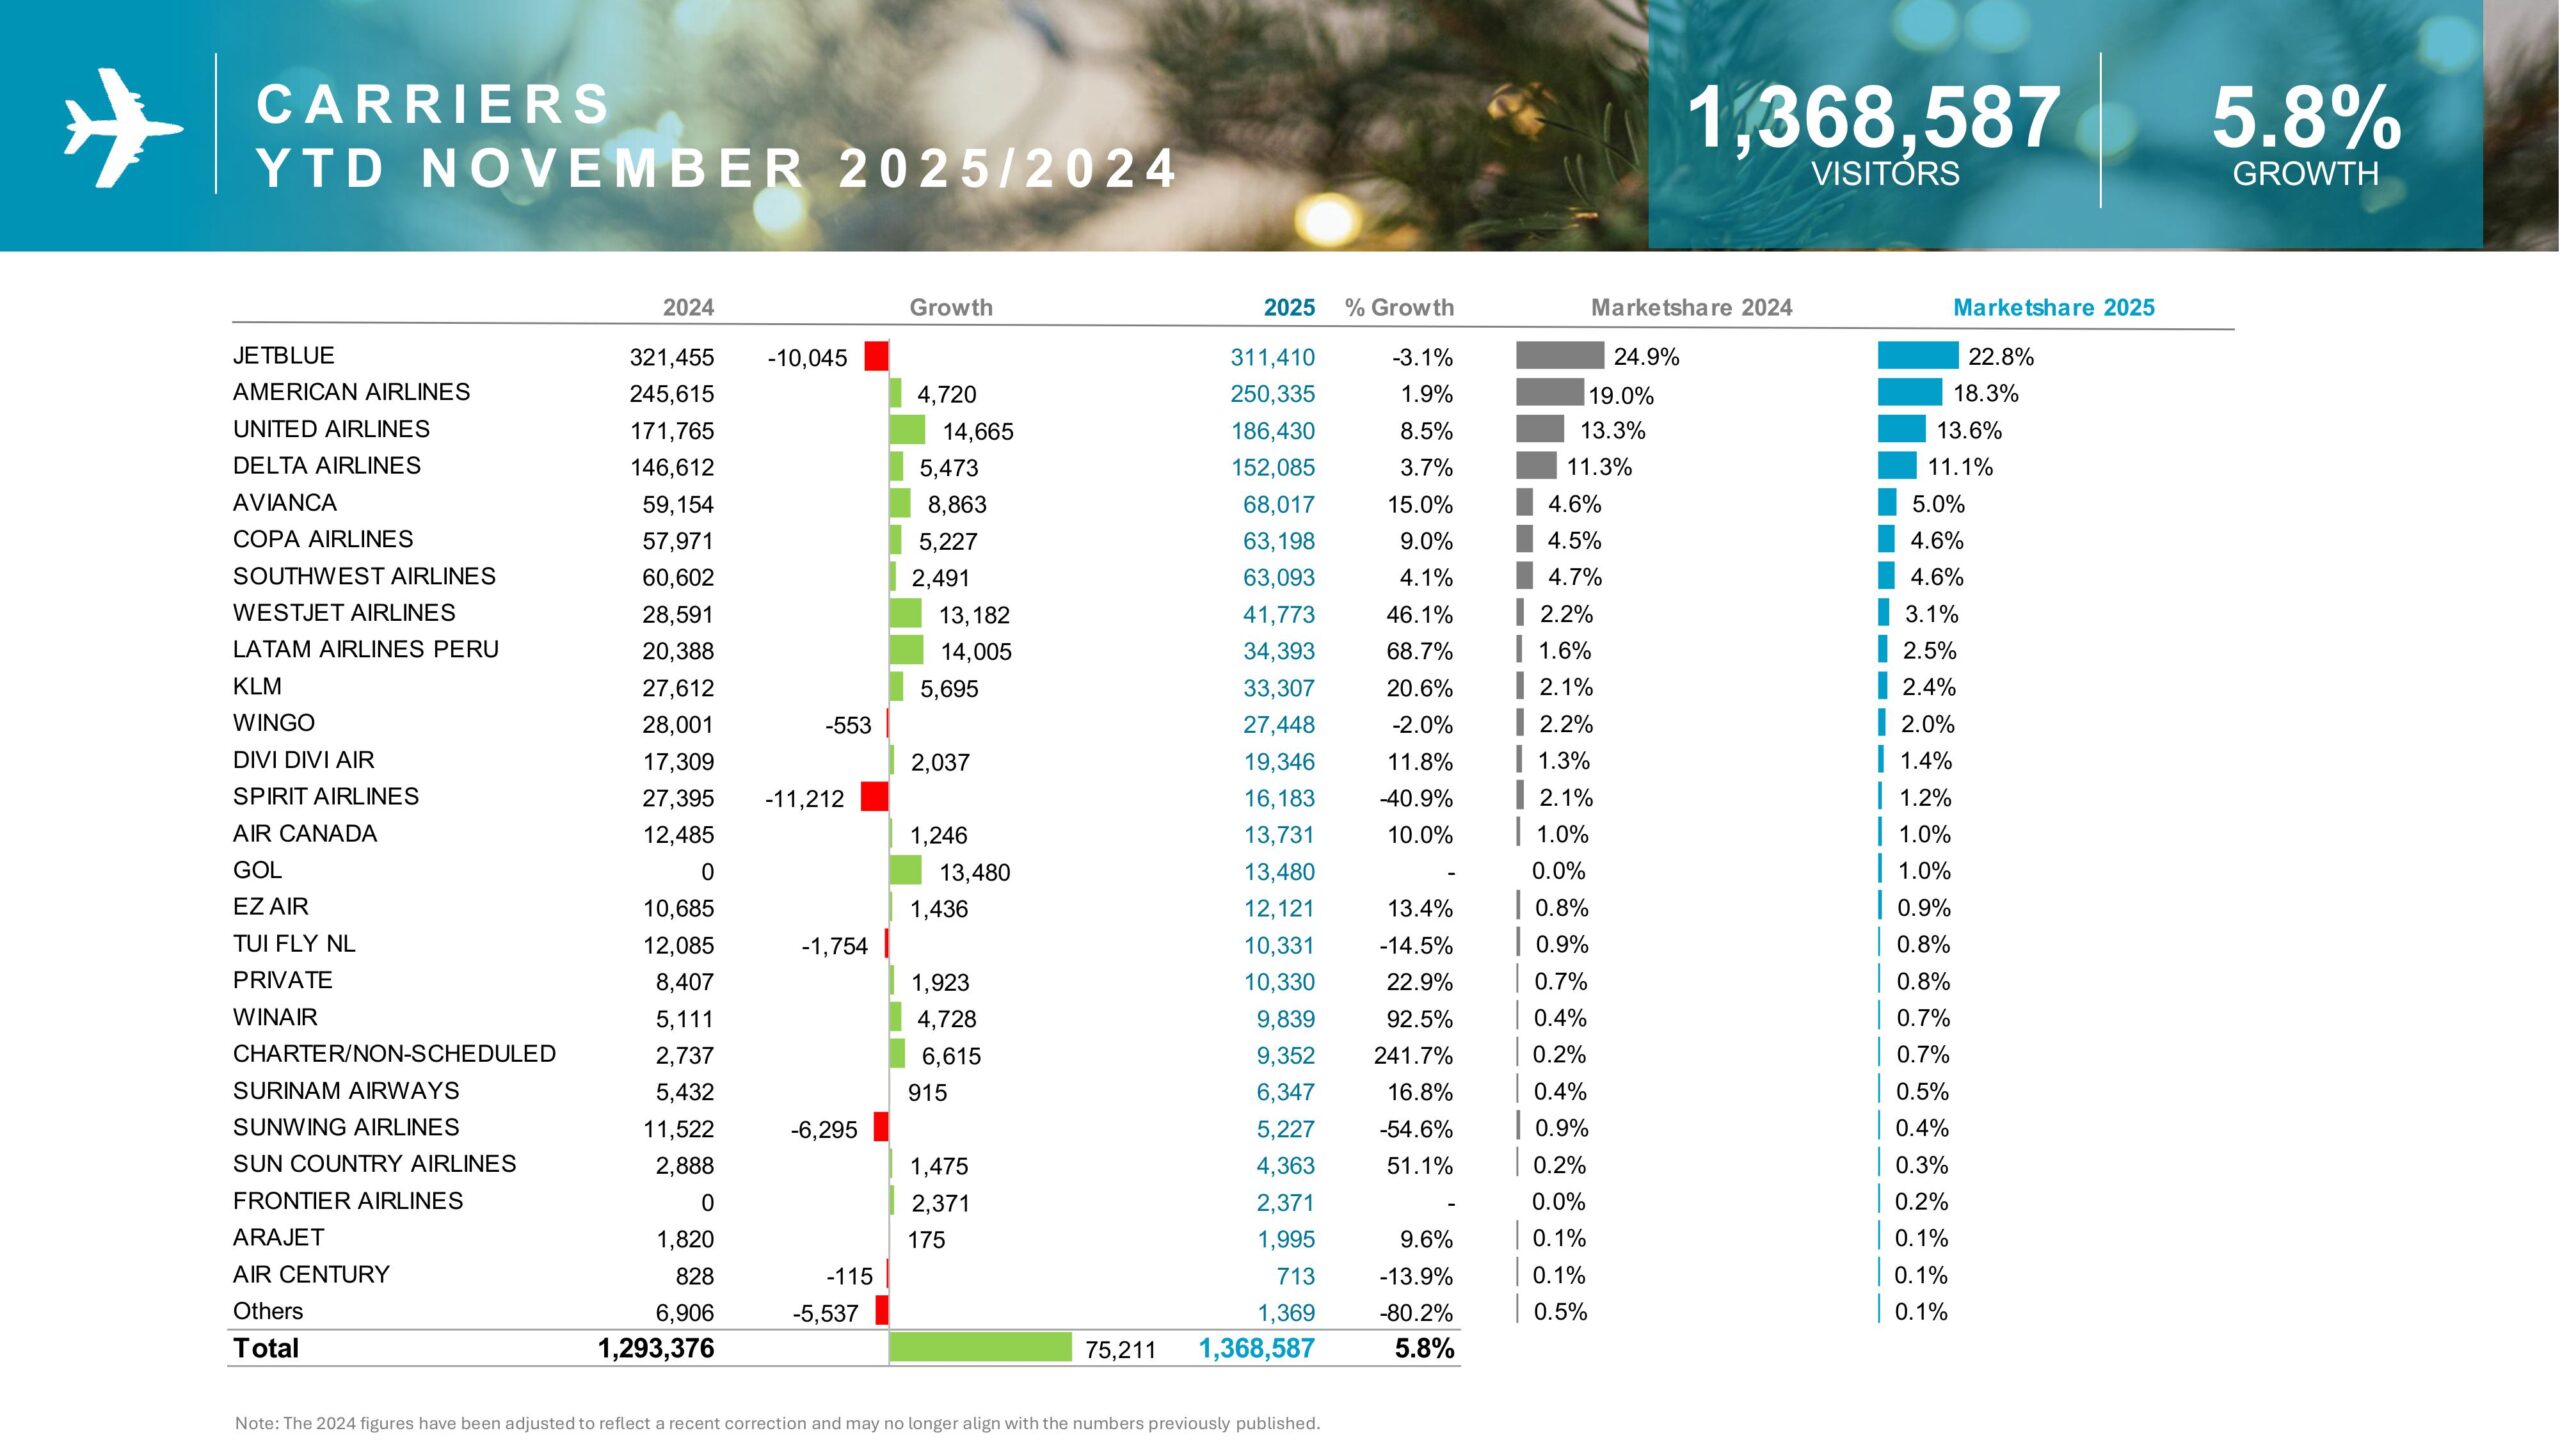
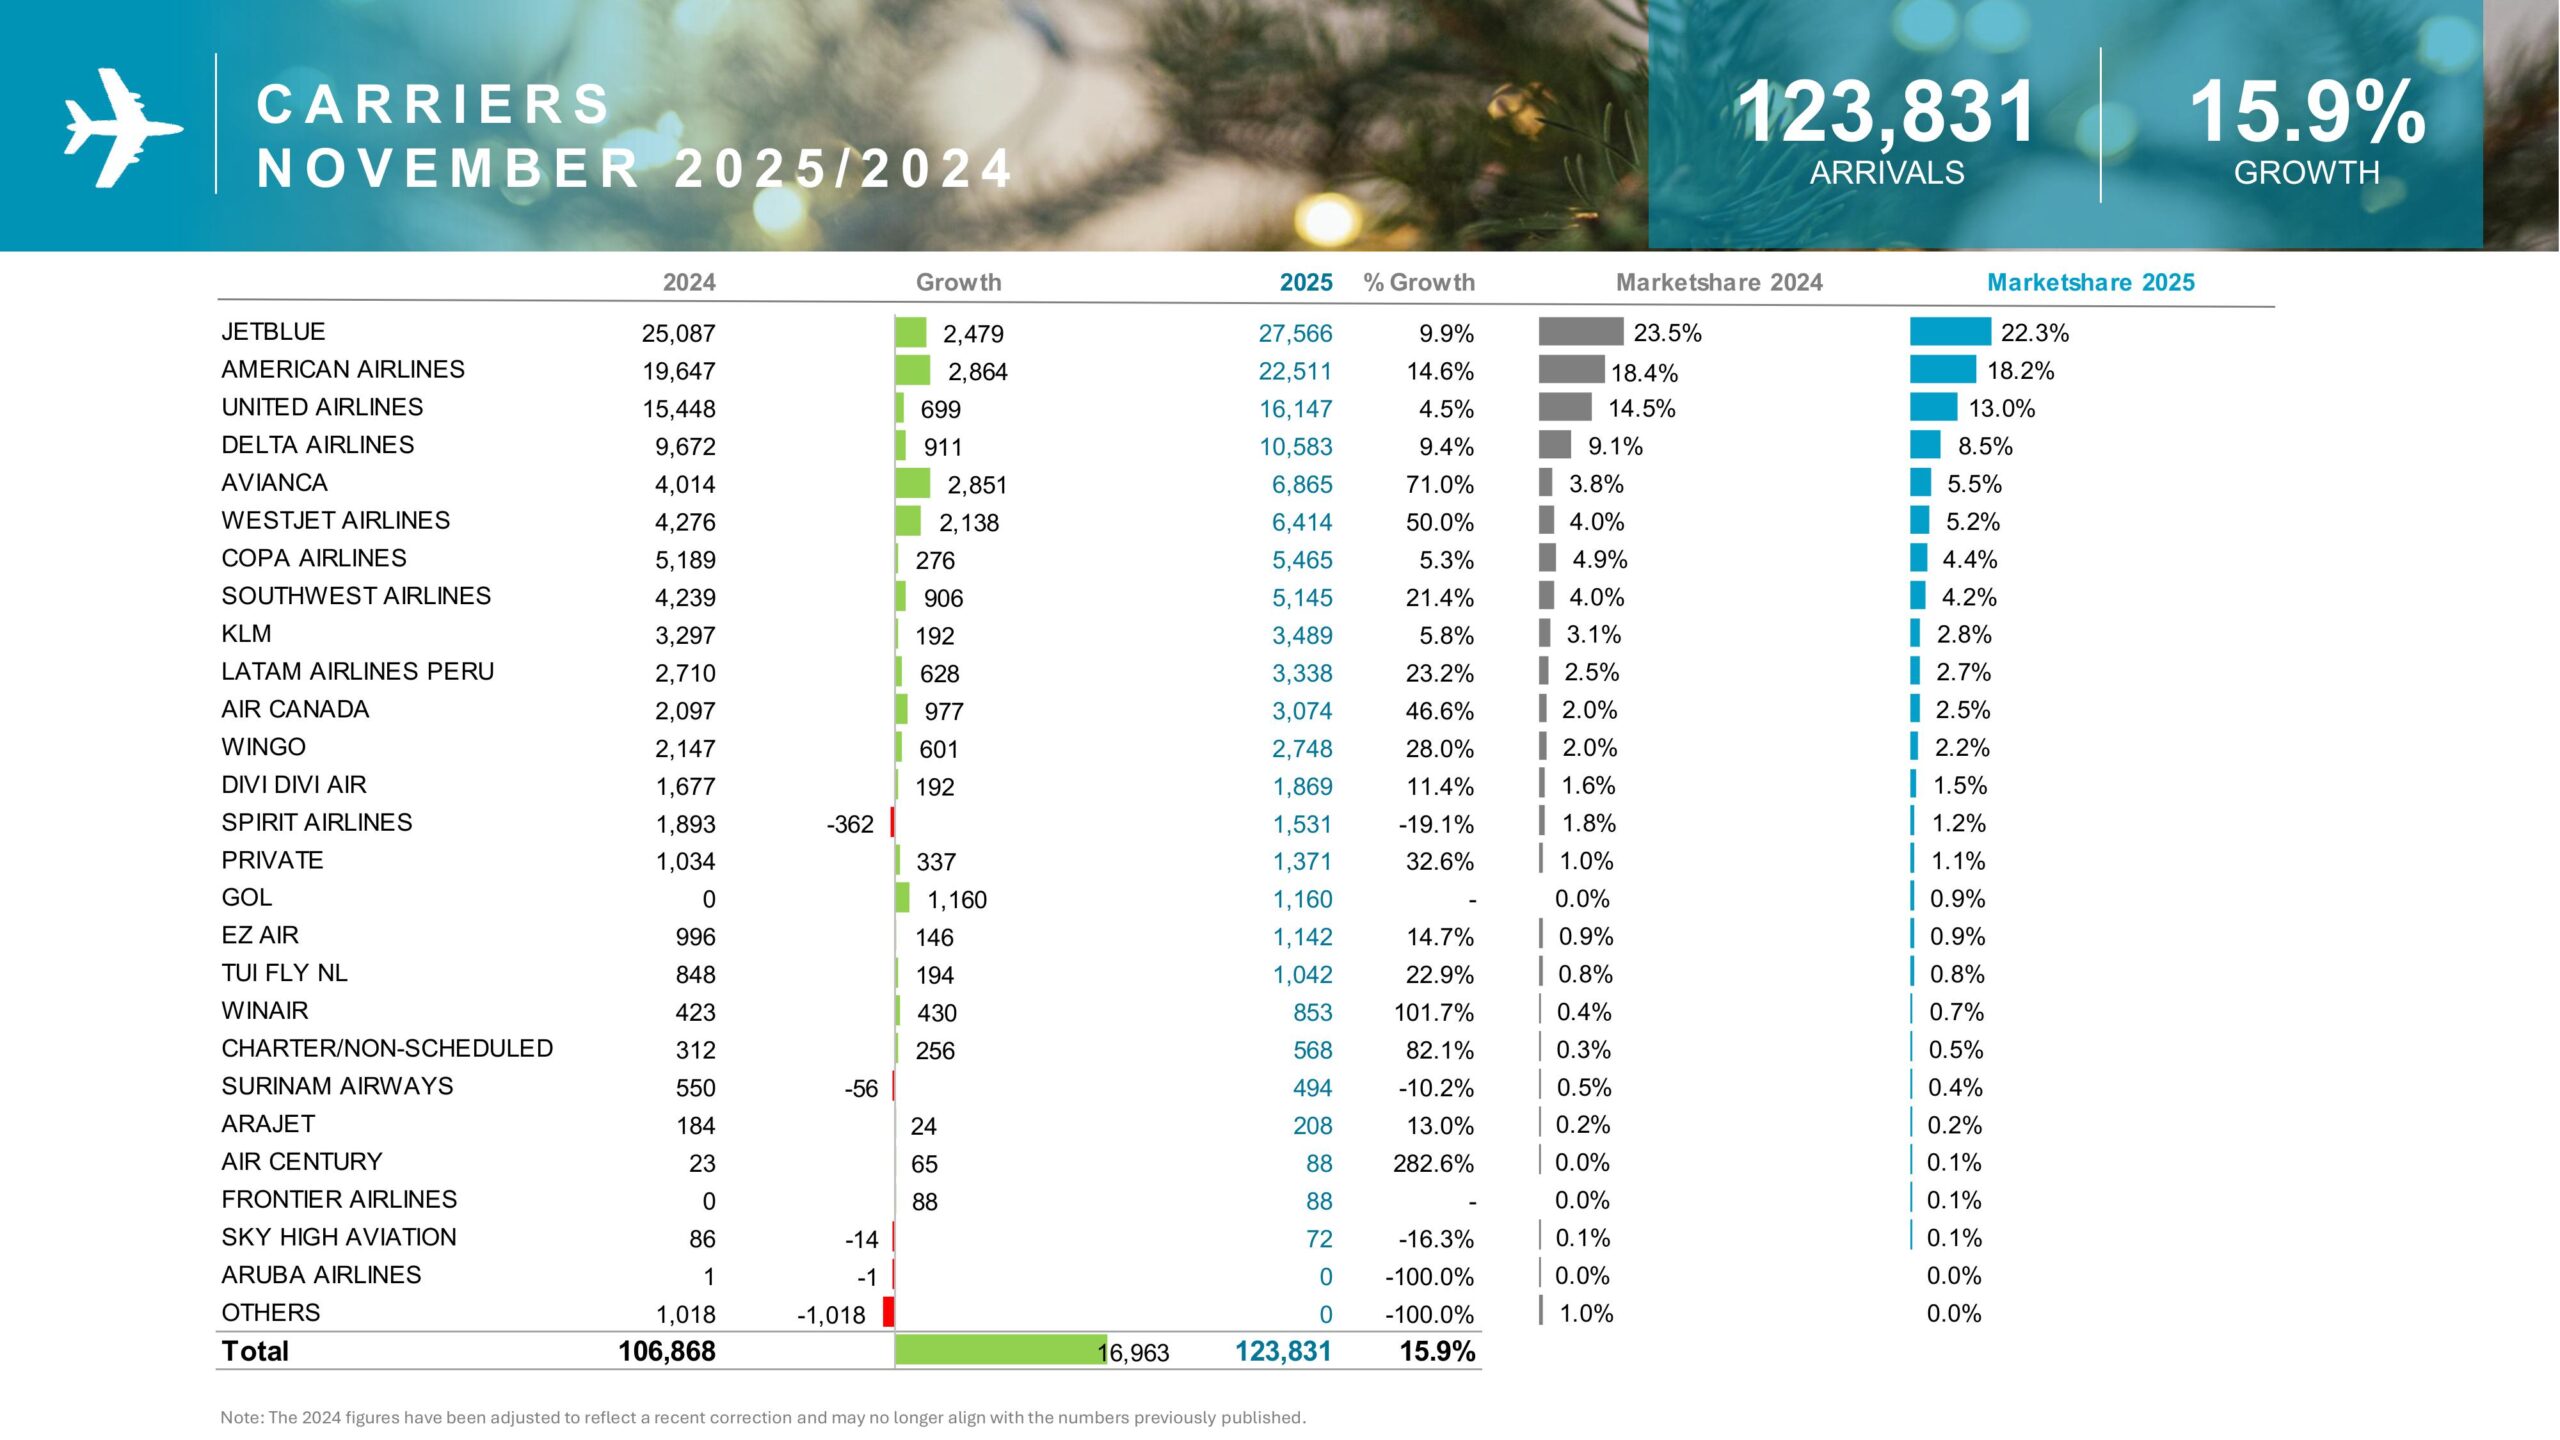
Airline Connectivity Strengthening Tourism Growth
Improved airlift played a critical role in Aruba tourism performance 2025. Airlines such as JetBlue, American Airlines, United Airlines, and Delta maintained strong capacity, while carriers like Avianca, Copa, and LATAM expanded South American connectivity.
Increased seat availability directly supported higher arrival numbers and sustained growth.
Economic Impact and Tourism Confidence
Visa spending data, accommodation growth, and rising arrivals collectively demonstrate strong tourism confidence. Furthermore, tourism credits reported by the Central Bank of Aruba highlight the sector’s positive contribution to national economic performance.
Outlook for Aruba Tourism Performance 2025
Looking ahead, Aruba tourism performance 2025 remains optimistic. Continued diversification, targeted marketing, and sustained air connectivity will likely support stable growth through the end of the year.
Moreover, rising South American demand, consistent North American arrivals, and improving European performance position Aruba favorably for 2026.
Conclusion
Aruba tourism performance 2025 reflects a resilient, diversified, and growing tourism economy. Strong Visa card spending, increased arrivals, and expanding market reach underscore Aruba’s continued success as a premier Caribbean destination. As global travel demand stabilizes, Aruba remains well-positioned for sustainable tourism growth.
For more local news, visit us and follow our social media pages. Share your news with us by sending it to info@arubaonline.news.