The Current State of Aruba’s Tourism Sector
Aruba actively drives a high-value, low-impact tourism model. Consequently, this focus ensures both economic prosperity and sustainable development. The Aruba Tourism Statistics 2025 reveal compelling shifts. The industry continues showing remarkable resilience and dynamic change. This detailed analysis summarizes the Aruba Tourism Authority (ATA) September 2025 report. We examine key metrics including visitor arrivals, accommodation performance, and economic impact. Ultimately, this data provides crucial insights for investors and industry stakeholders.
Analyzing Aruba’s Tourism Growth 2025: Value Over Volume
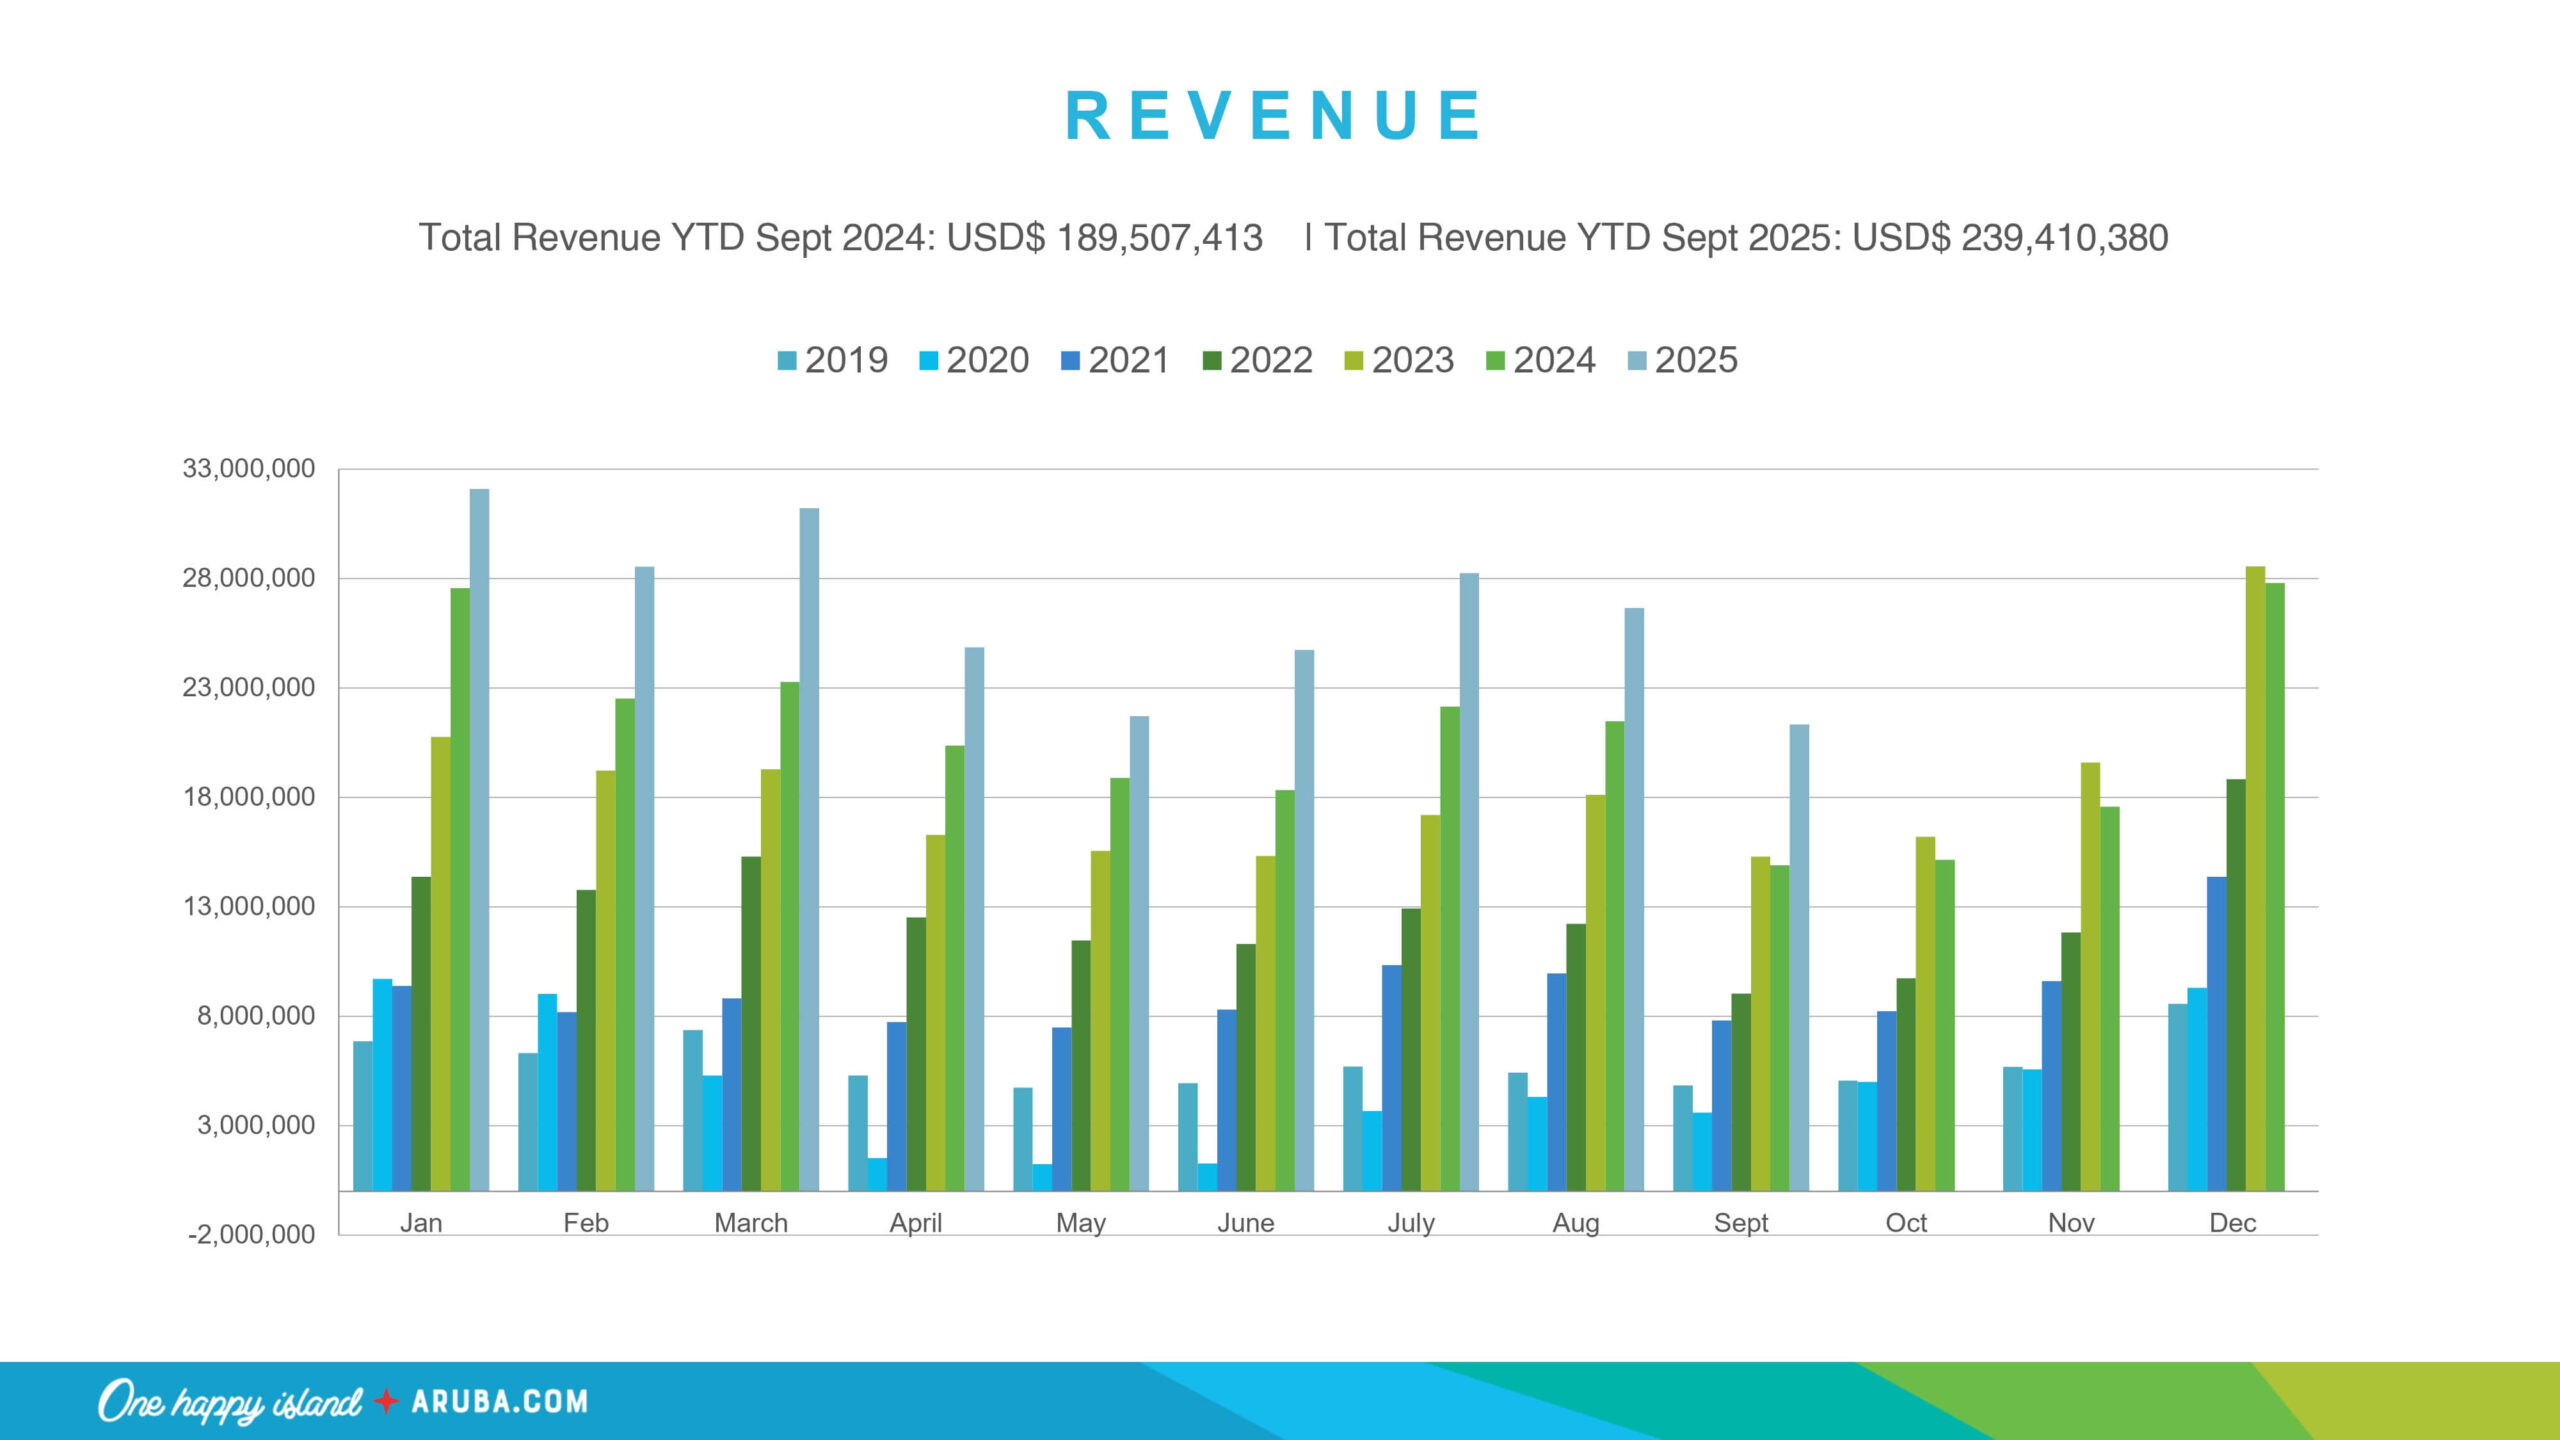
The island’s strategy prioritizes spending over sheer volume. The core goal is generating more revenue per visitor. Specifically, Q1 2025 showed identical growth in two key areas. Tourism Credits increased by 2.5% compared to 2024. Simultaneously, tourist arrivals also grew by a 2.5% margin. This parity requires immediate review from industry leaders.
Value growth should actively surpass volume growth. Therefore, the current results signal a potential challenge. Policymakers must actively review the spending metric. They must ensure sustainable financial health. Indeed, value remains the true focus for long-term prosperity. This high-value approach secures the island’s future. It prevents strain on local resources and infrastructure.


Stay-Over Arrivals Soar: YTD September 2025 Performance
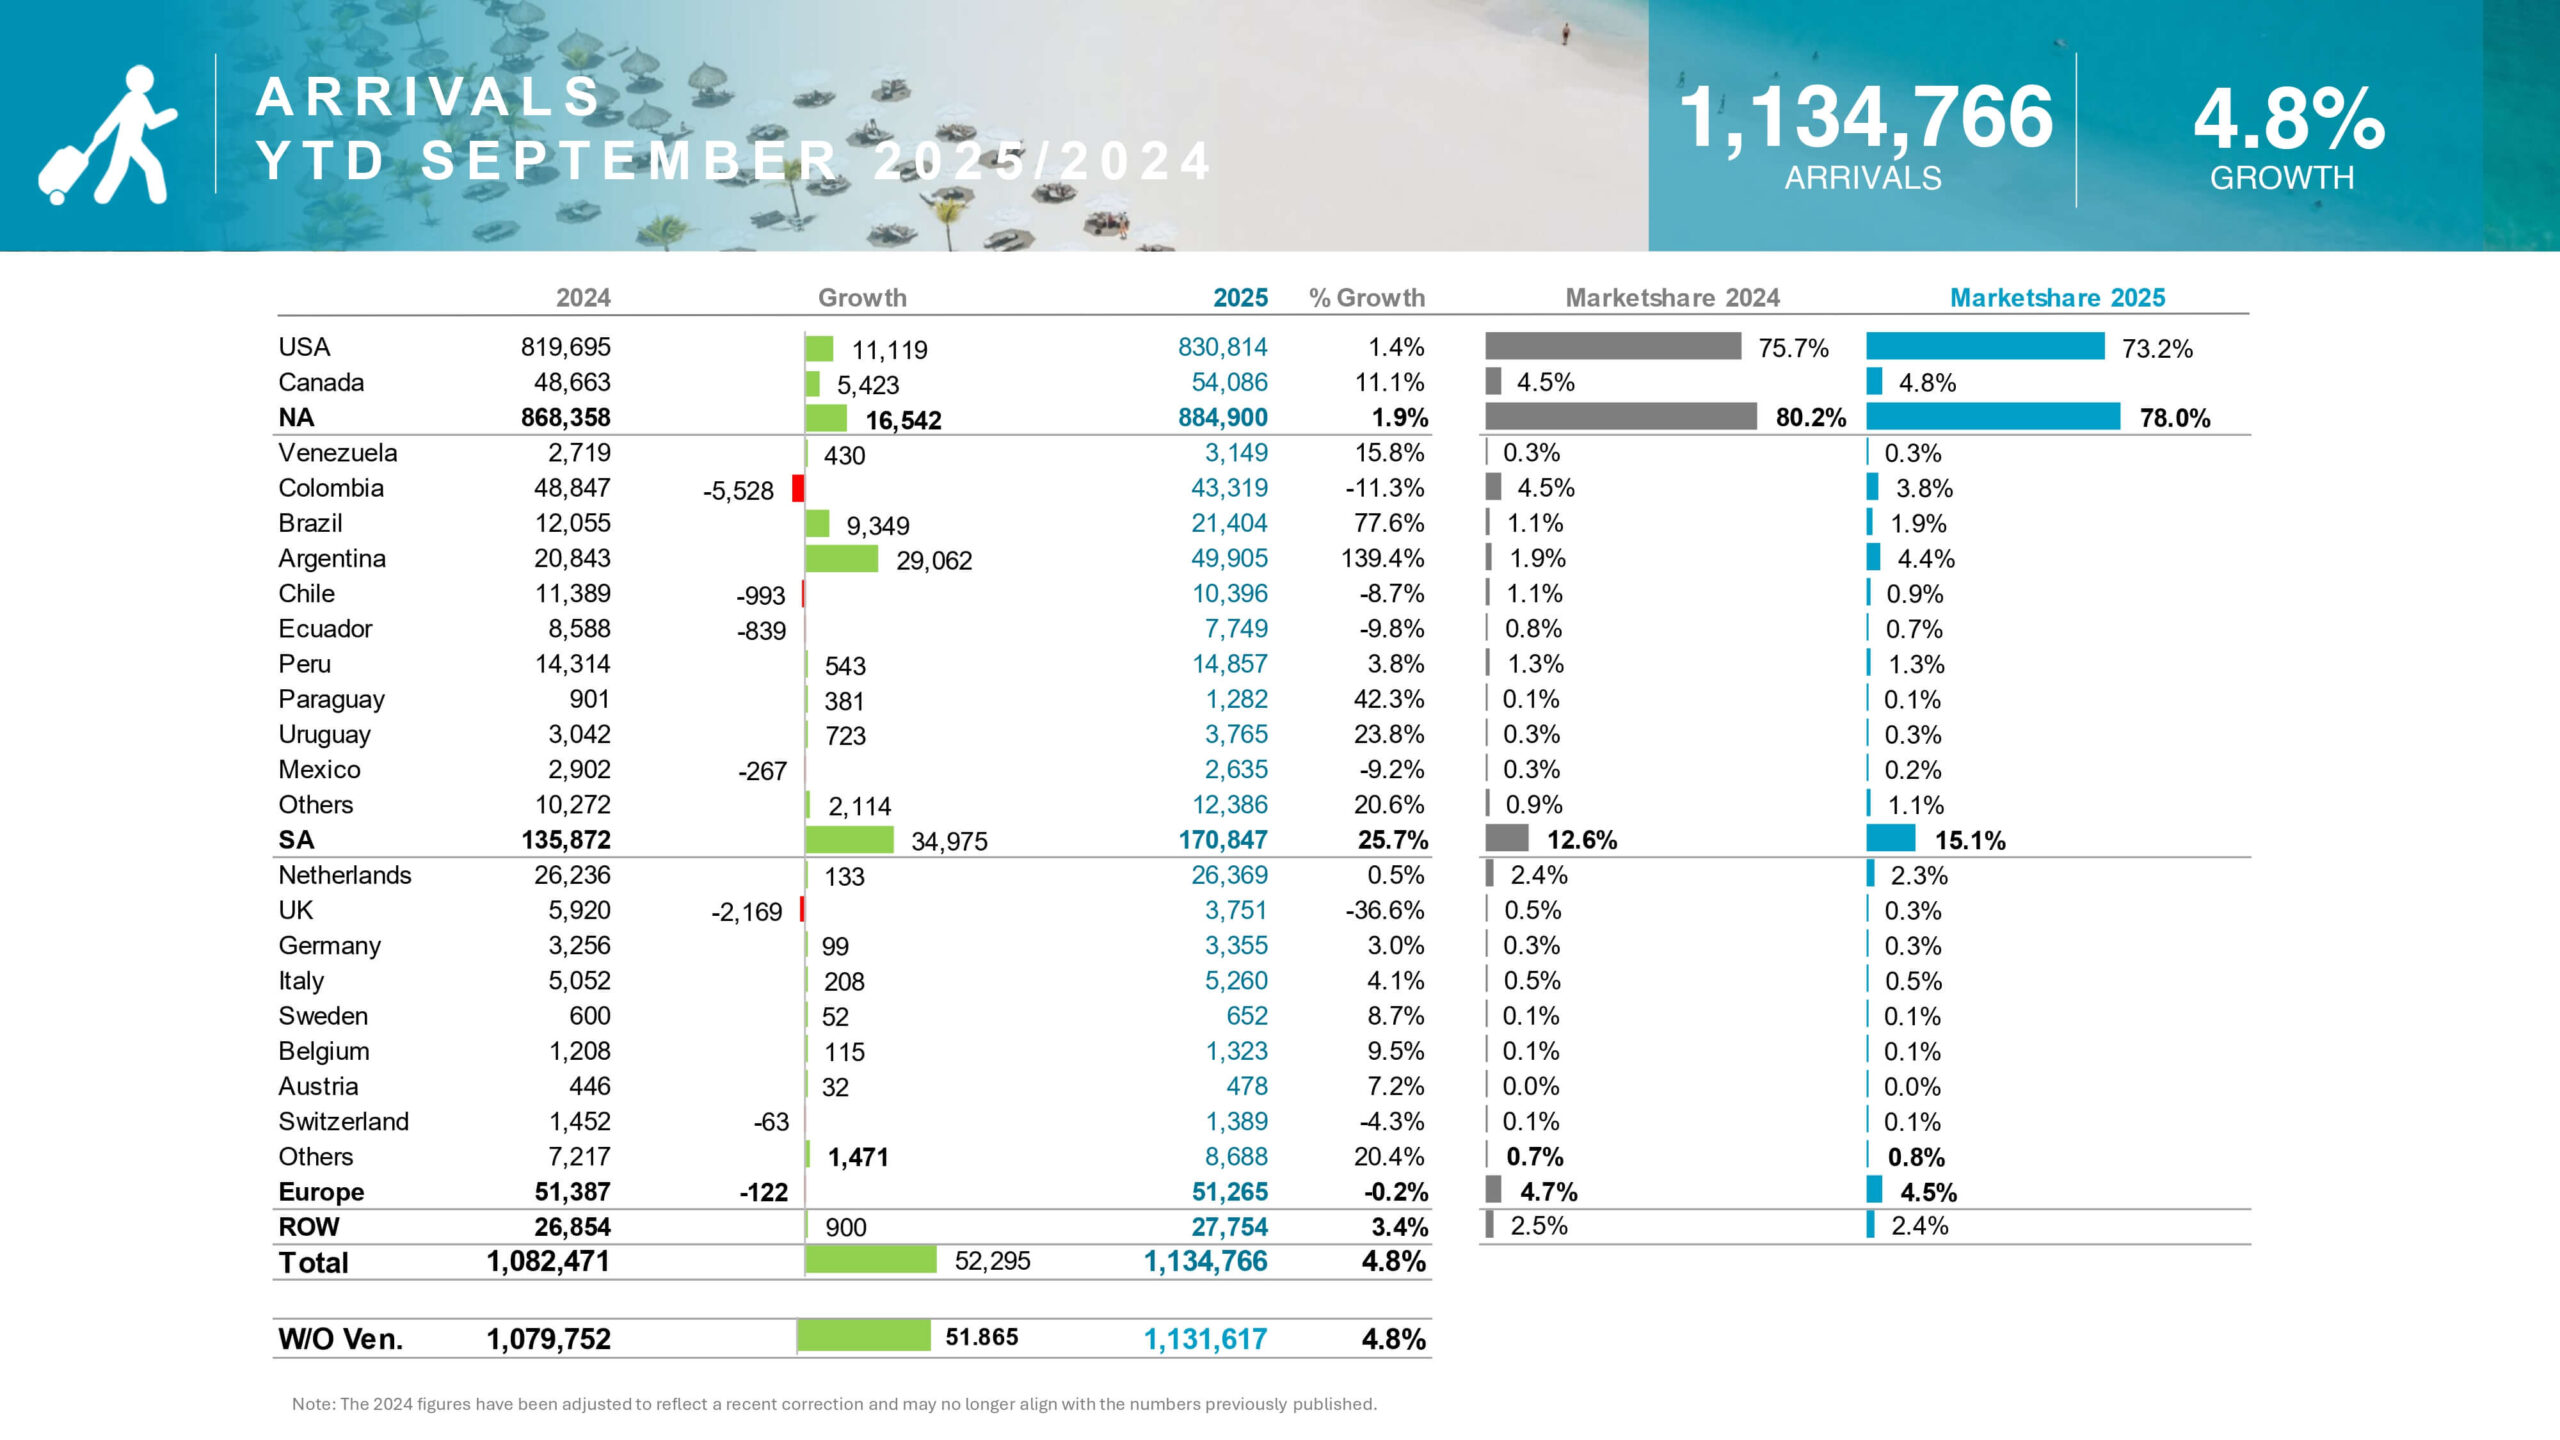
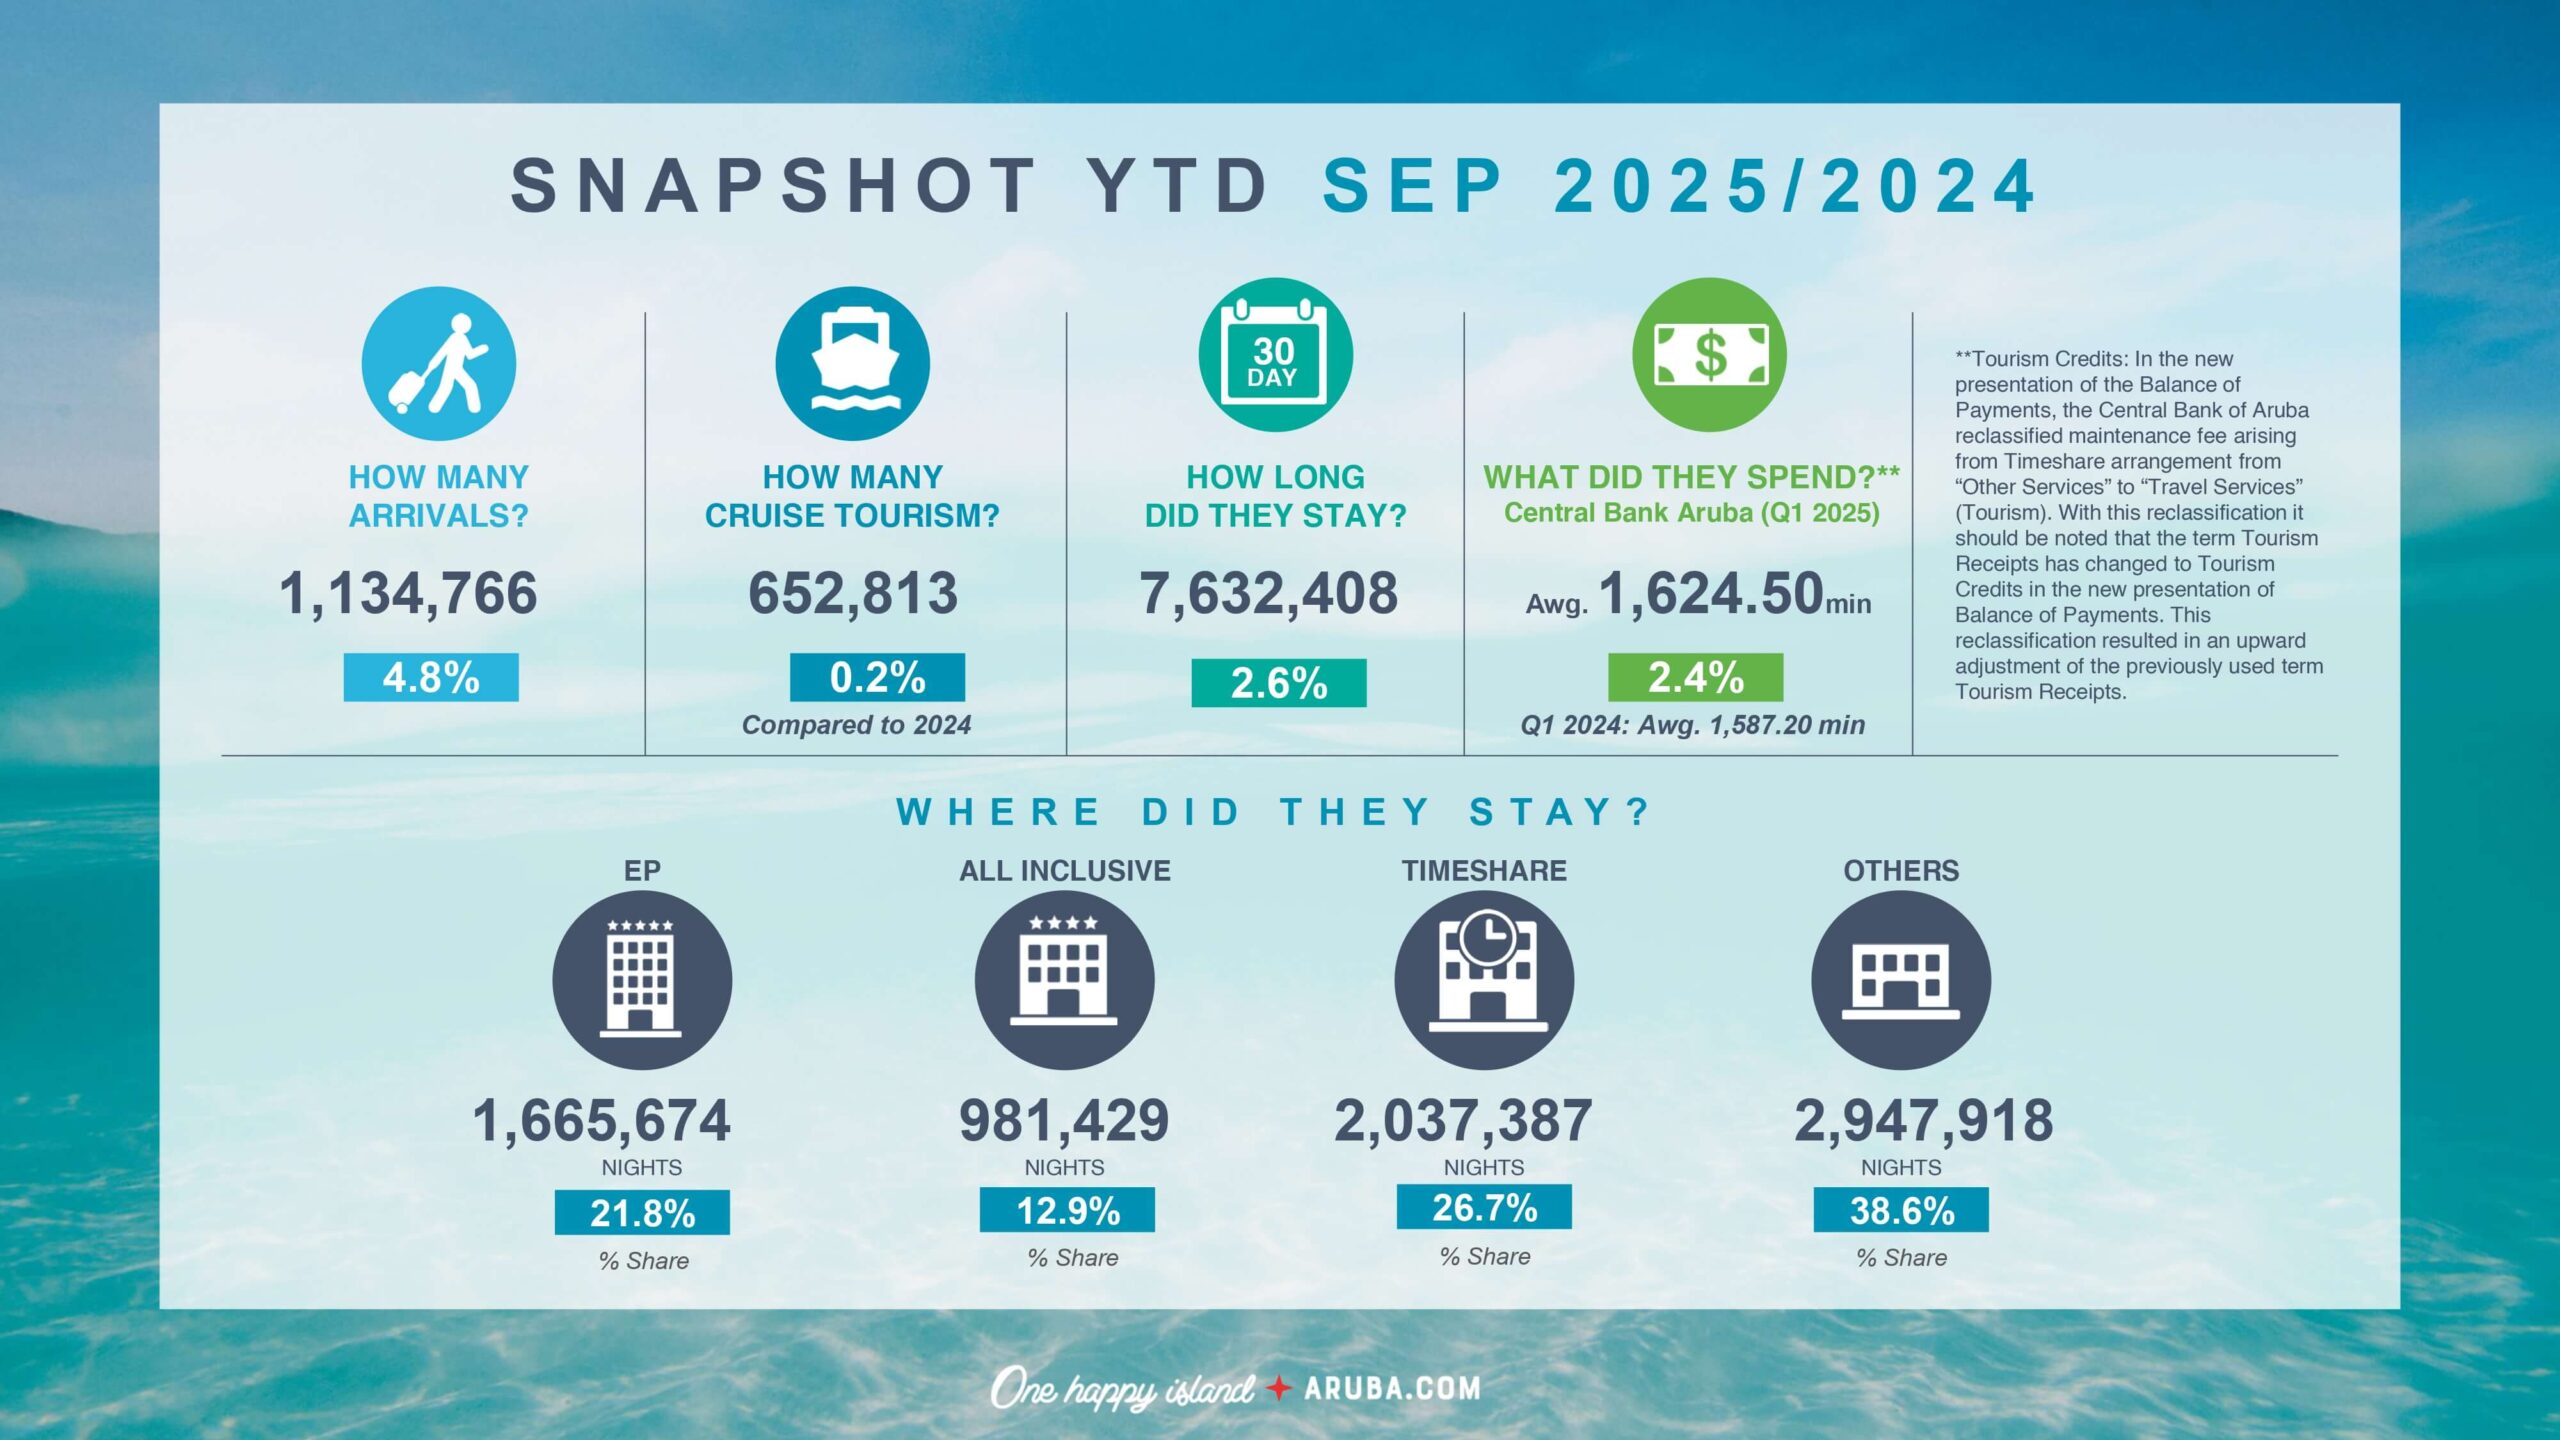
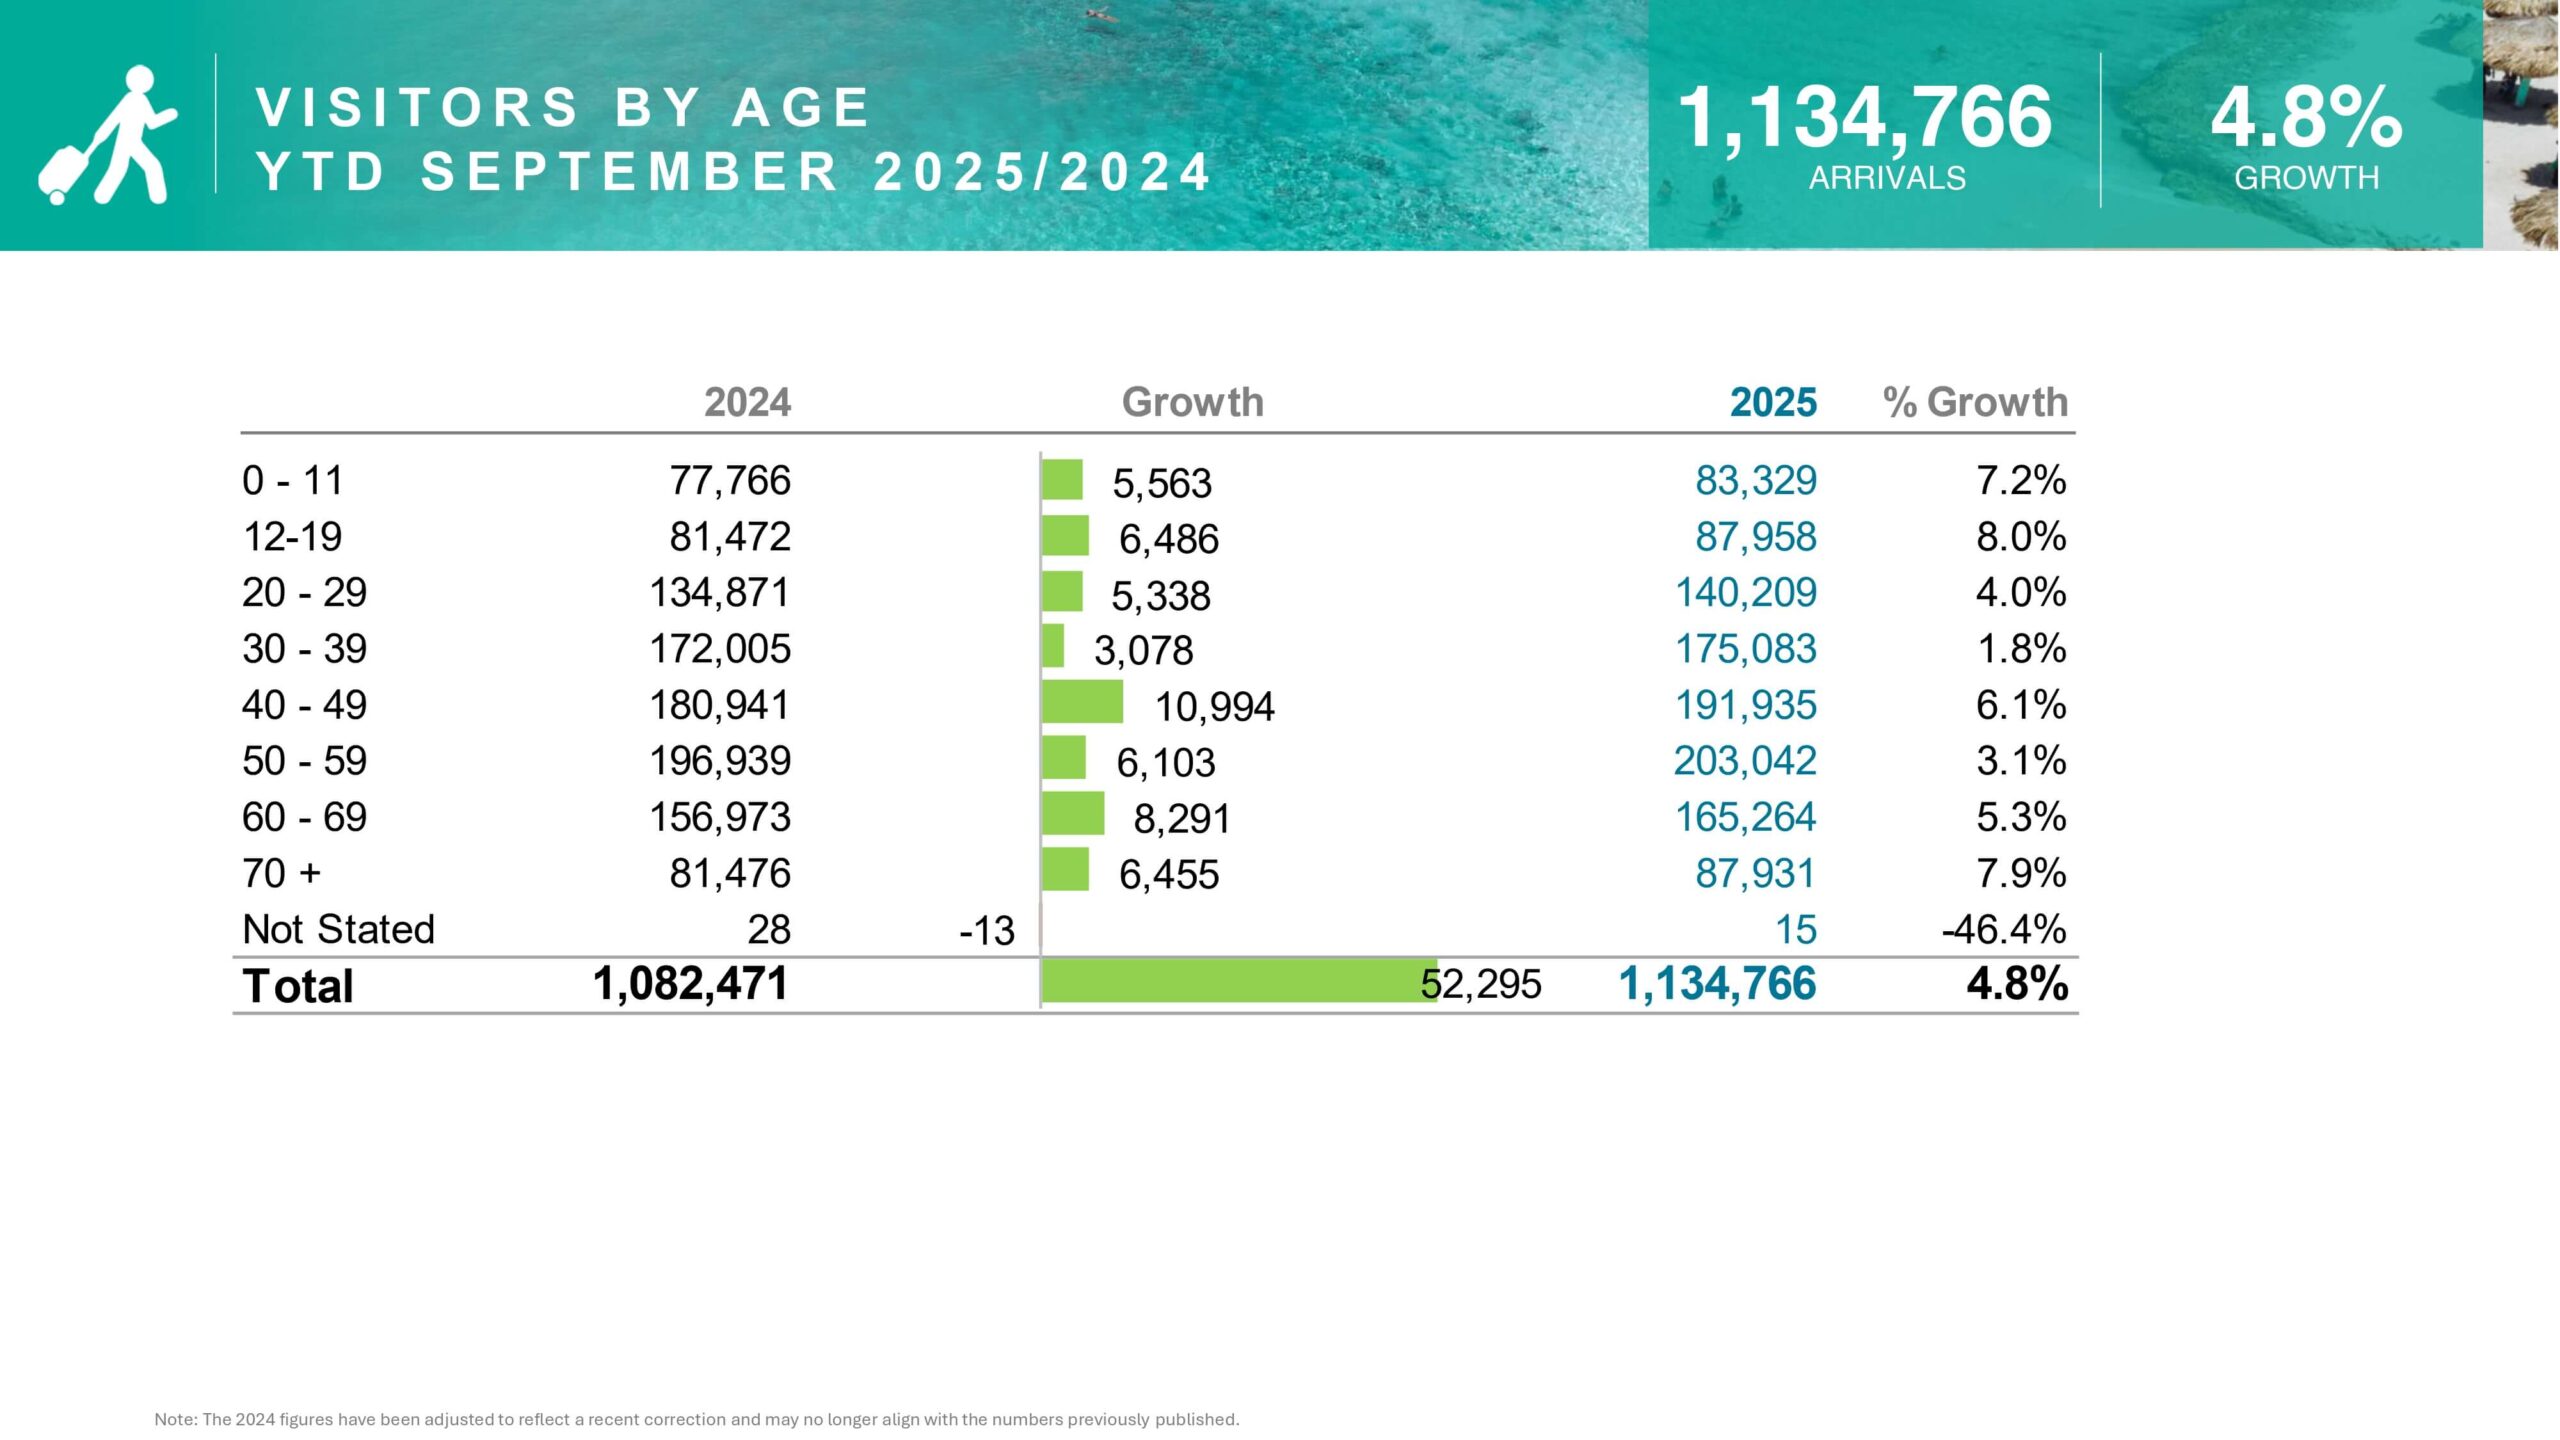
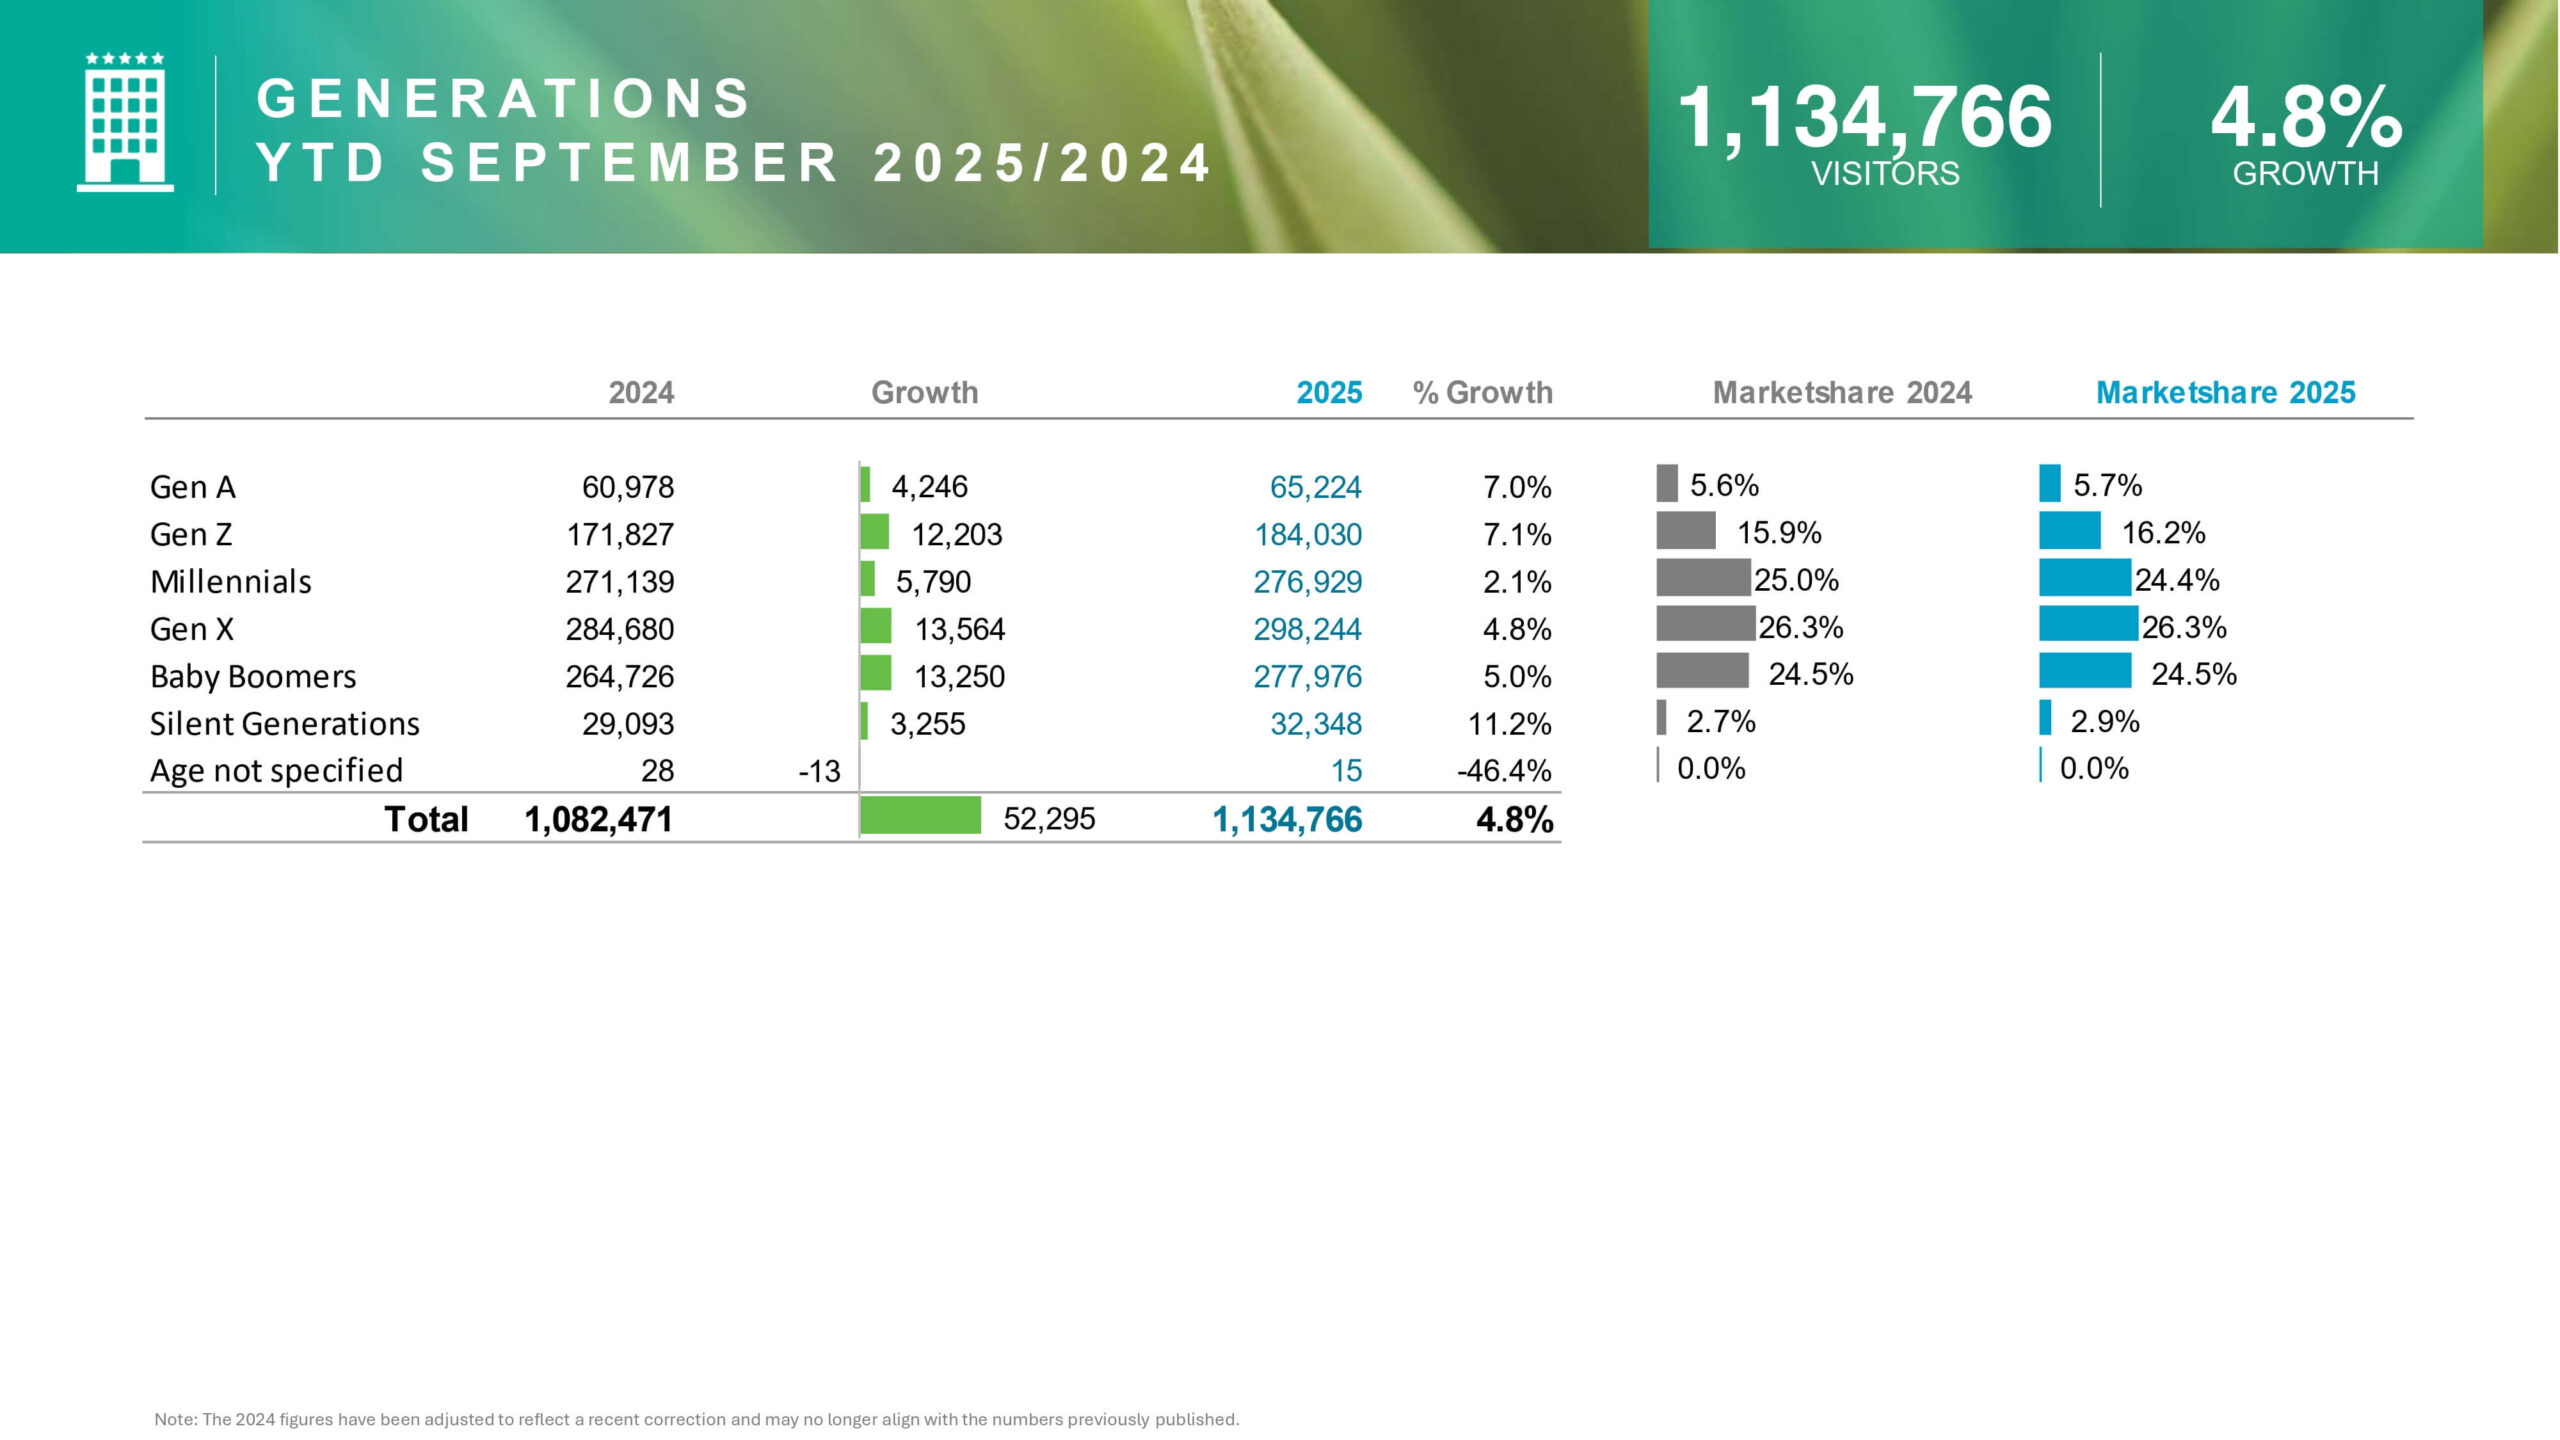
Aruba’s visitor arrivals show encouraging overall growth. Total arrivals grew by a strong 4.8% through September 2025. Clearly, this strong performance drives the local economy forward. A total of 1,134,766 stay-over visitors chose Aruba. This volume represents 52,295 more visitors than in 2024. The island maintains its powerful attraction for global travelers. We must now dissect this success by major source market.
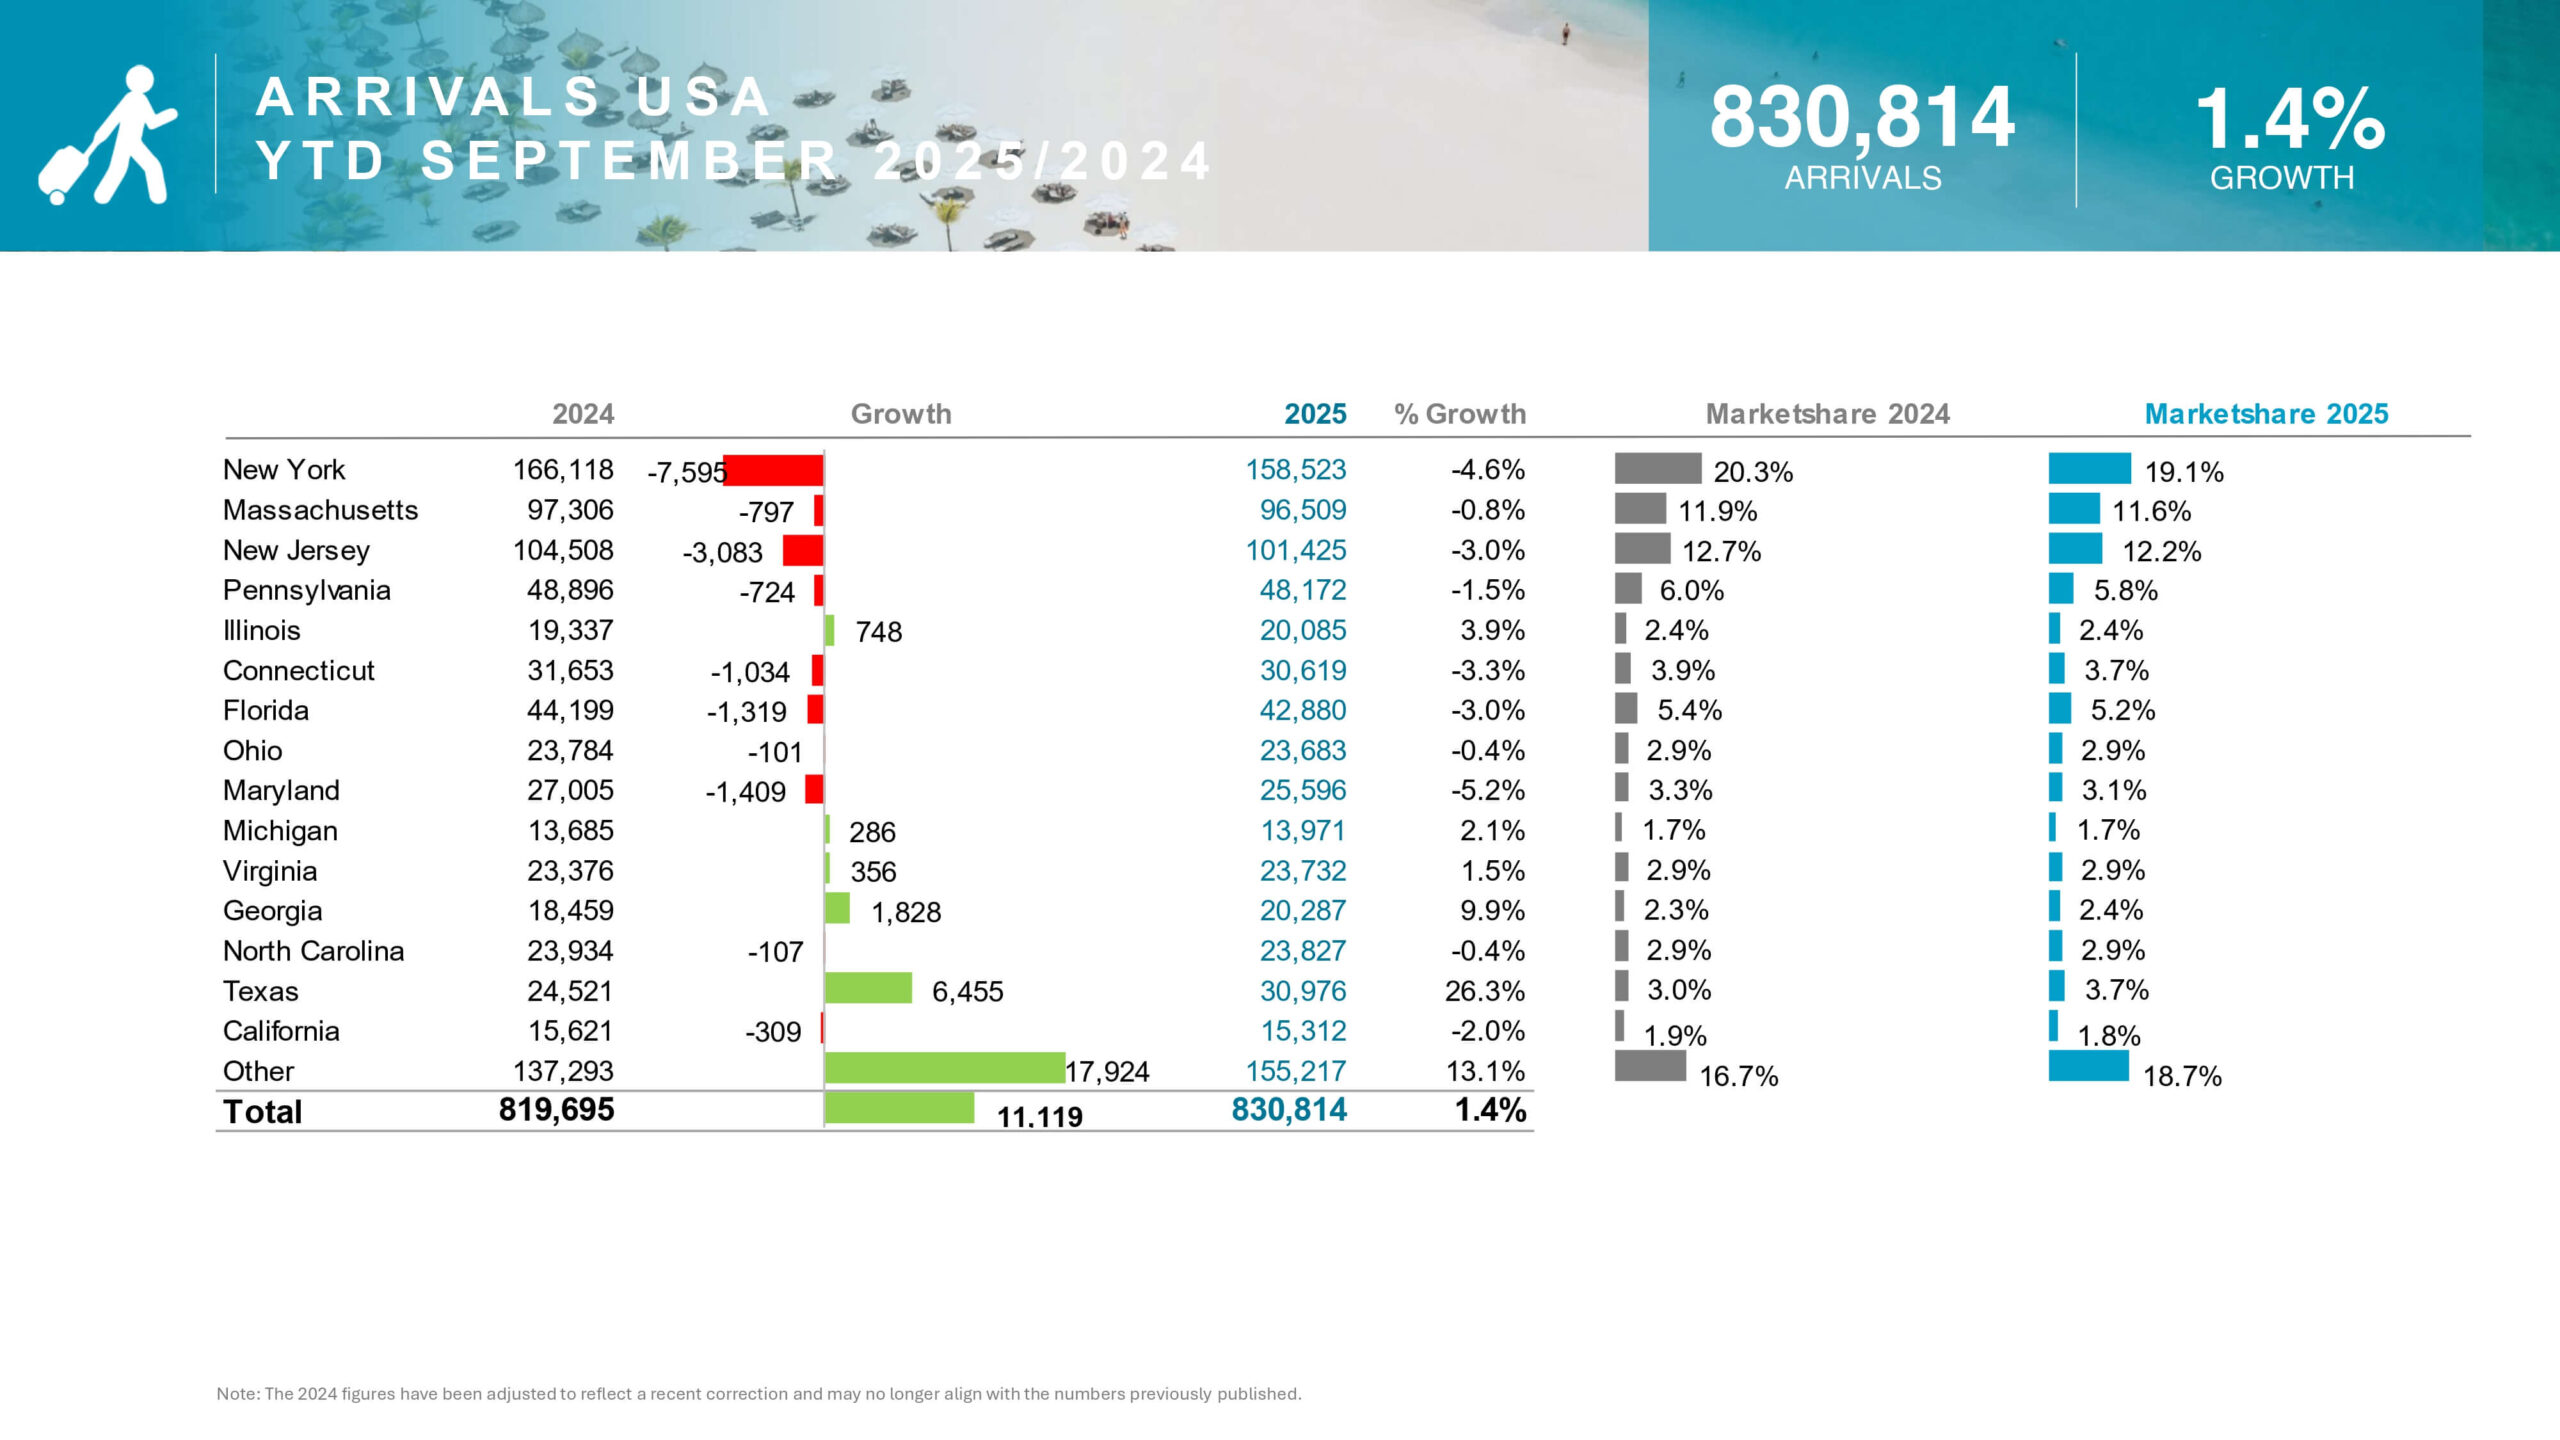
North America: A Steady Force for Aruba Tourism
North America remains Aruba’s most crucial source market. The region commands a majority 78.0% of the market share. YTD North American arrivals grew a solid 1.9%. Specifically, this growth generated 16,542 additional visitors. However, the primary USA market saw limited growth at only 1.4%. Only 11,119 more Americans visited the island. Furthermore, the USA market share slightly declined. It fell from 75.7% down to 73.2% YTD. This metric requires focused attention.

Conversely, Canada’s performance proves exceptionally strong. Canadian arrivals surged by an impressive 11.1% YTD. This increase added 5,423 guests to the total count. Ultimately, Aruba’s marketing efforts clearly resonate well there. The North American performance continues driving overall Aruba tourism growth 2025. The region remains the anchor of the island’s tourism base. We must actively seek to bolster this essential market.
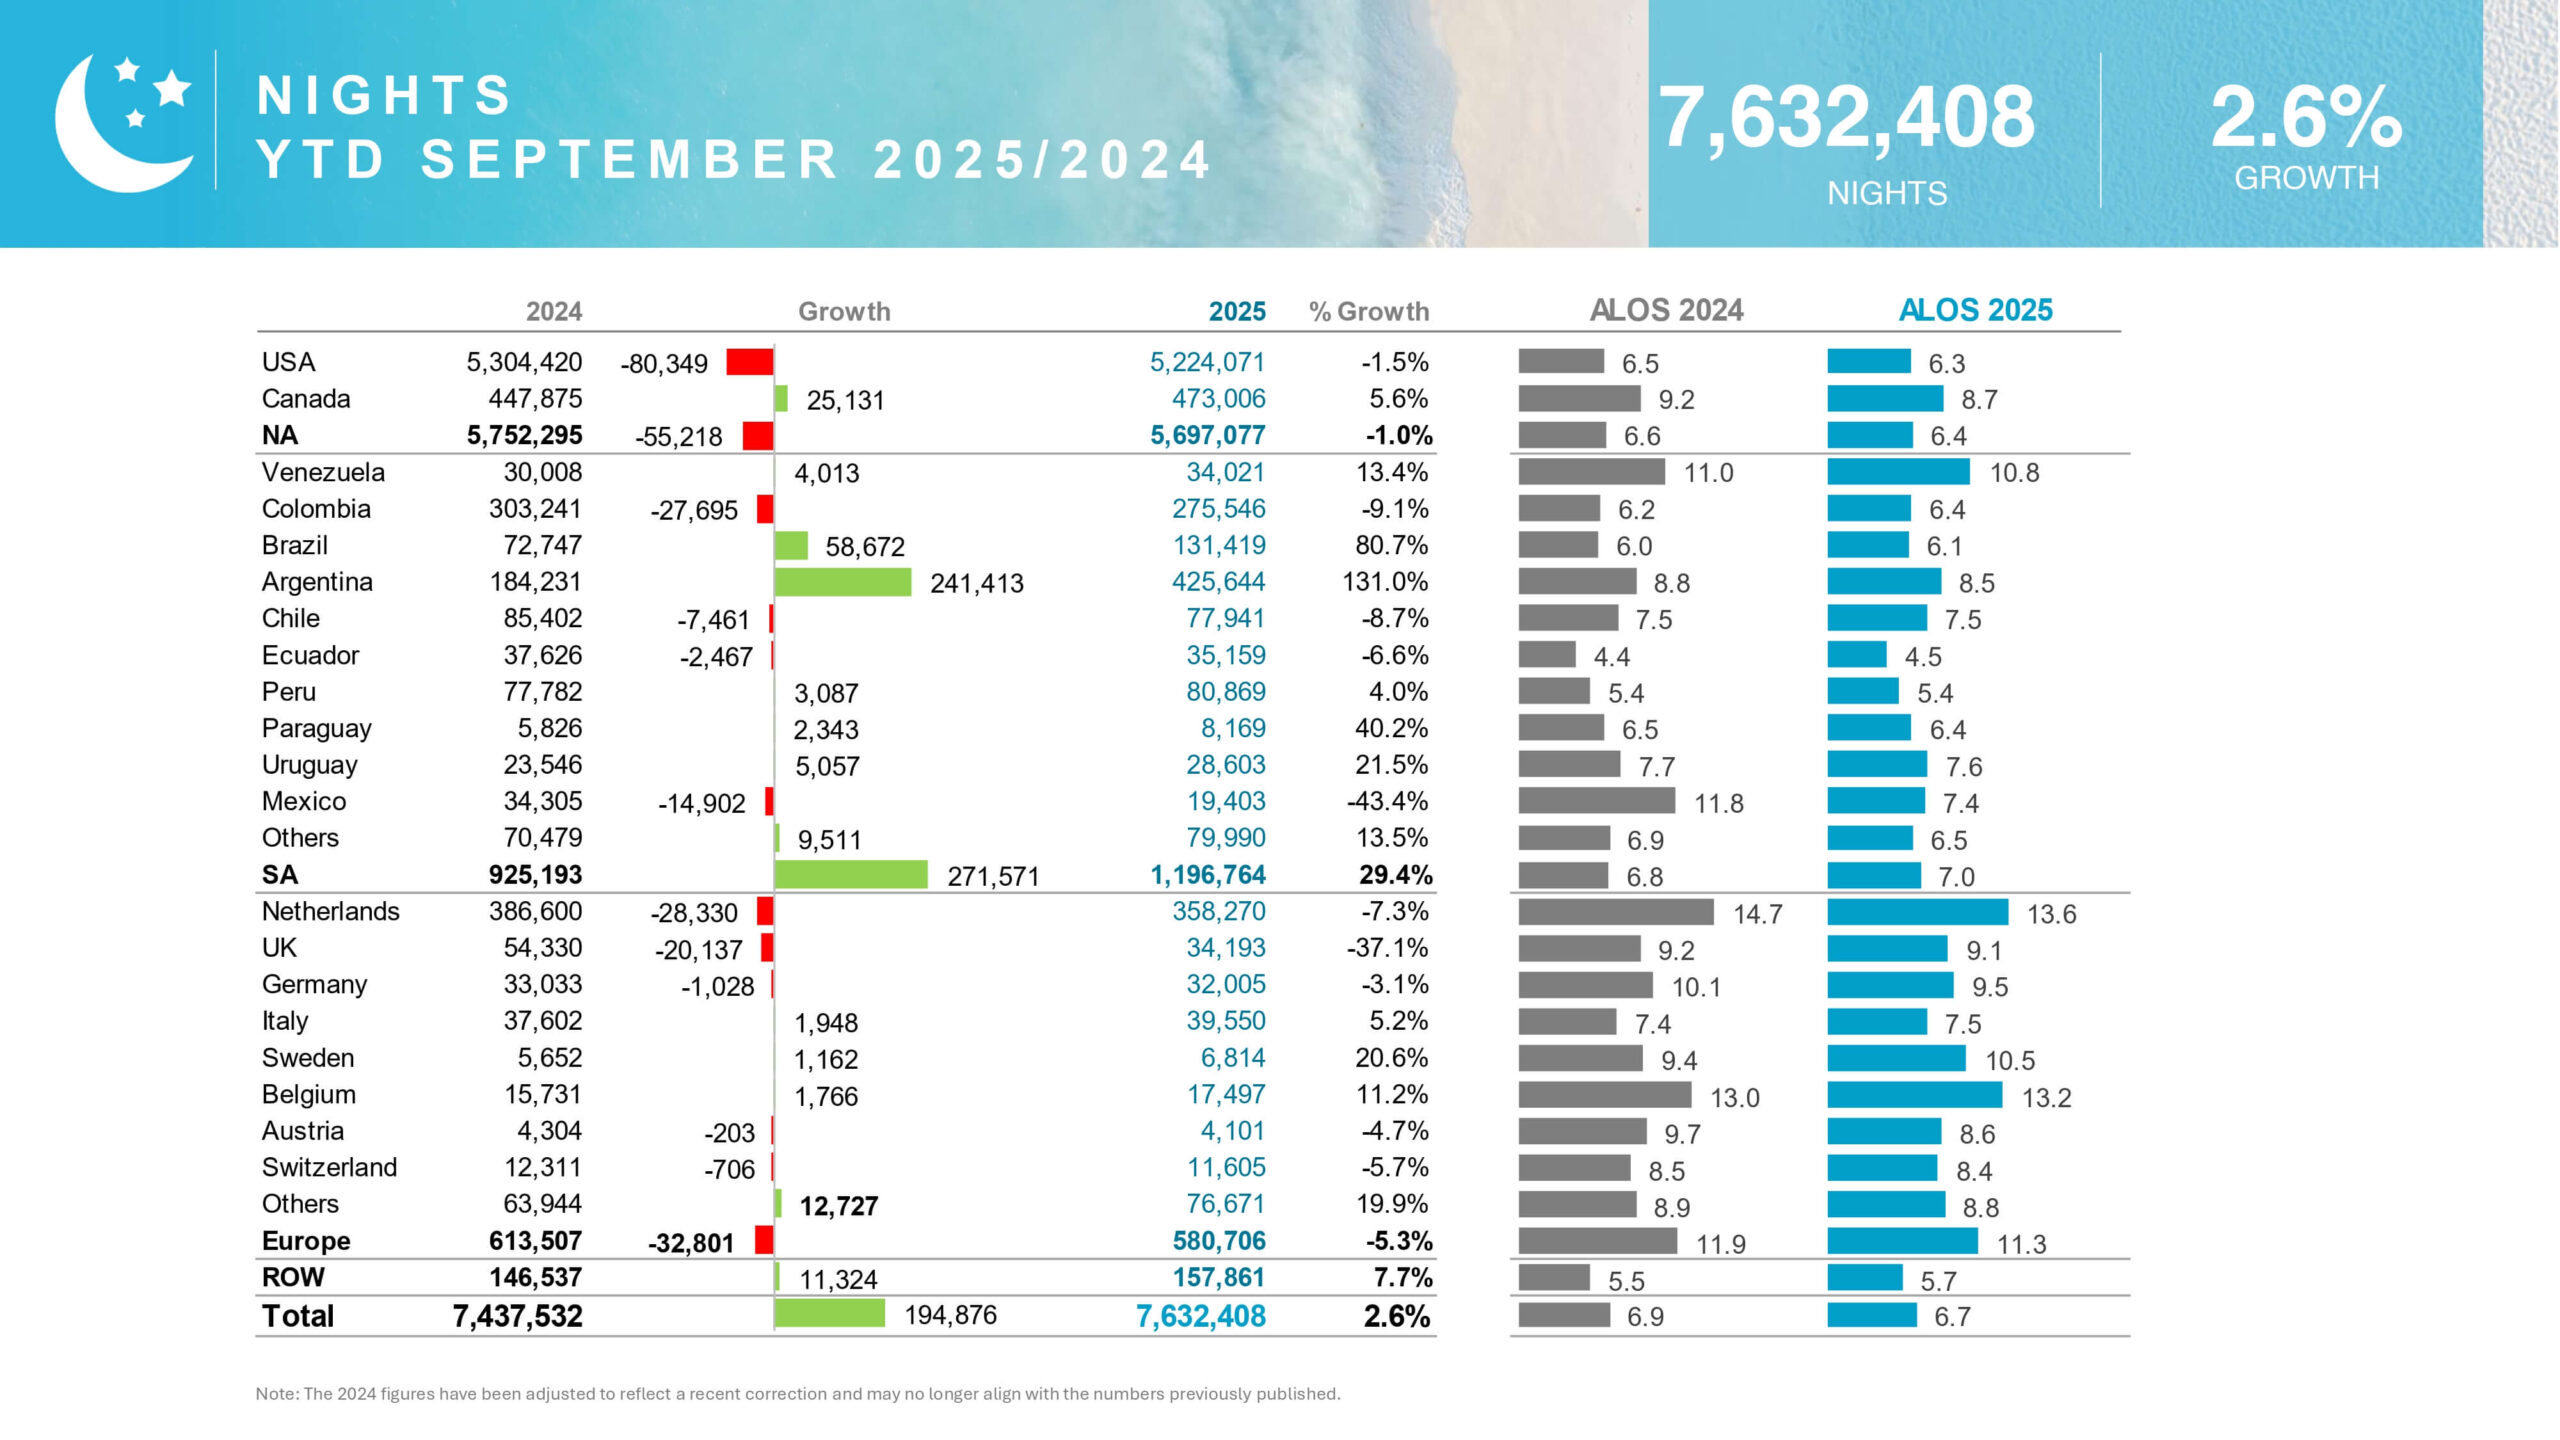
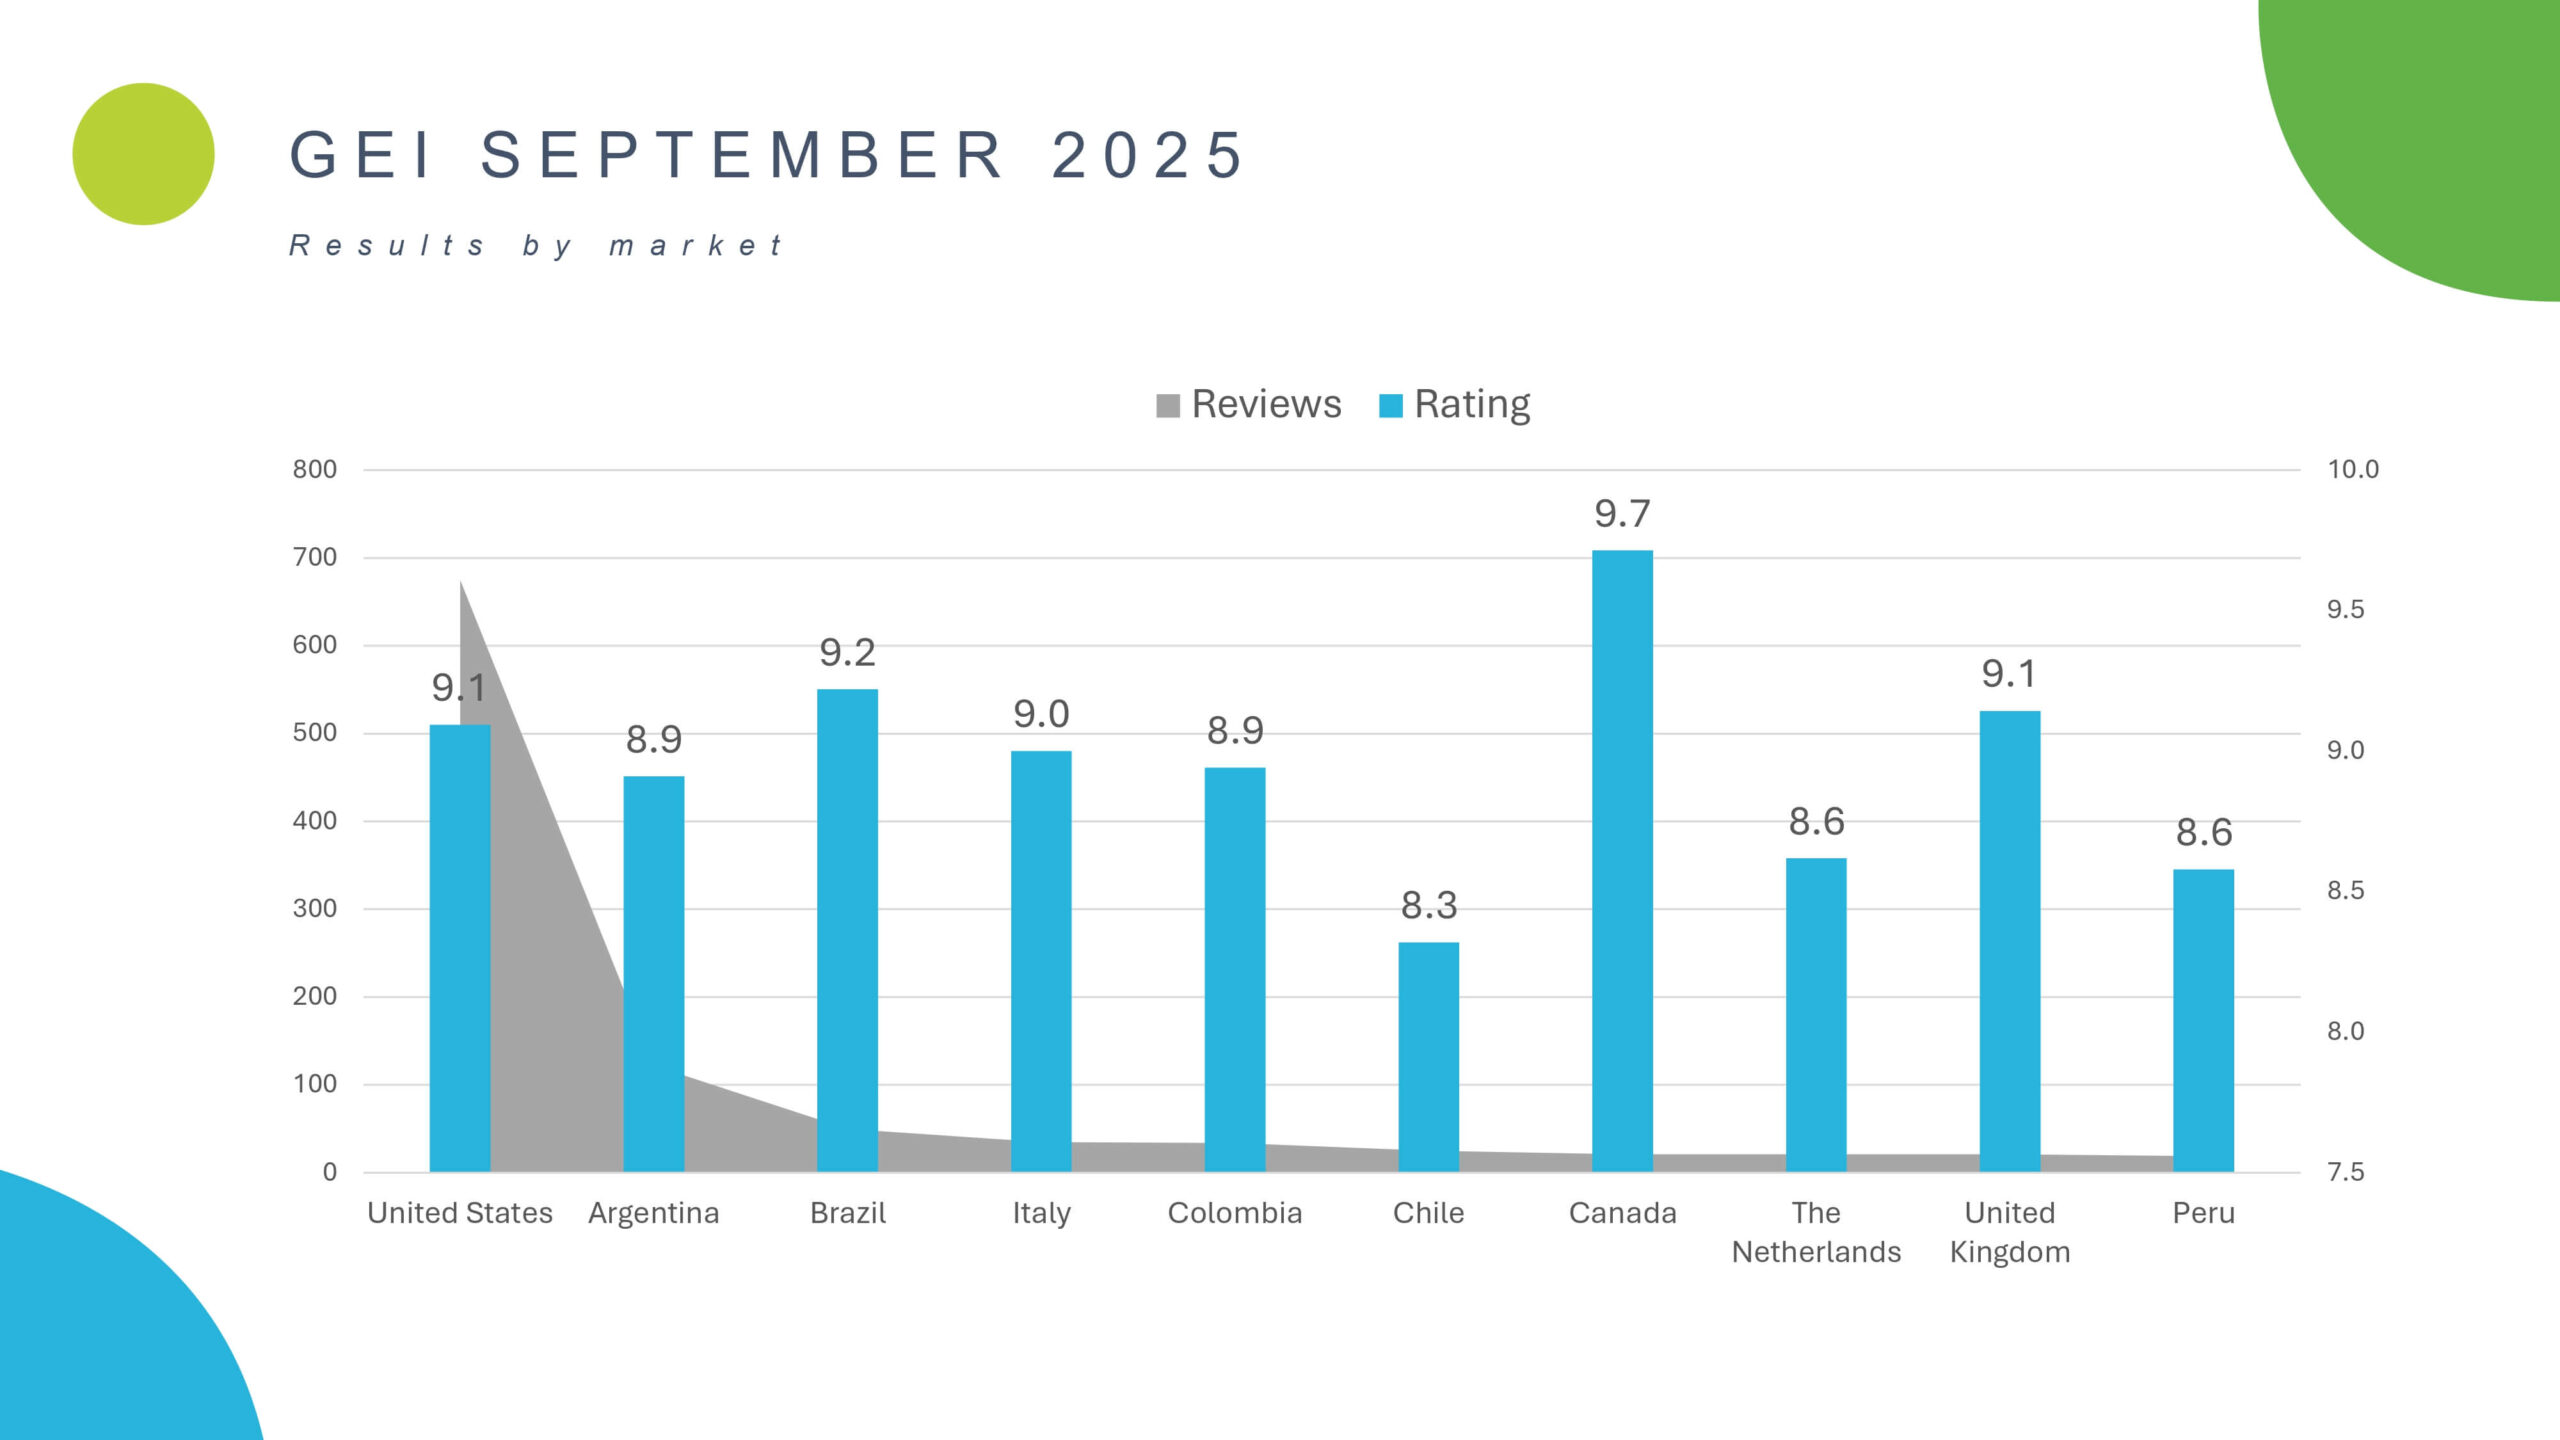
South America’s Spectacular Surge Fuels Growth
South America shows the most dynamic market changes this year. The region collectively achieved a massive 25.7% YTD increase. Indeed, this is an outstanding performance overall. This influx translates to 34,975 new arrivals. This successful strategy shifts market focus.

Brazil demonstrated incredible upward momentum. Brazilian visitor numbers exploded by 77.6% YTD. Specifically, this added over nine thousand visitors. Argentina showed even more staggering results. Argentinean arrivals skyrocketed by 139.4%. This astonishing rate brought in 29,062 new travelers. Notably, this significant growth reshapes market expectations. Aruba’s strong appeal to travelers is powerfully engaging this audience. The island must sustain this robust growth.


Conversely, the Colombian market faced a steep challenge. Arrivals from Colombia dropped by 11.3% YTD. This represents a loss of 5,528 potential guests. Chile, Ecuador, and Mexico also saw minor declines. Ultimately, the massive Brazilian and Argentine gains offset these losses. This creates a robust picture for regional Aruba tourism statistics. The island successfully diversified its South American base. For more details on this regional success, read our related post: Aruba Tourism Growth 2025 Record Arrivals, Economic Impact.


European and Rest of World Market Summary
European markets showed an almost flat YTD performance. The total regional arrivals only dropped by a marginal 0.2%. This translates to a small loss of 122 visitors. Therefore, the European base held steady overall. Key markets like Italy (4.1%) and Germany (3.0%) showed modest gains. However, the United Kingdom market remains a concern. UK arrivals decreased steeply by 36.6% YTD. This significant drop removes 2,169 visitors from the total. The island must strategically address this loss.
The Rest of the World (ROW) market grew by 3.4% YTD. Consequently, this added 900 new travelers to the total count. This steady growth confirms Aruba’s expanding global reach. Finally, the data shows a need to review specific European market strategies.
| Market | YTD September 2025 Arrivals | % Growth vs. 2024 |
| Total | 1,134,766 | 4.8% |
| USA | 830,814 | 1.4% |
| Canada | 54,086 | 11.1% |
| Brazil | 21,404 | 77.6% |
| Argentina | 49,905 | 139.4% |
| Colombia | 43,319 | -11.3% |
| UK | 3,751 | -36.6% |
September 2025: A Deep Dive into Monthly Trends
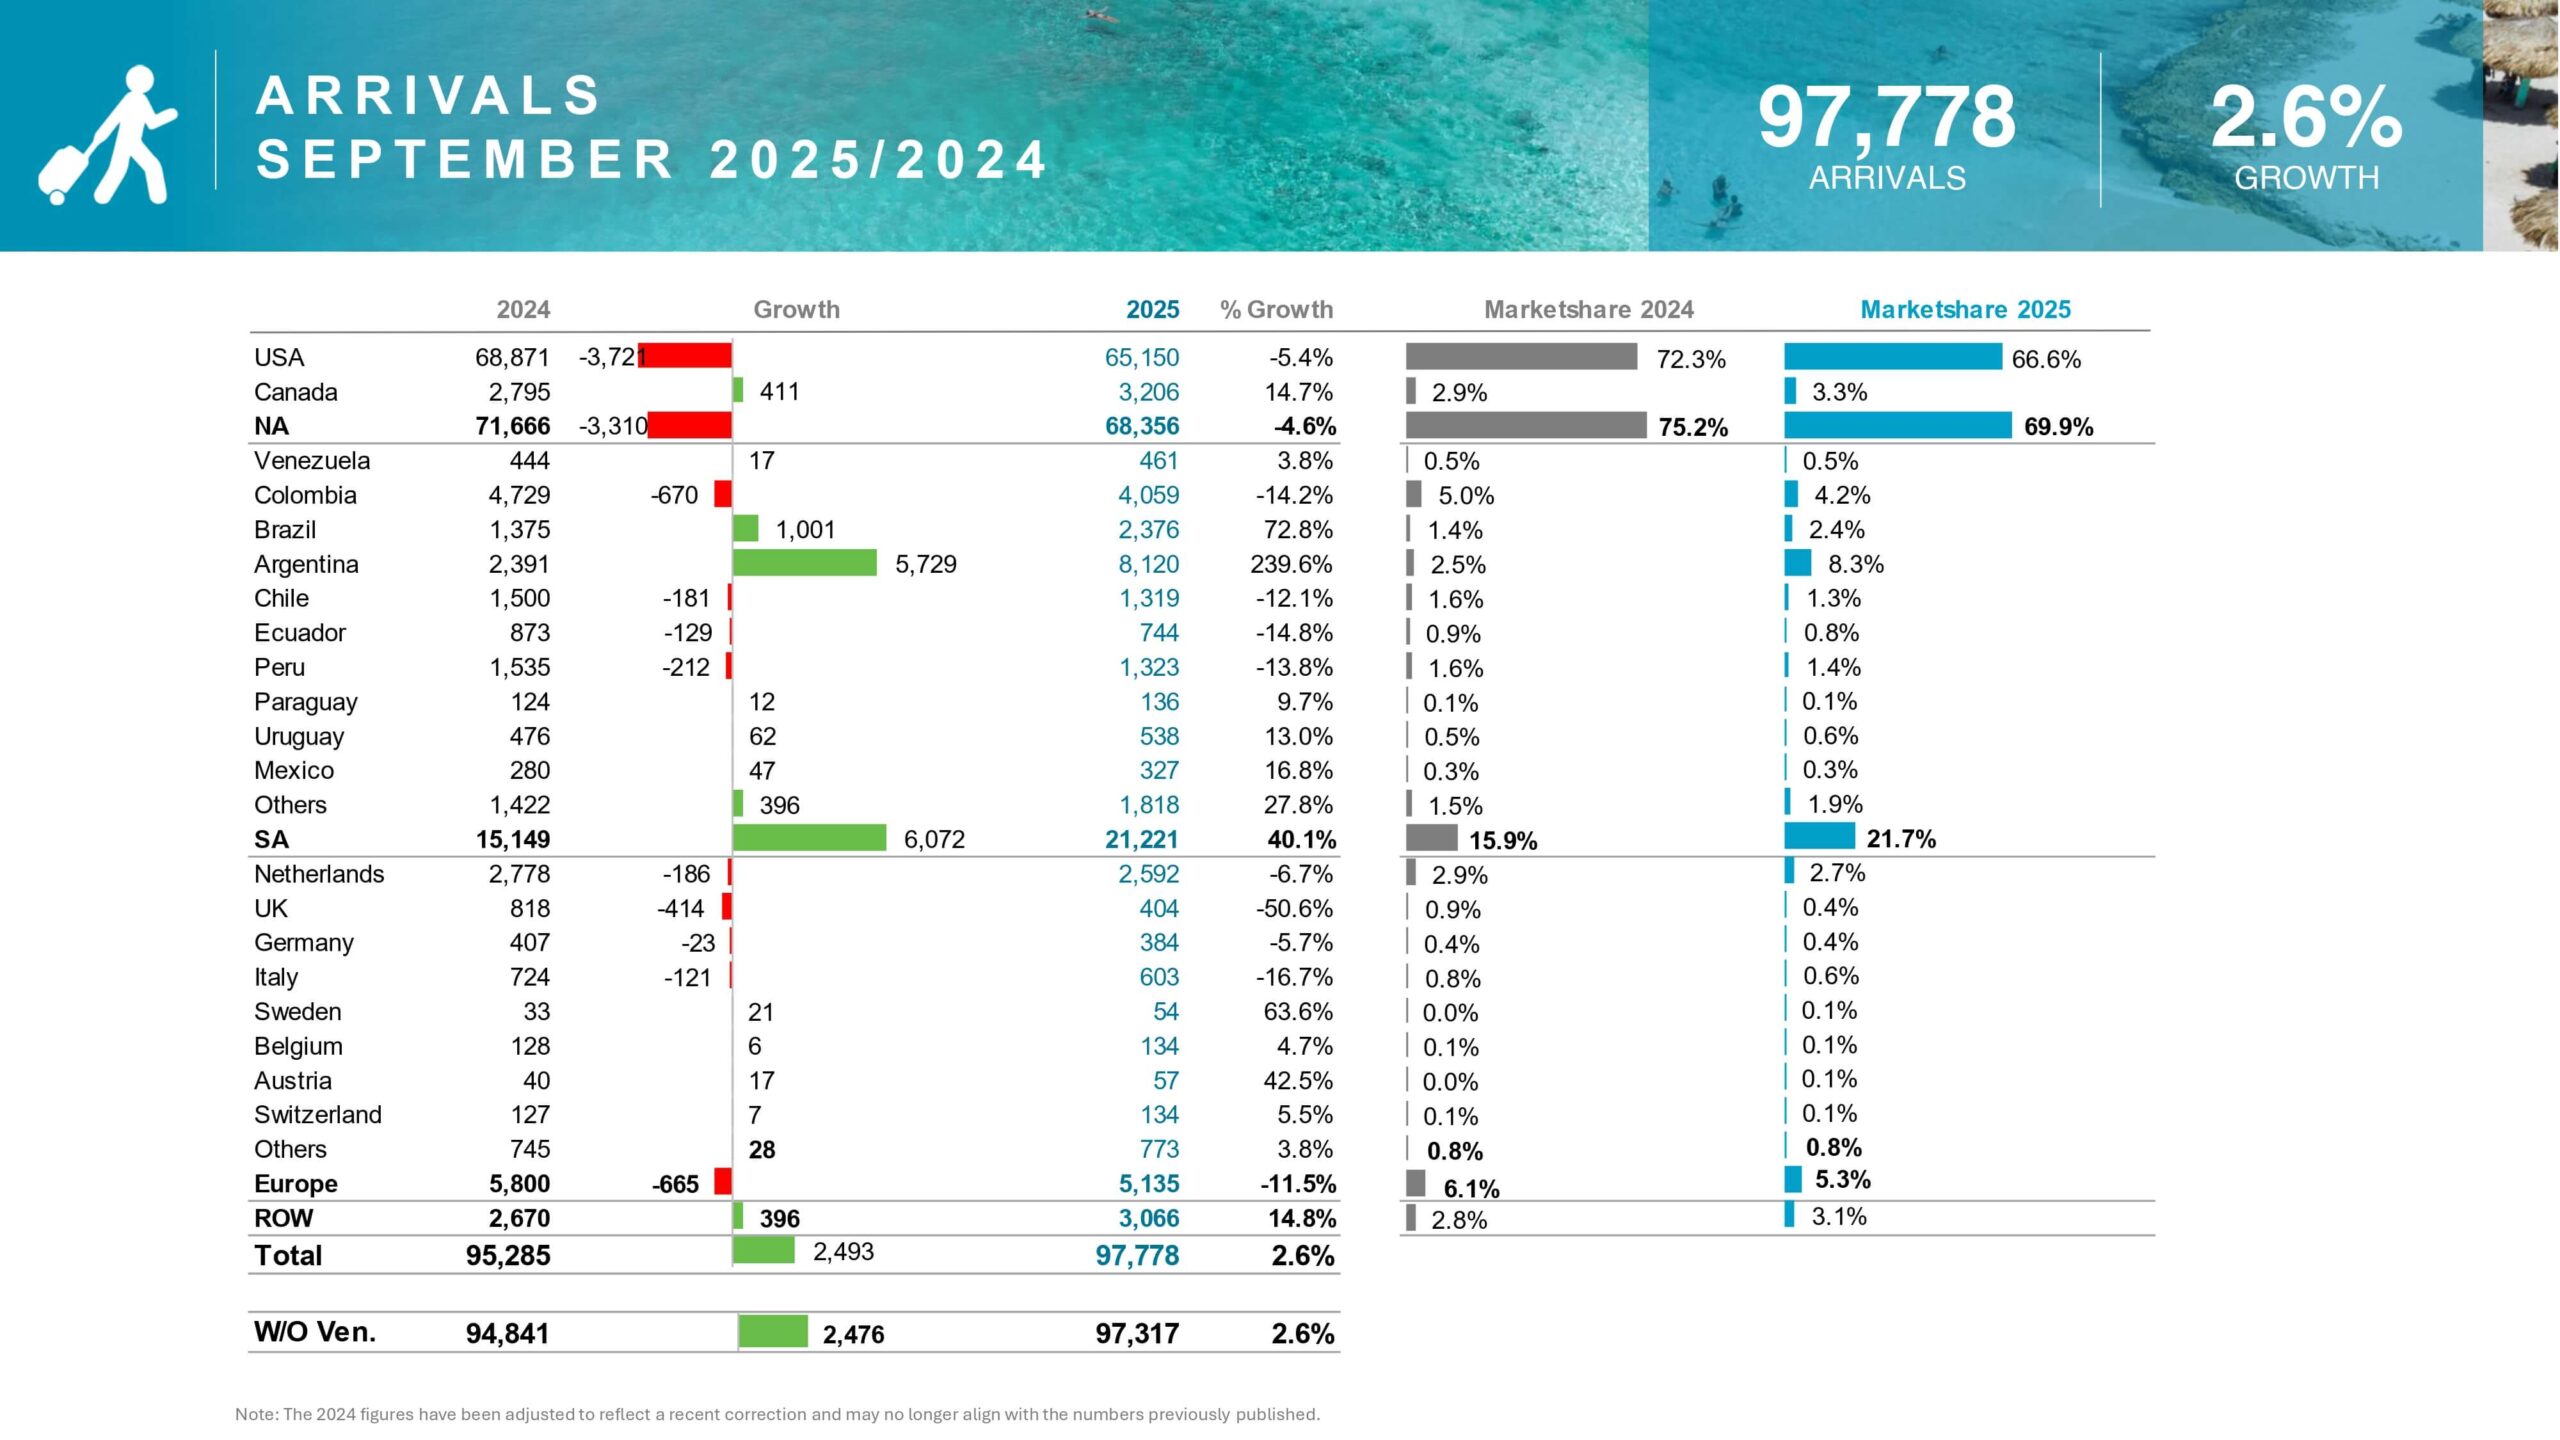
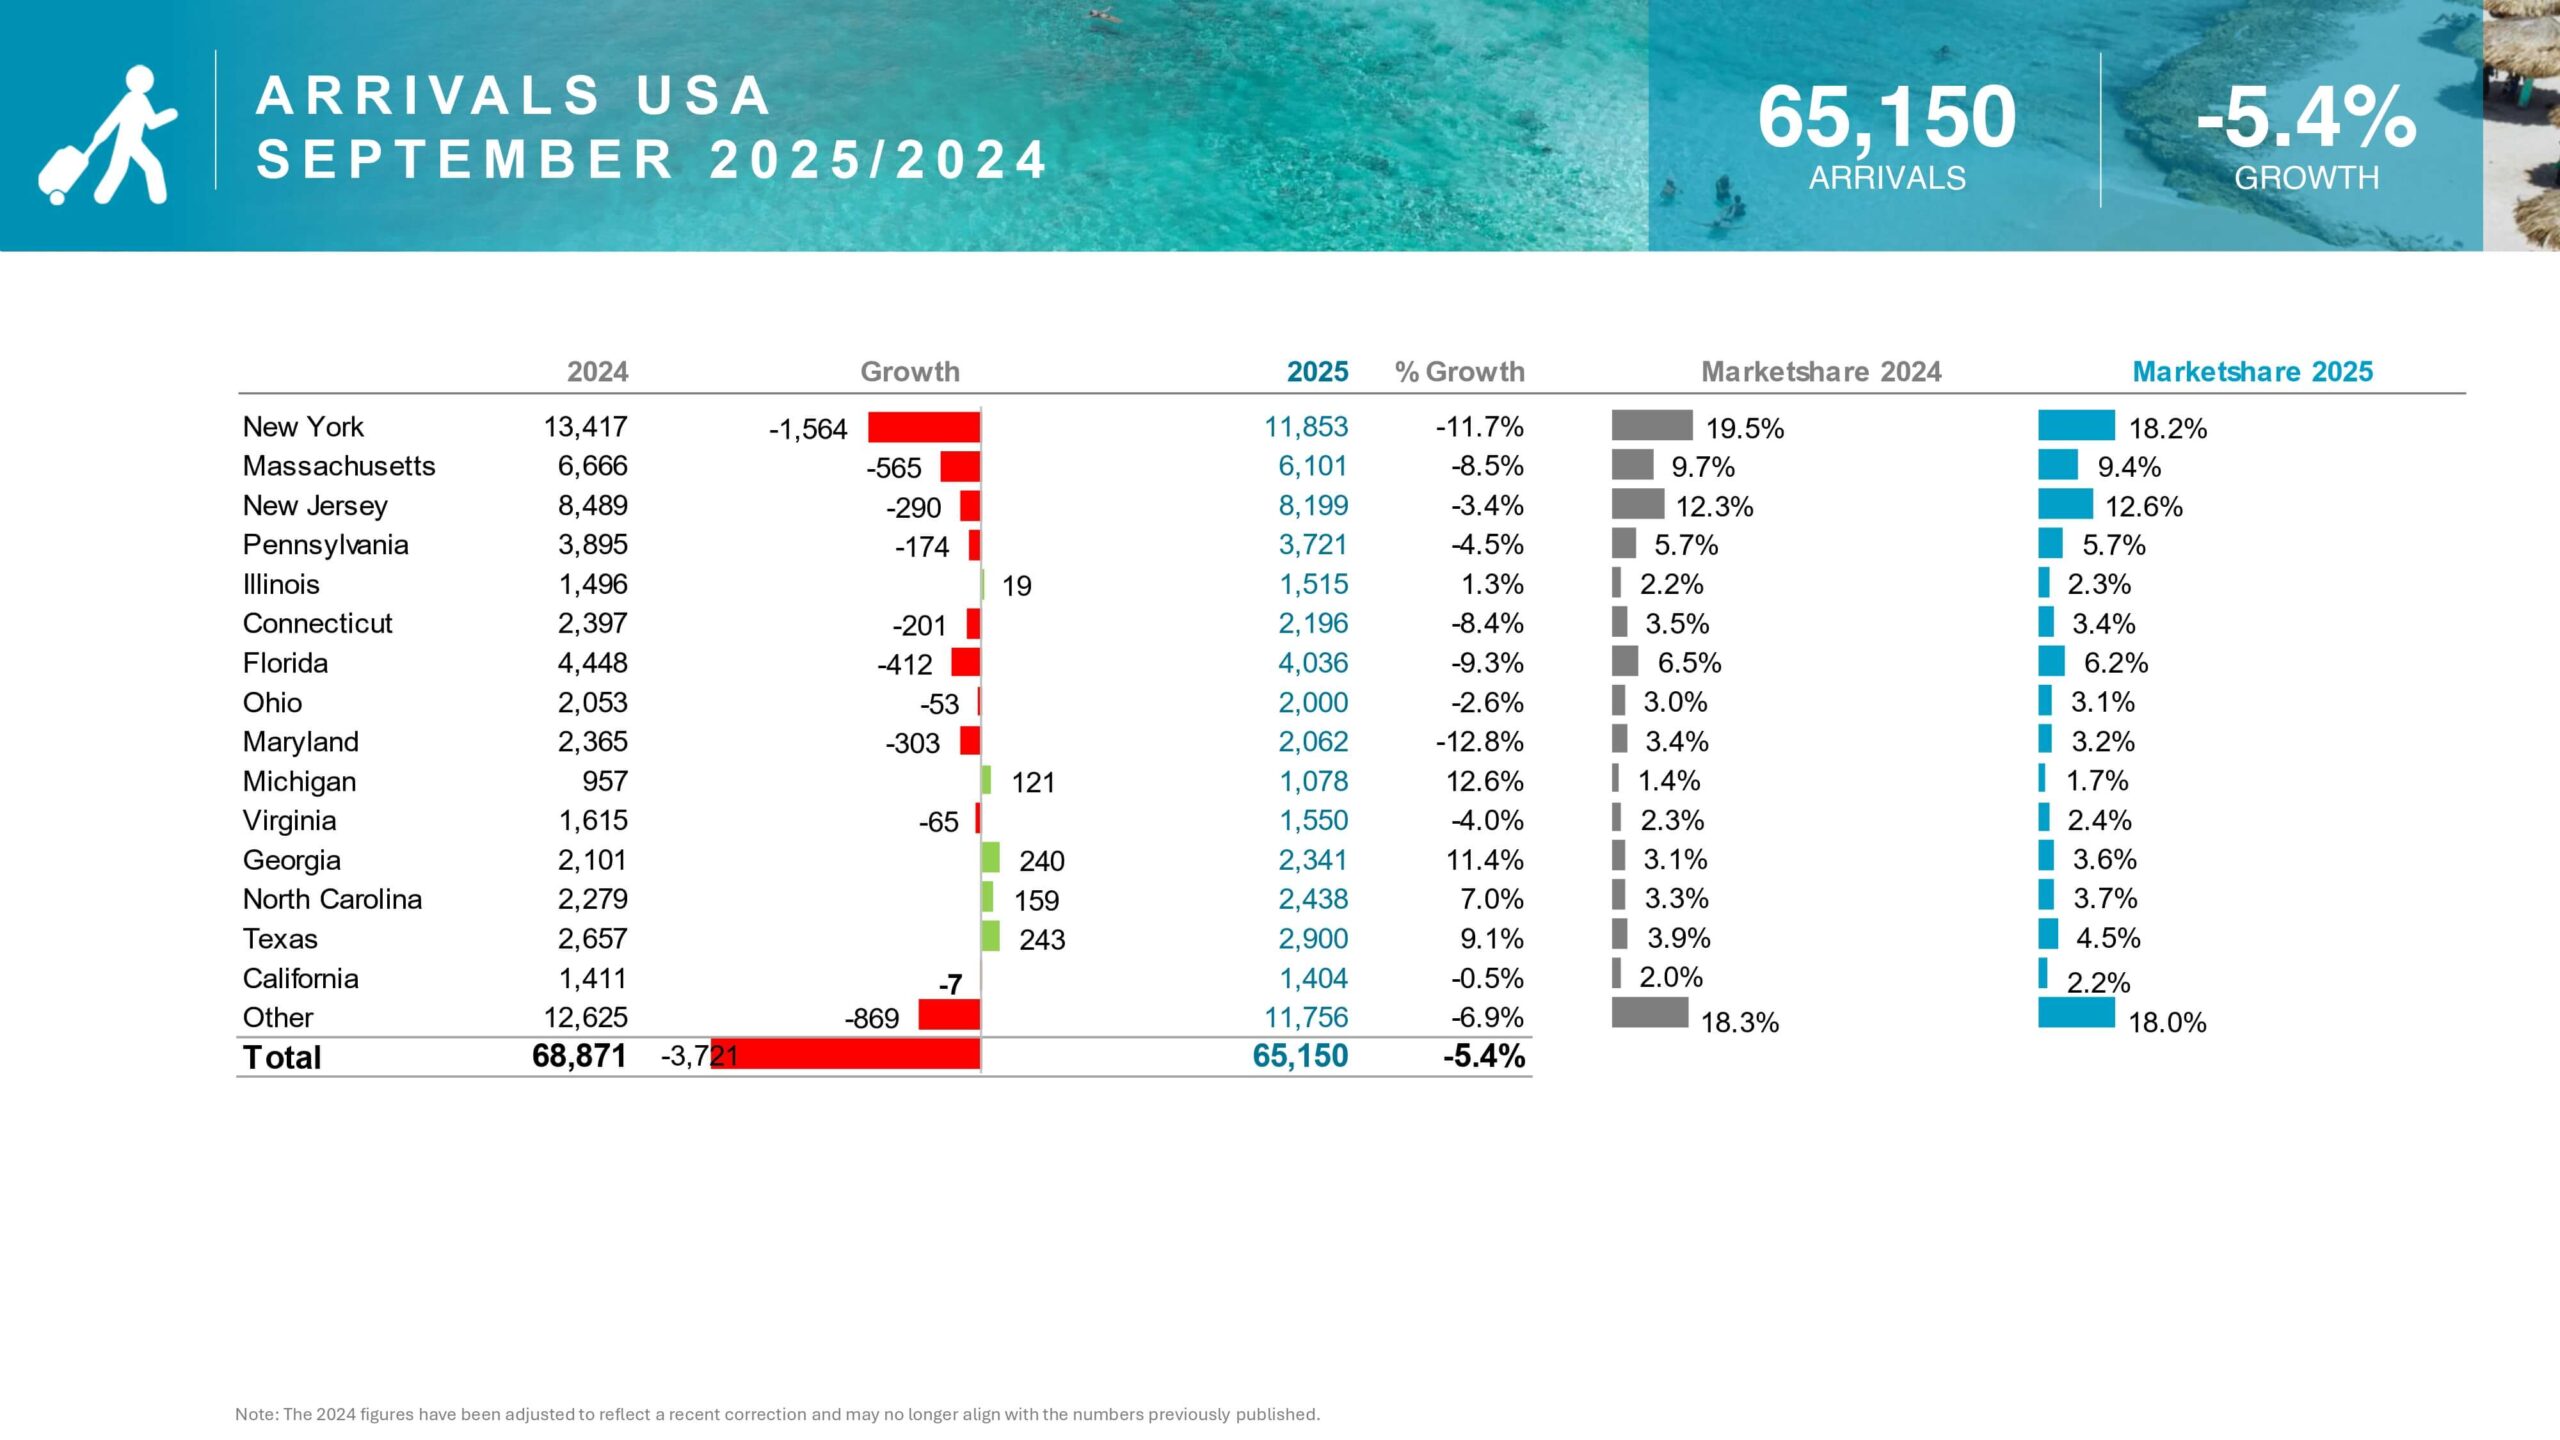
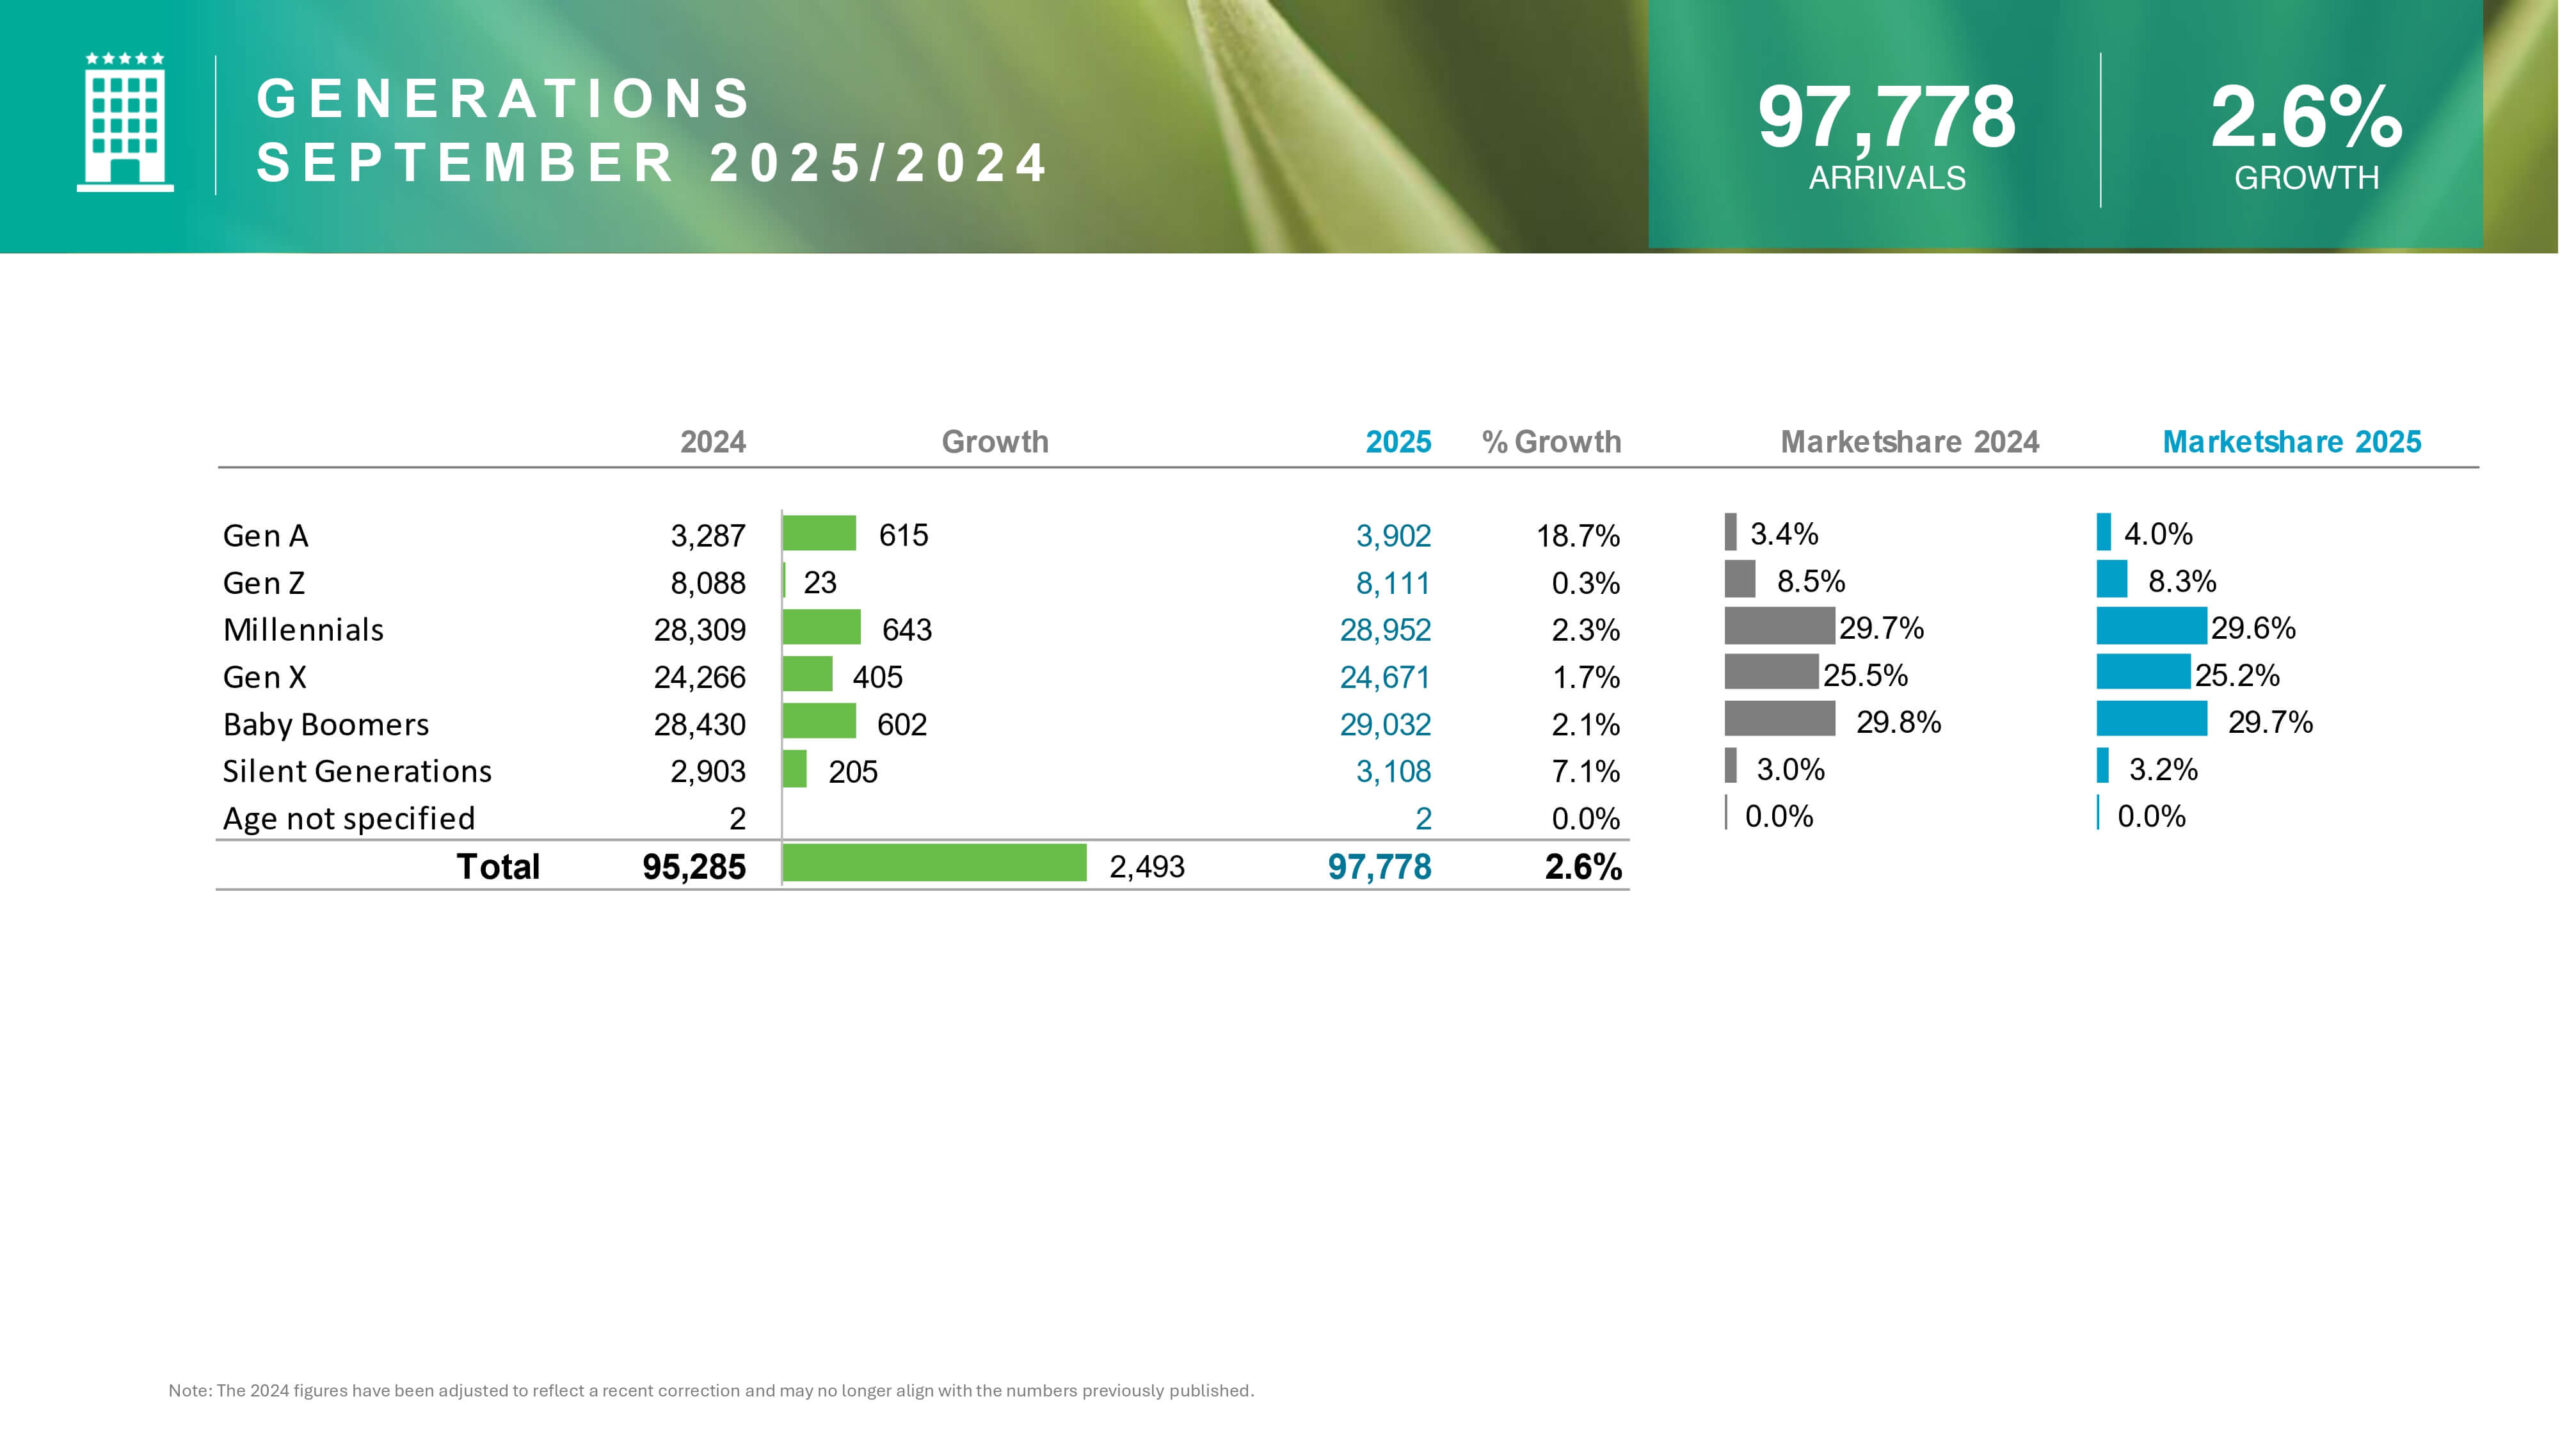
The month of September saw a total arrivals growth of 2.6%. This translates to 2,493 more guests than last year. However, the monthly figures reveal critical market volatility. This monthly data requires careful interpretation.

Shifting Tides: Analyzing Key Market Changes
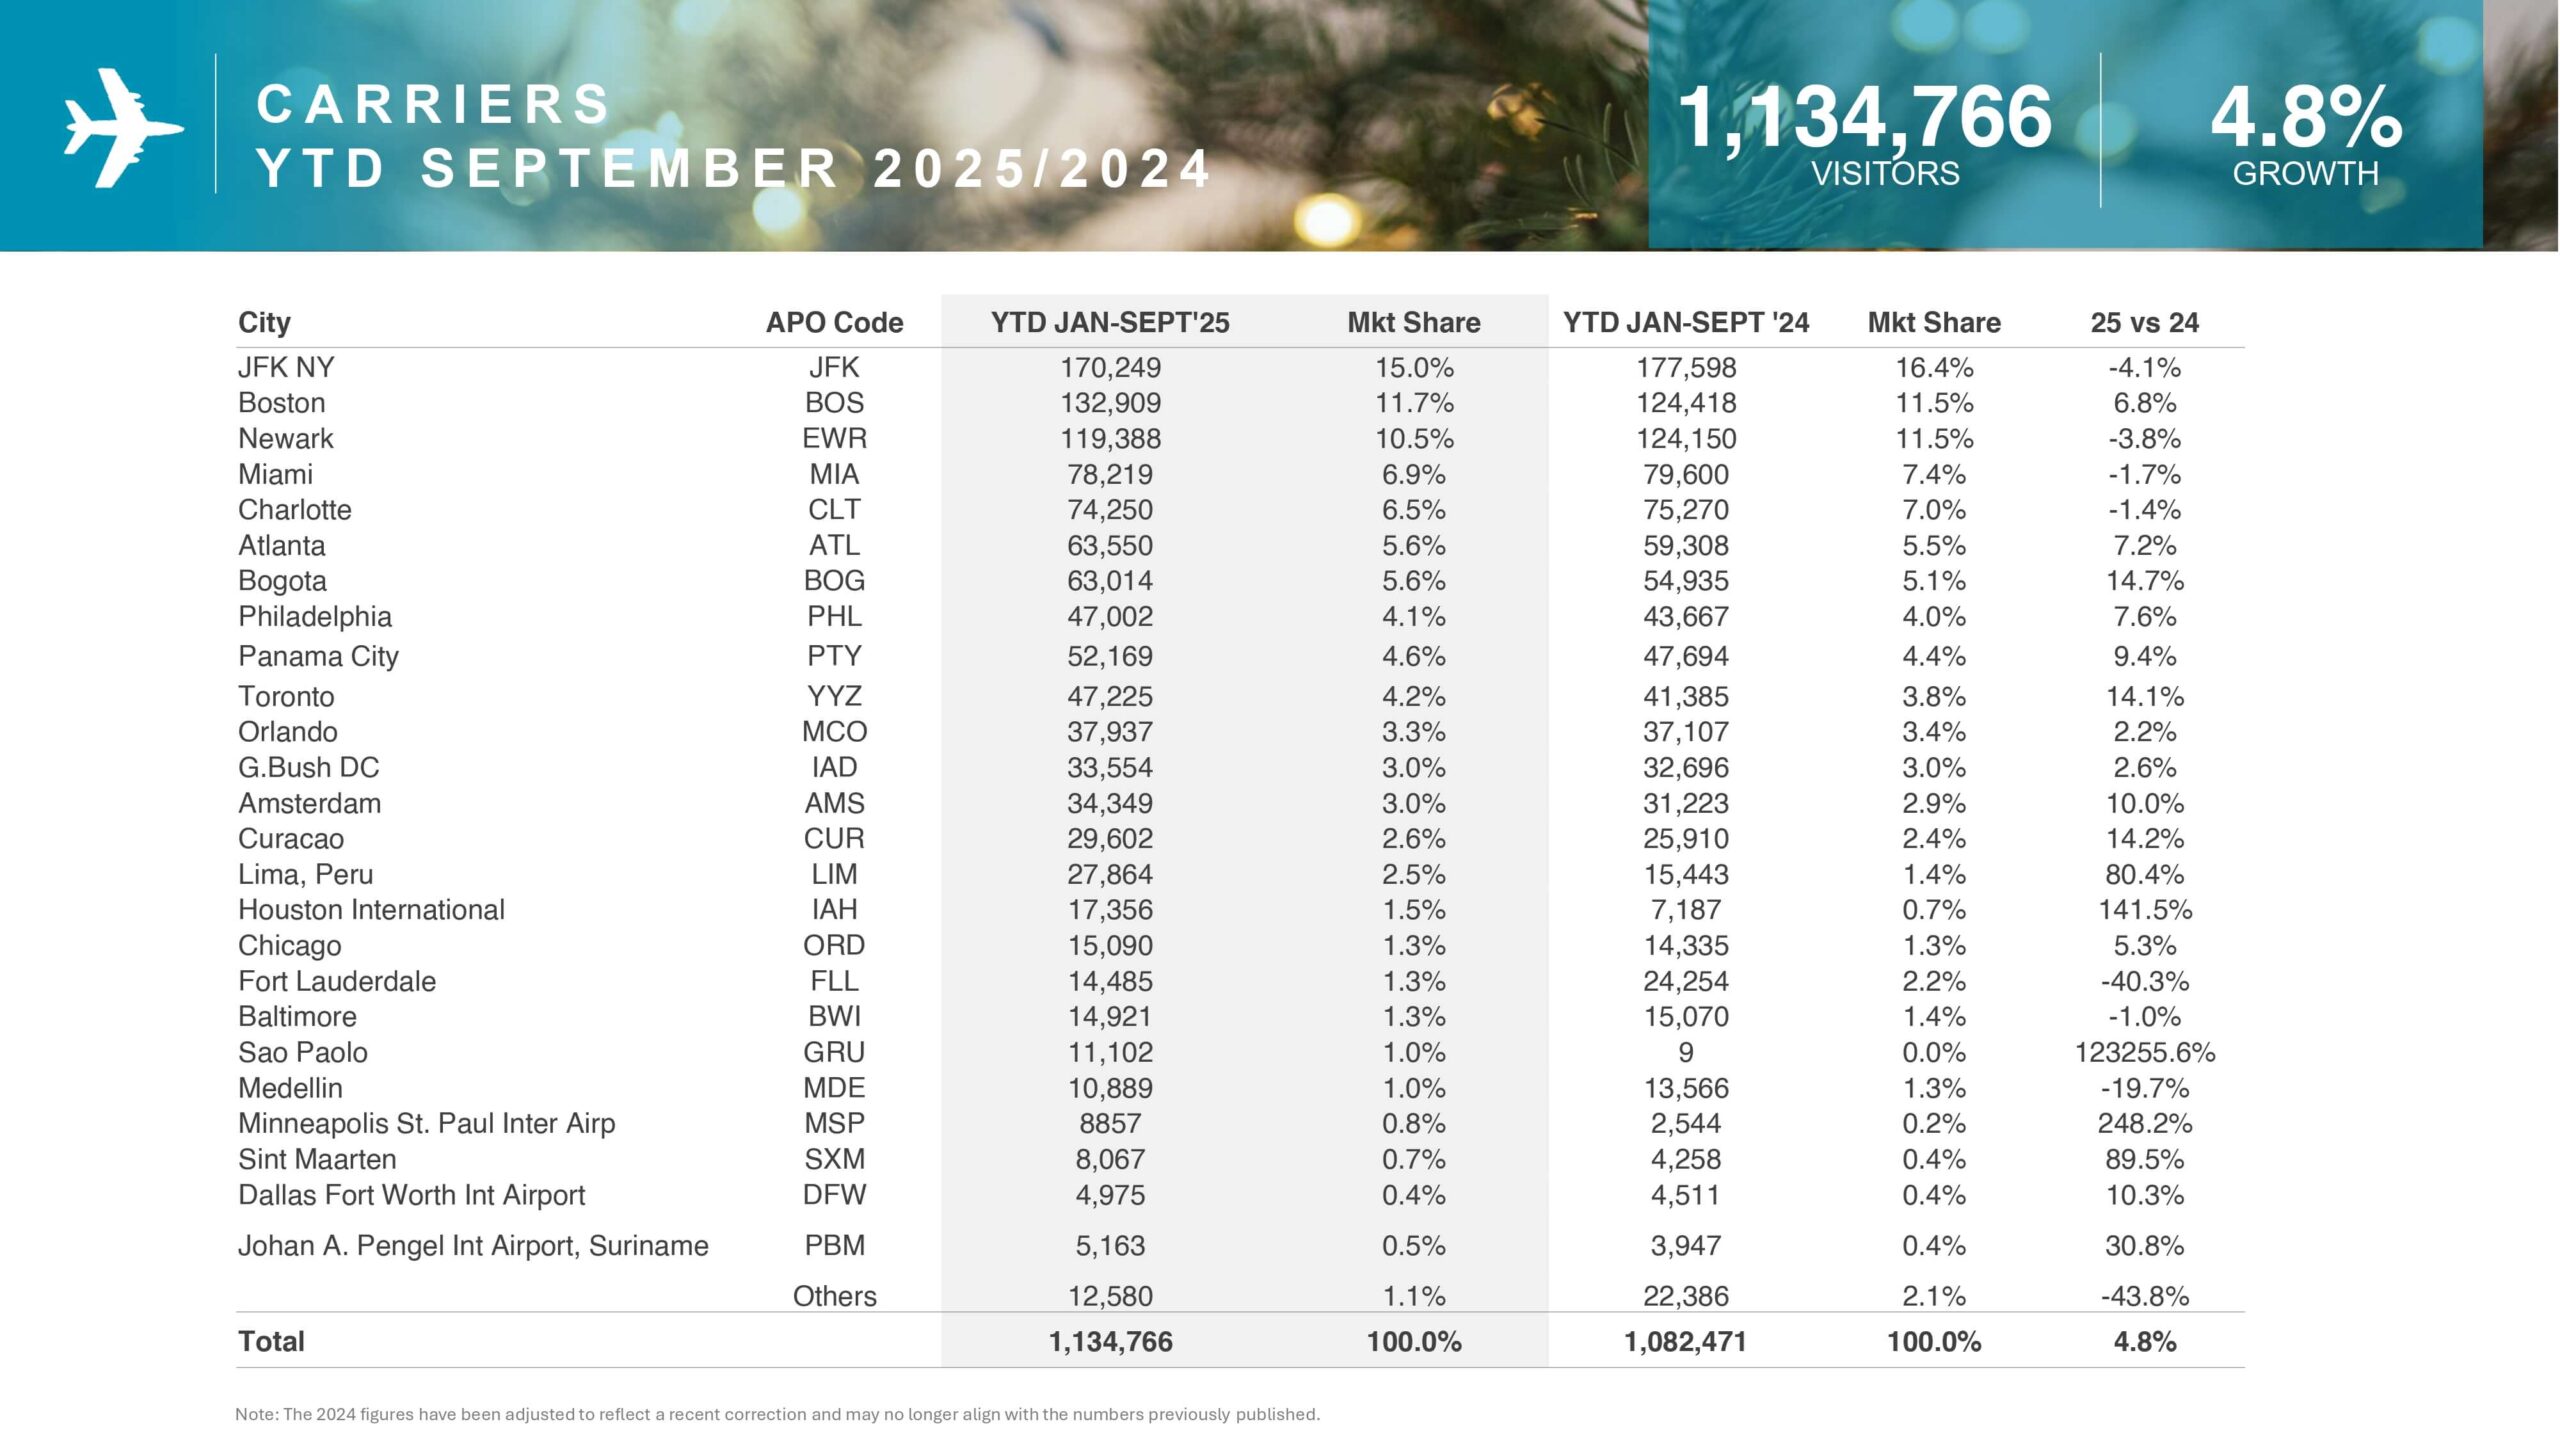
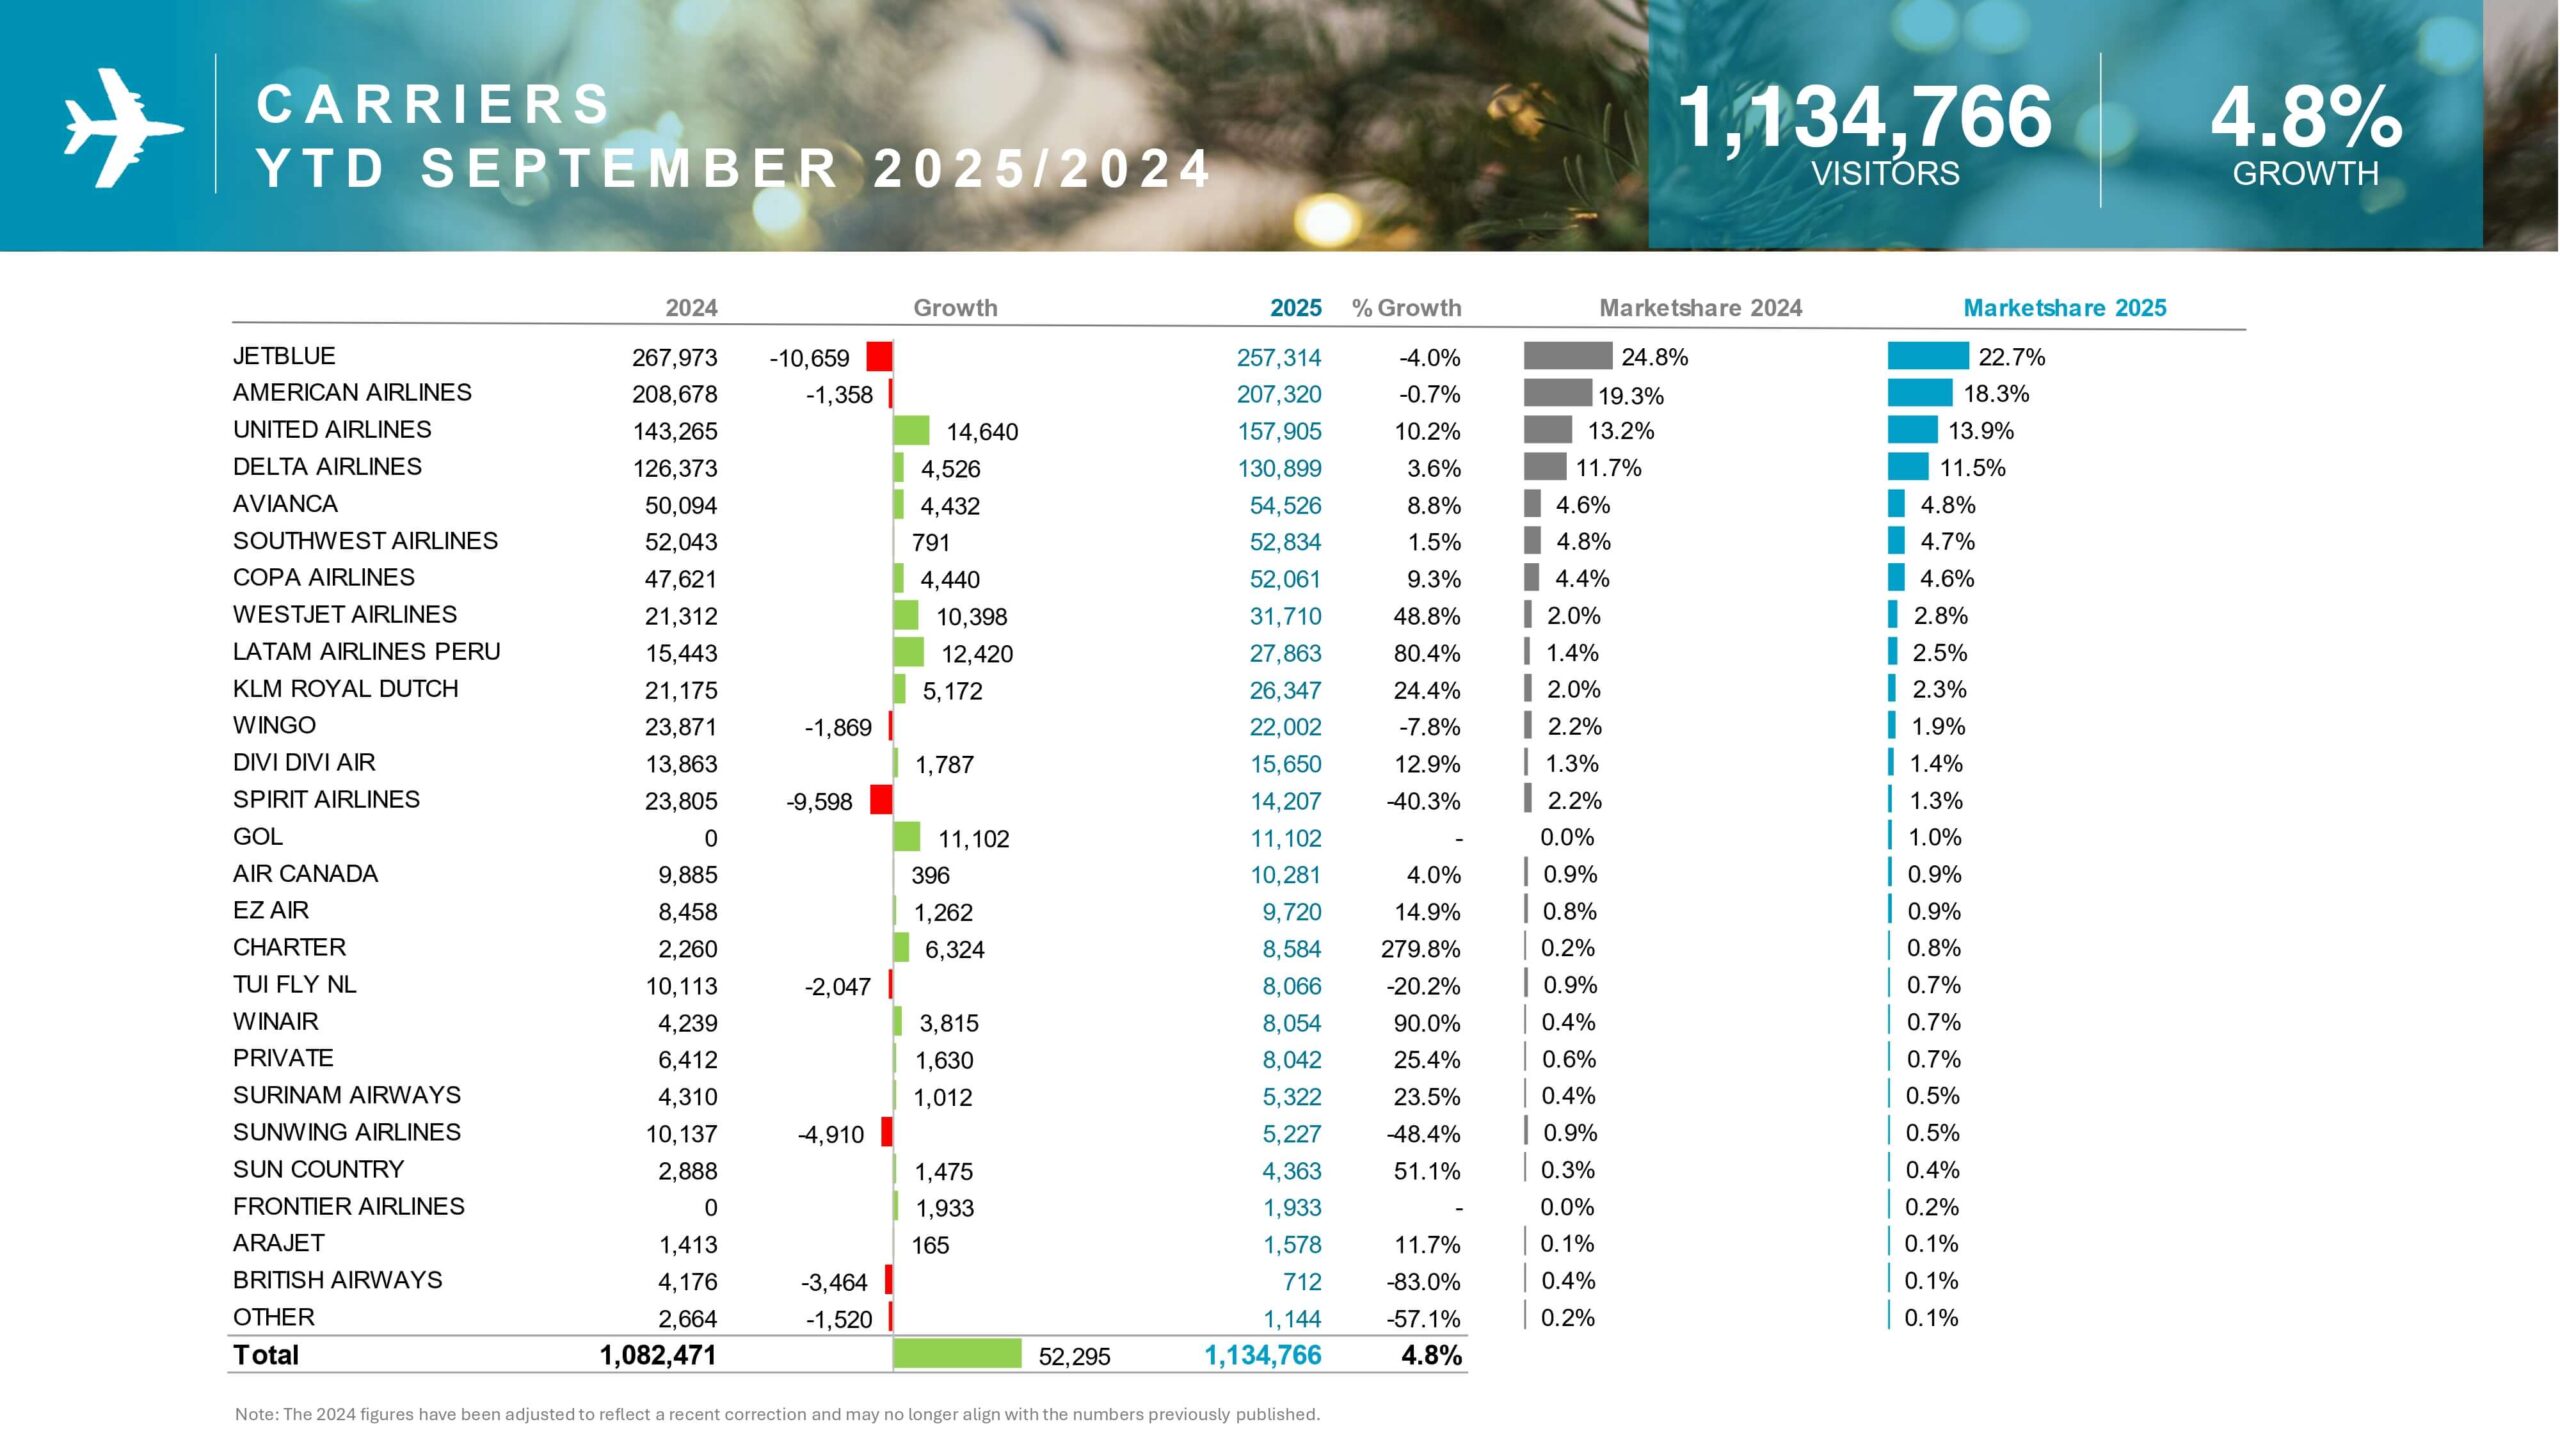
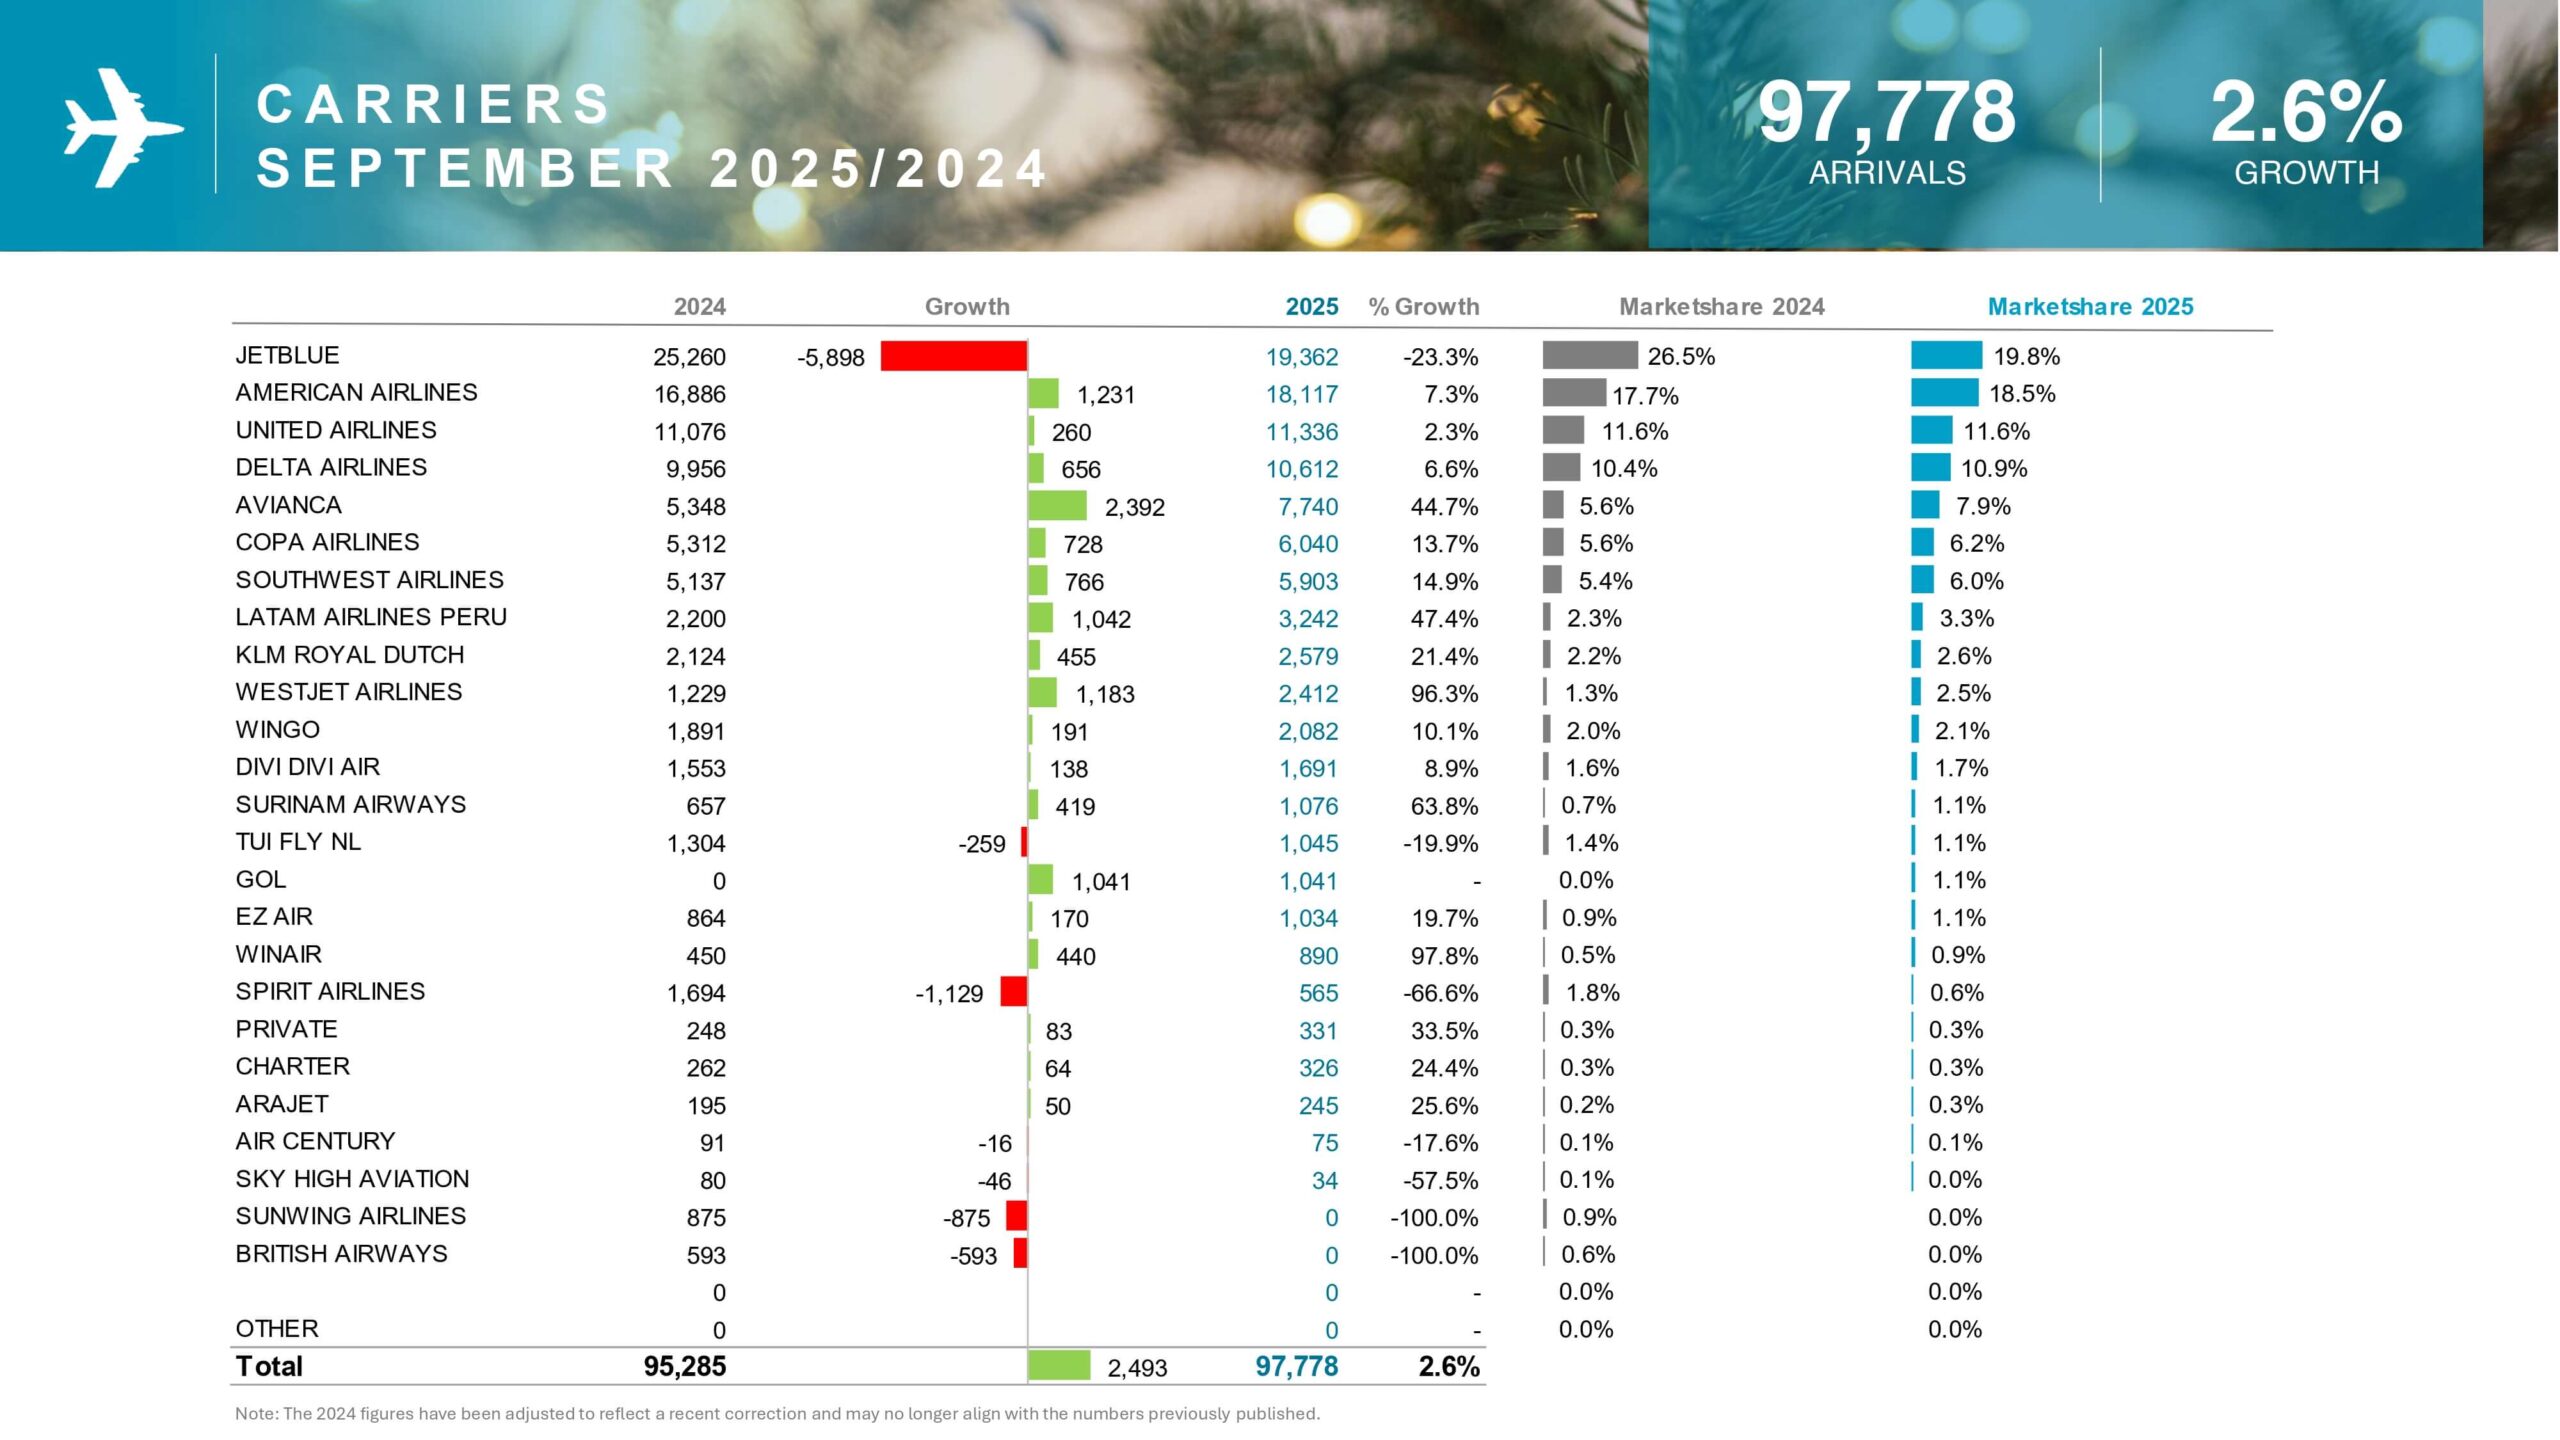
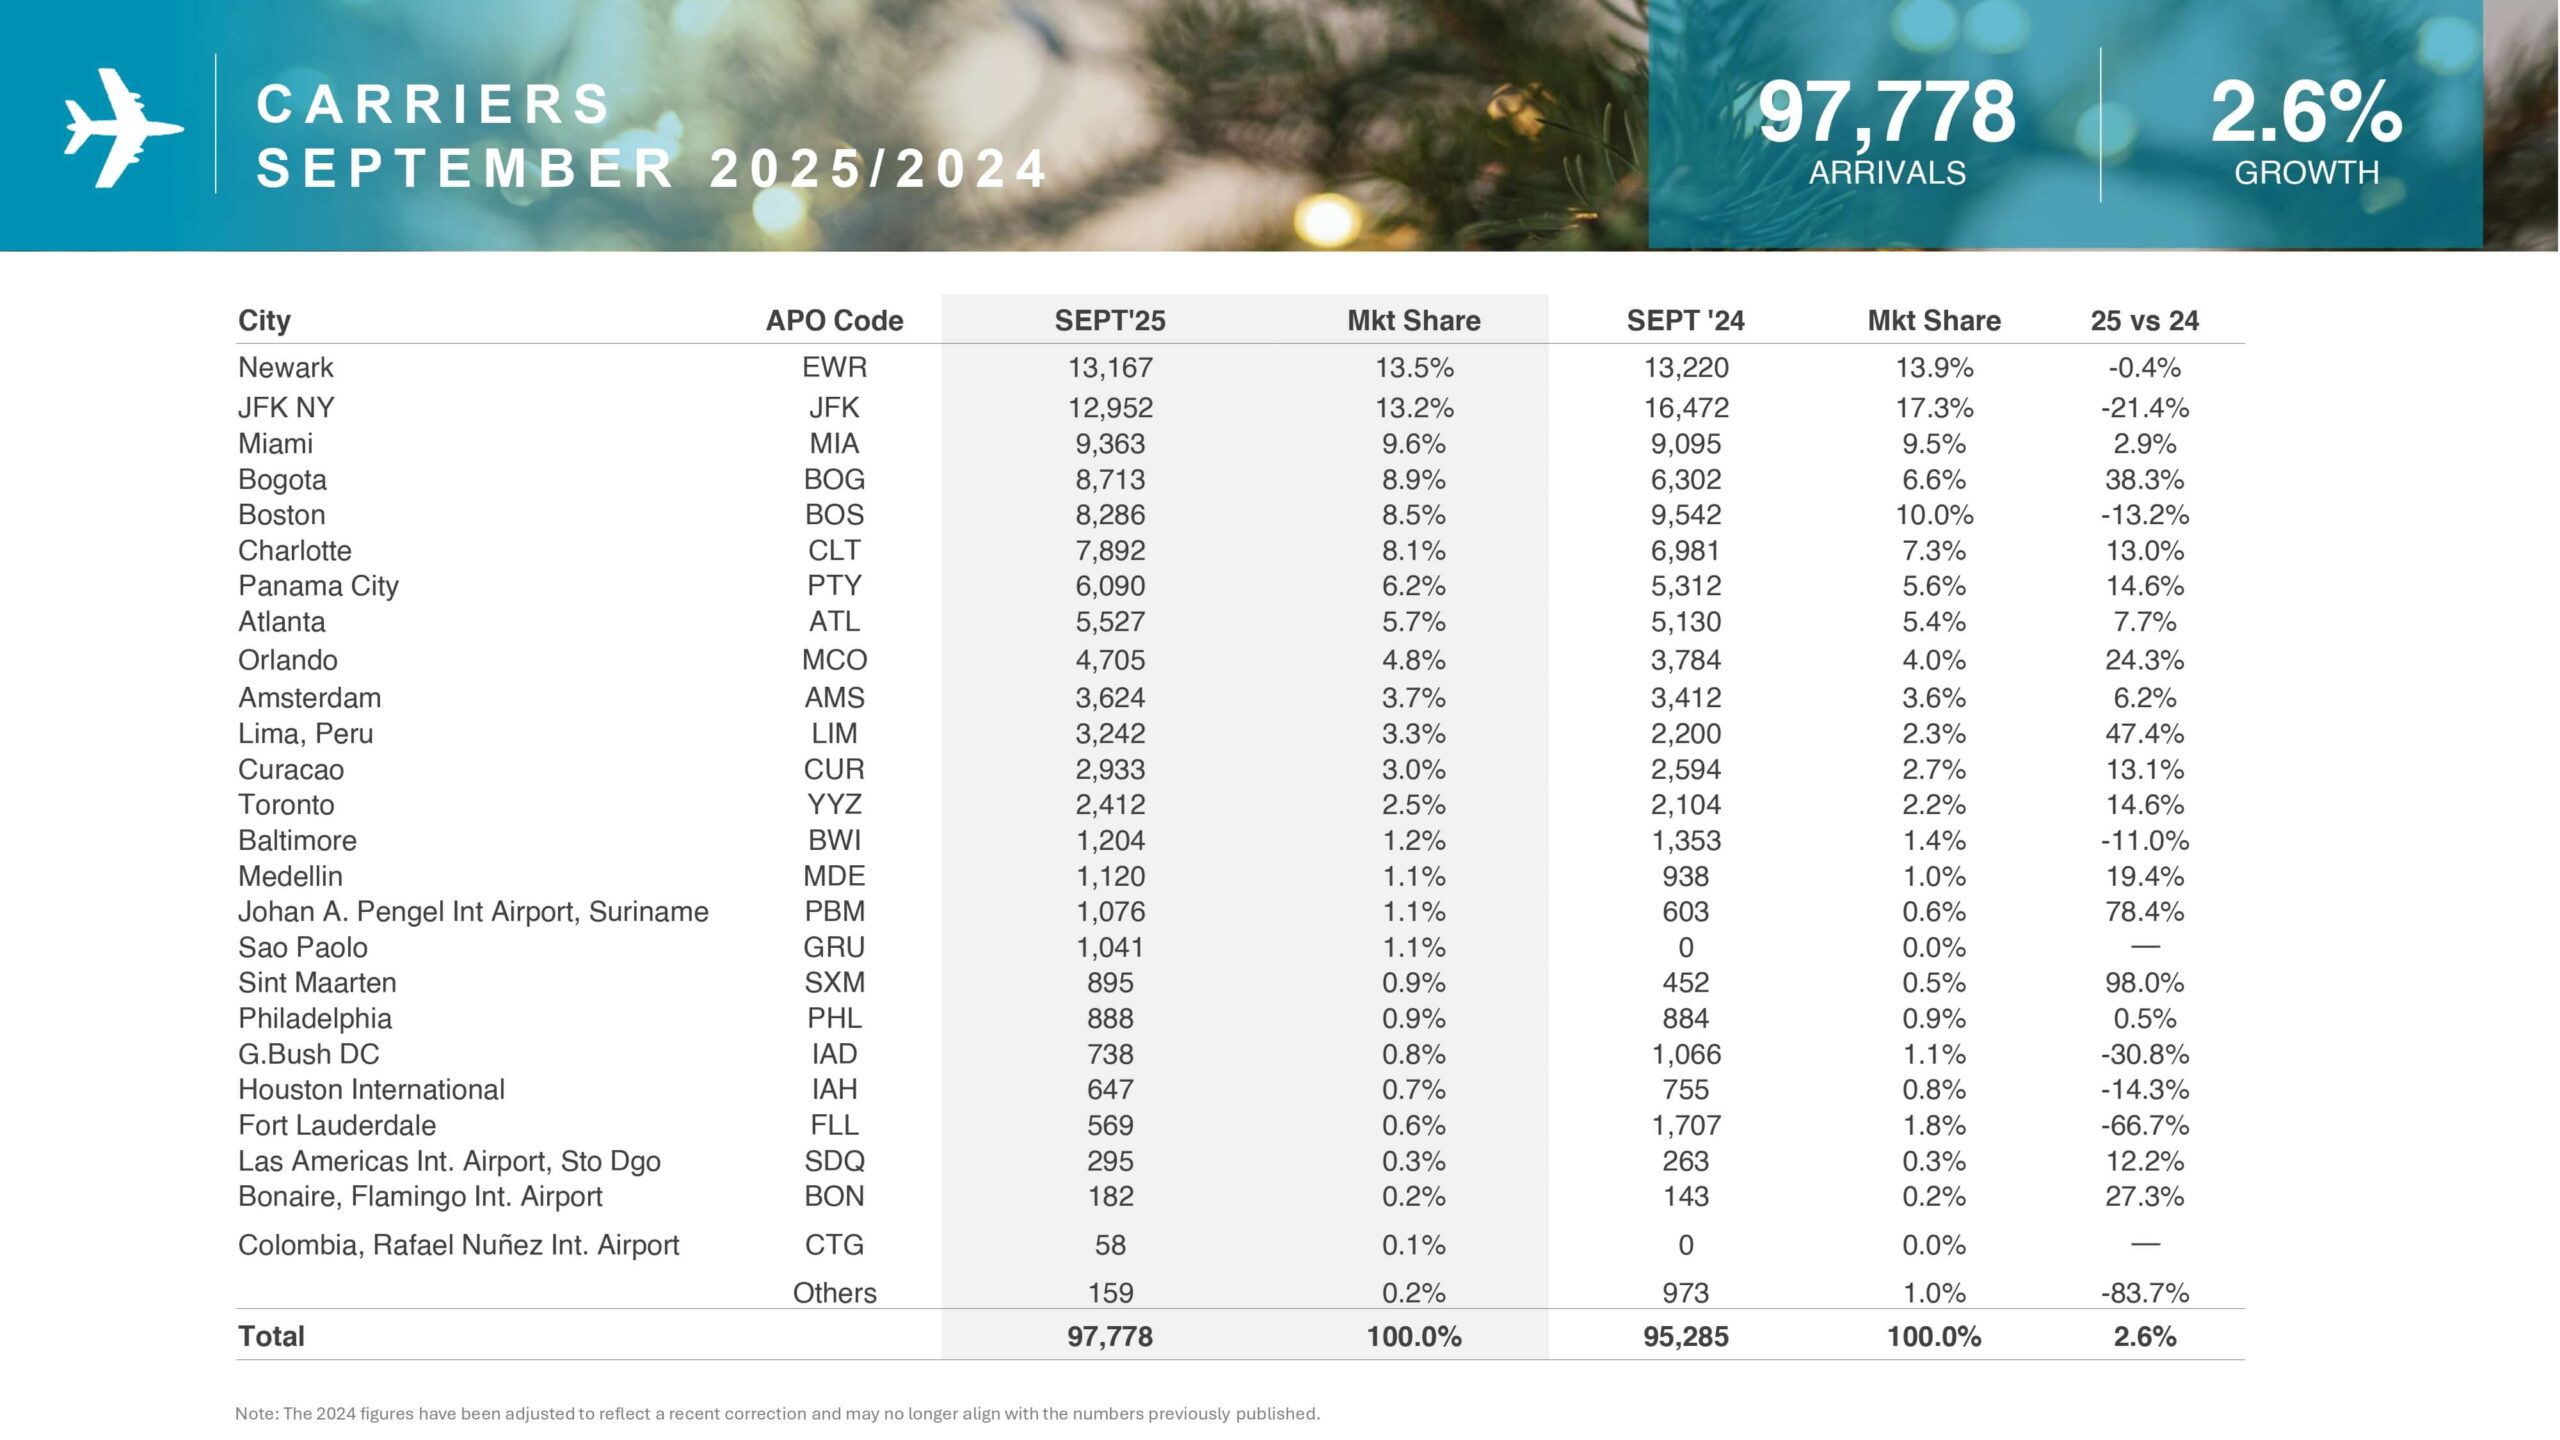
Specifically, North America faced a significant downturn in September. The region’s arrivals collectively declined by 4.6%. USA arrivals alone fell by a noticeable 5.4% monthly. This decrease totaled 3,721 fewer American visitors. Furthermore, flights from Boston and New York suffered. JetBlue traffic experienced a decline compared to September 2024. Market experts must investigate the root causes of this monthly dip.
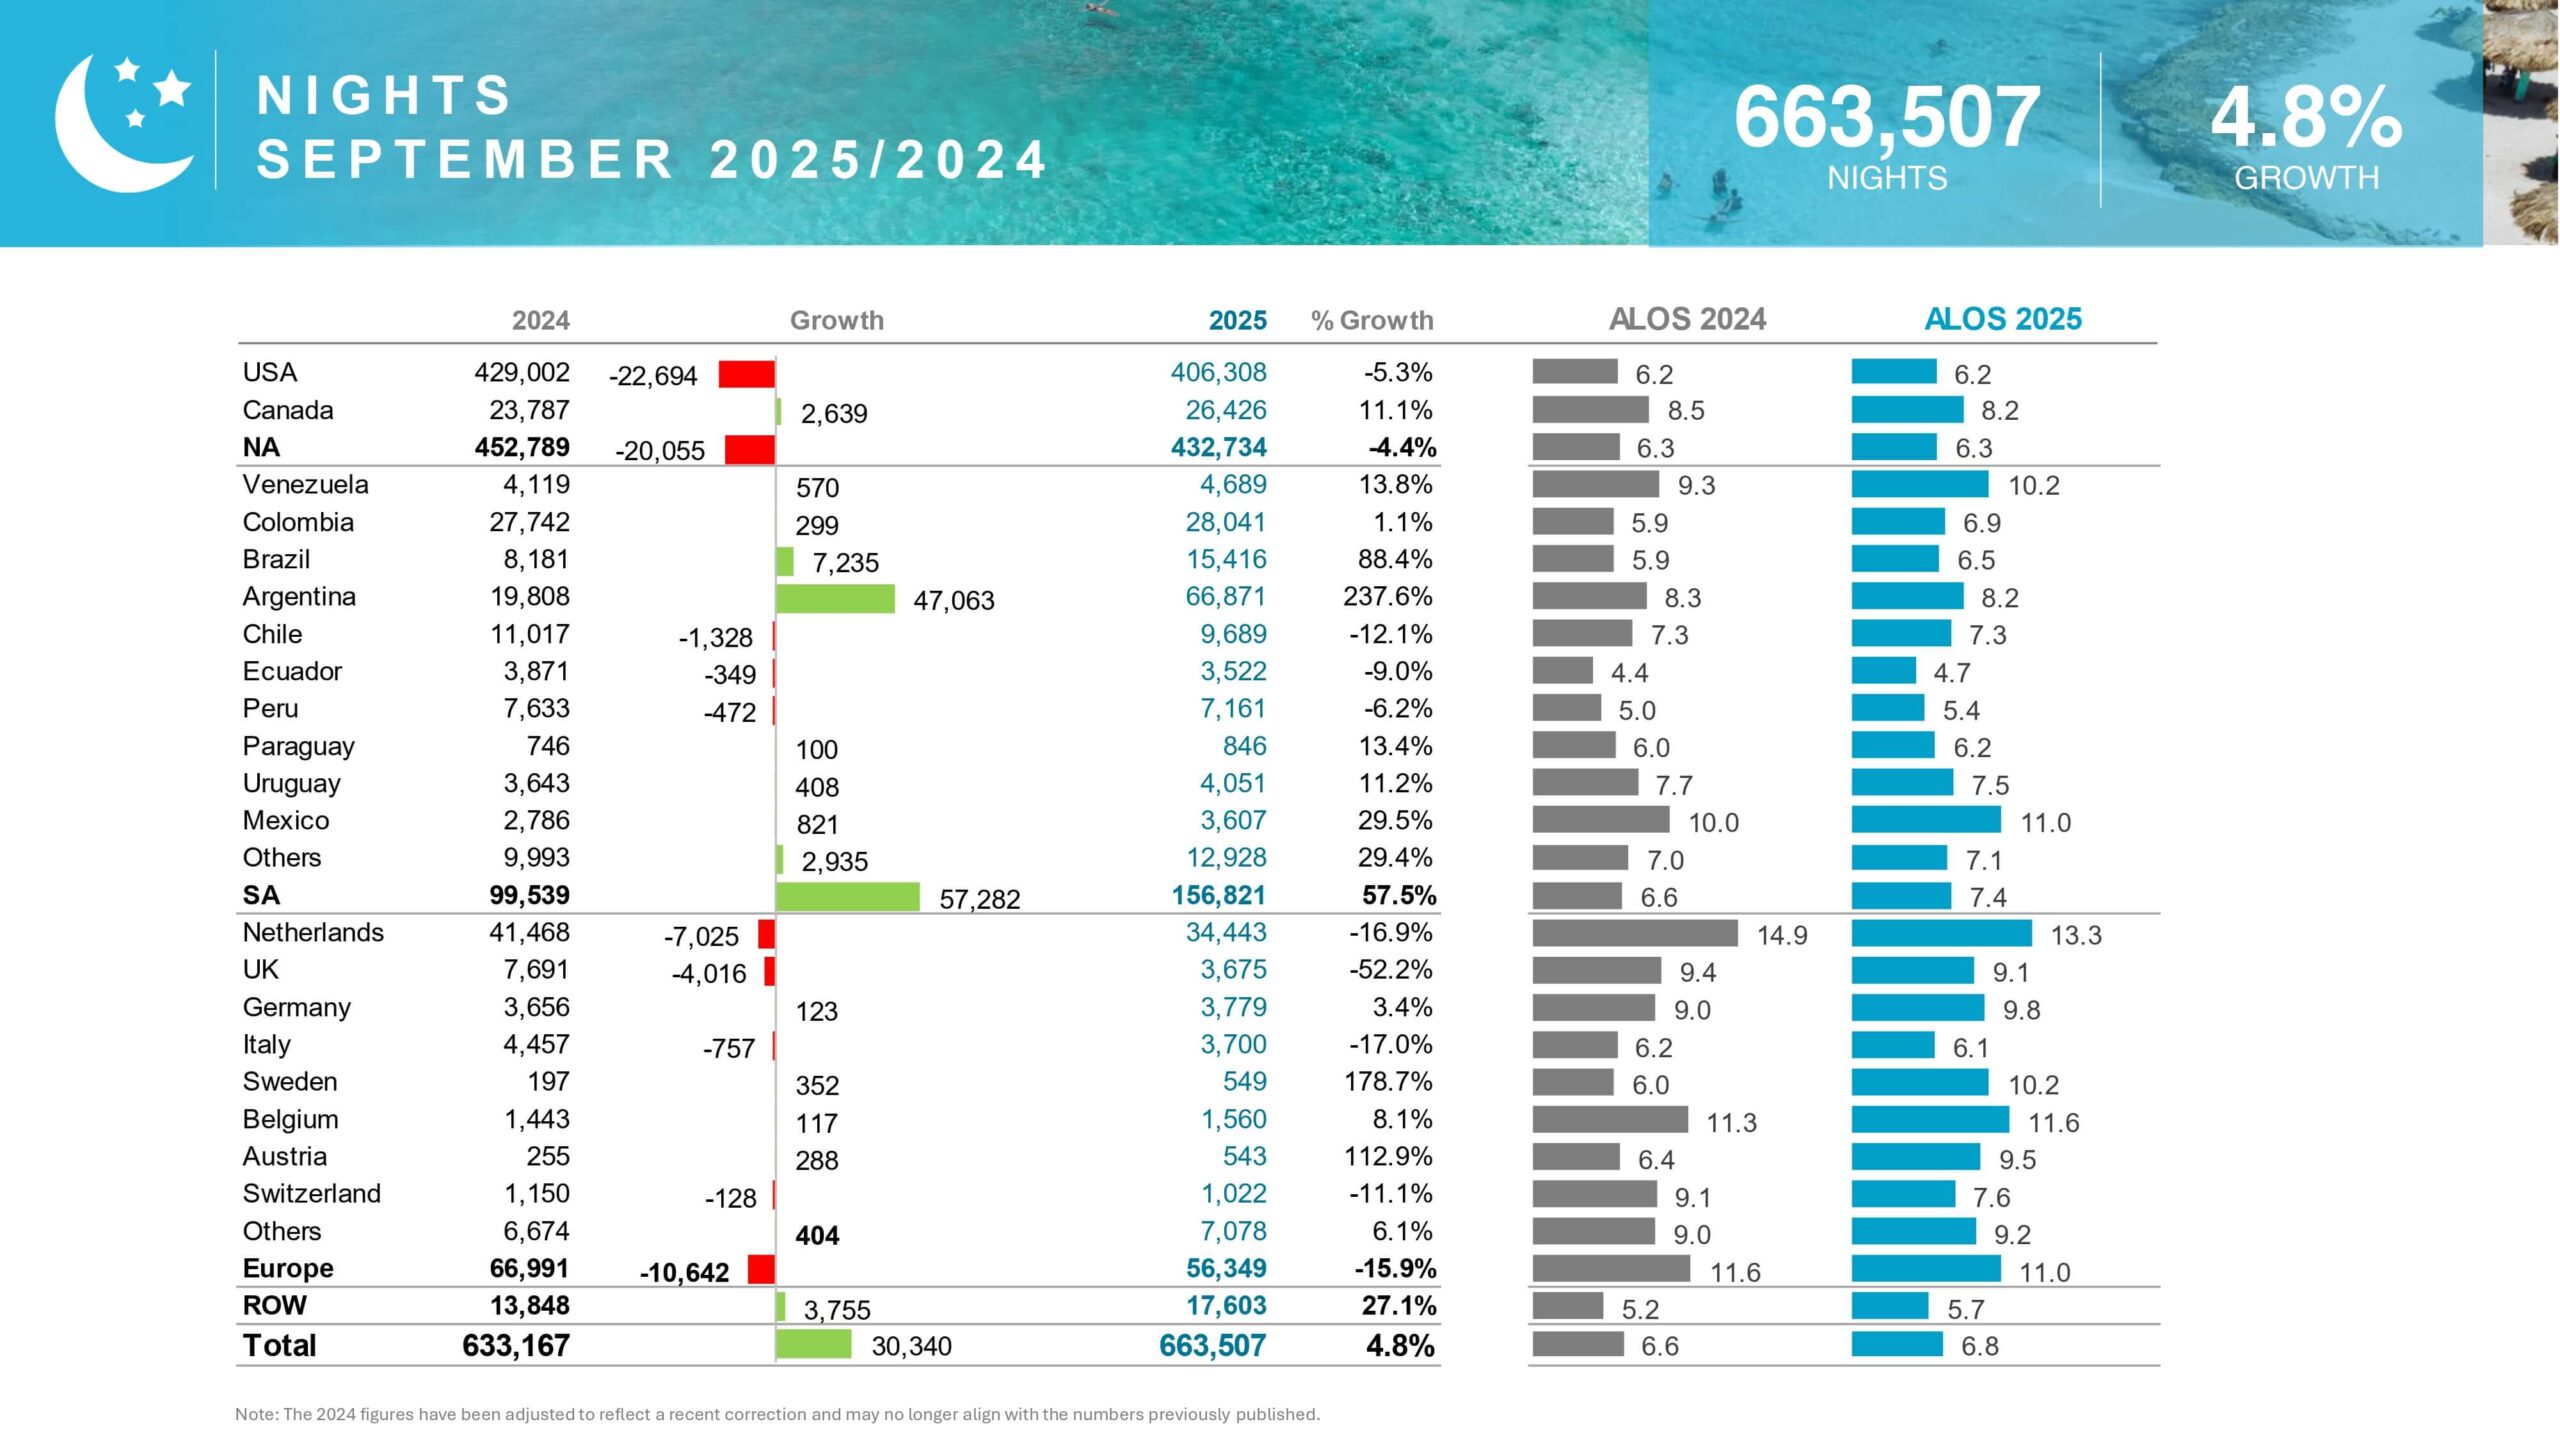
Conversely, South America provided massive momentum. The South American market jumped by a staggering 40.1% in September. Argentinean arrivals grew by an astounding 239.6% monthly. This one market added 5,729 new visitors. Brazil also experienced a massive 72.8% increase in visitors. Indeed, this significant performance cushioned the North American dip. South America is clearly becoming a reliable shoulder season contributor.
European markets also saw a collective decline of 11.5%. The United Kingdom’s arrivals dropped by over 50%. Clearly, seasonal travel patterns influence these numbers greatly. The island must adapt its strategy to these distinct shifts. Therefore, maintaining strong European ties is vital despite these fluctuations. The success of the South American market showcases effective diversification. The island achieved this robust performance through dynamic shifts.
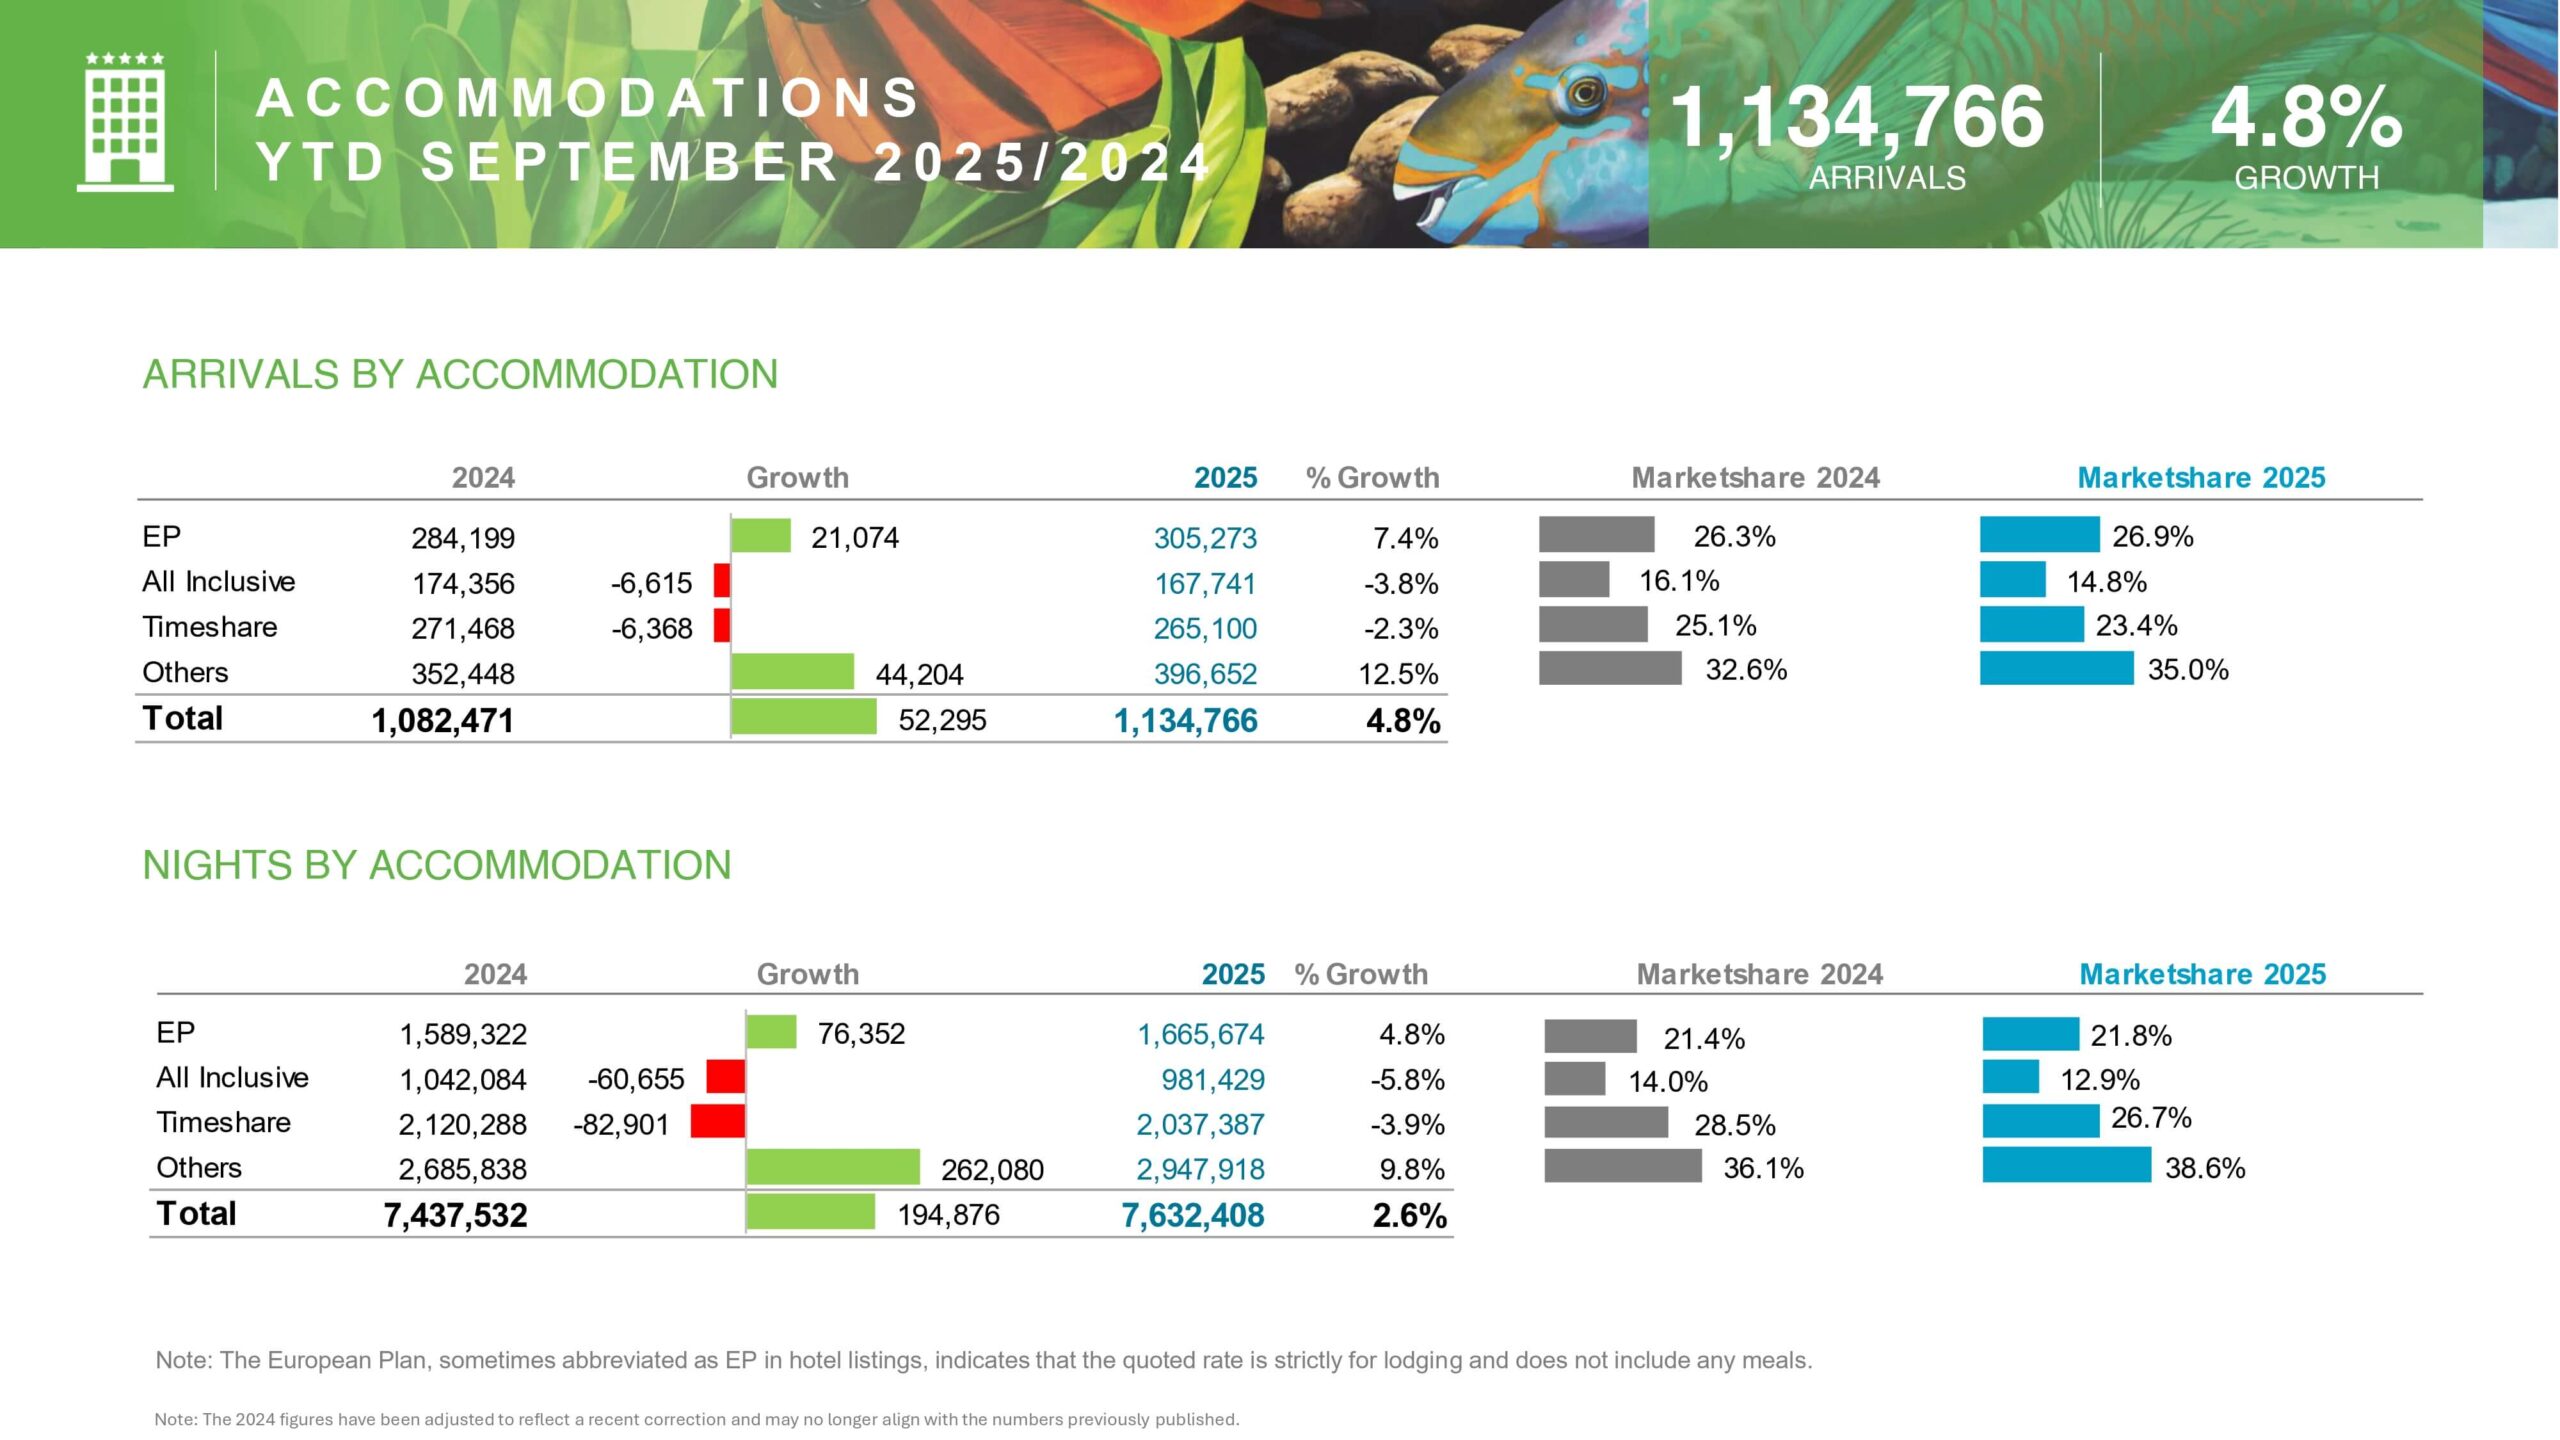
Accommodation Performance: Hotels Versus Rentals
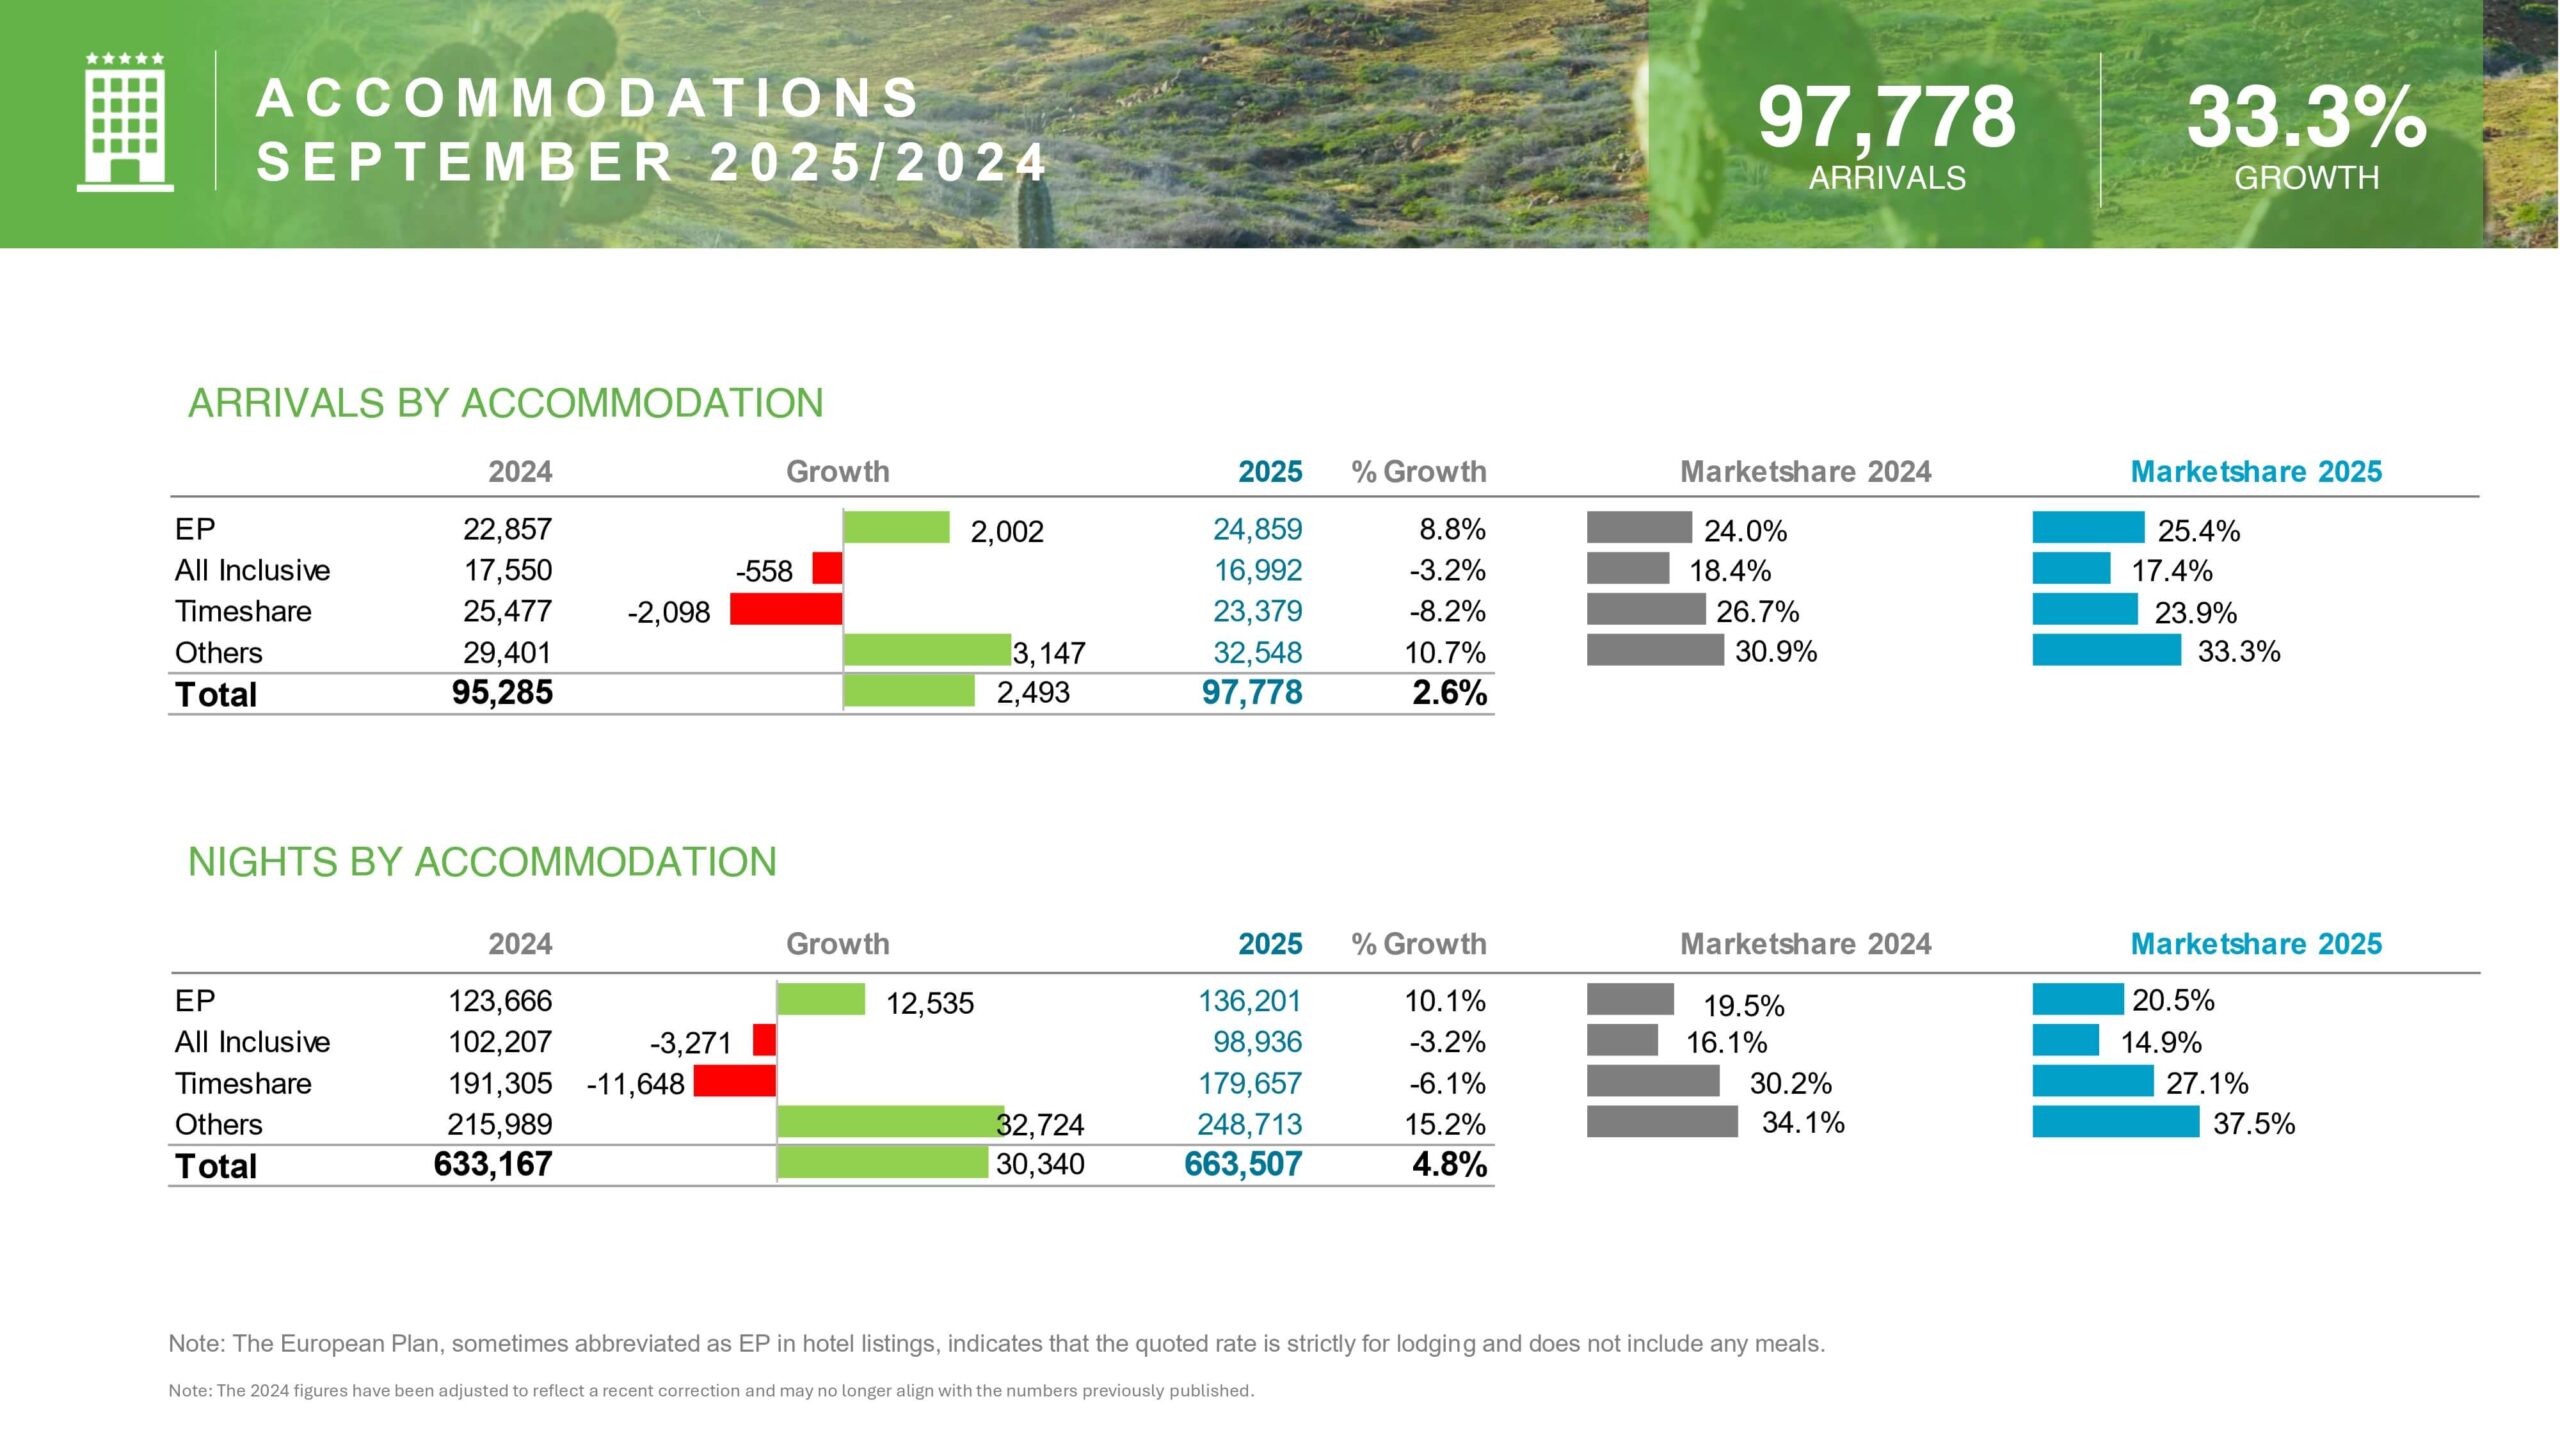
We must closely examine the visitor night data. YTD hotel visitor nights remained almost completely flat. They only increased by a meager 0.01% through September. This includes both European Plan (EP) and All-Inclusive (AI) properties. In contrast, “other” accommodations grew significantly. This non-hotel sector, largely vacation rentals, surged by an impressive 9.8%. This growth shows shifting consumer preferences. Visitors increasingly favor alternative lodging choices.


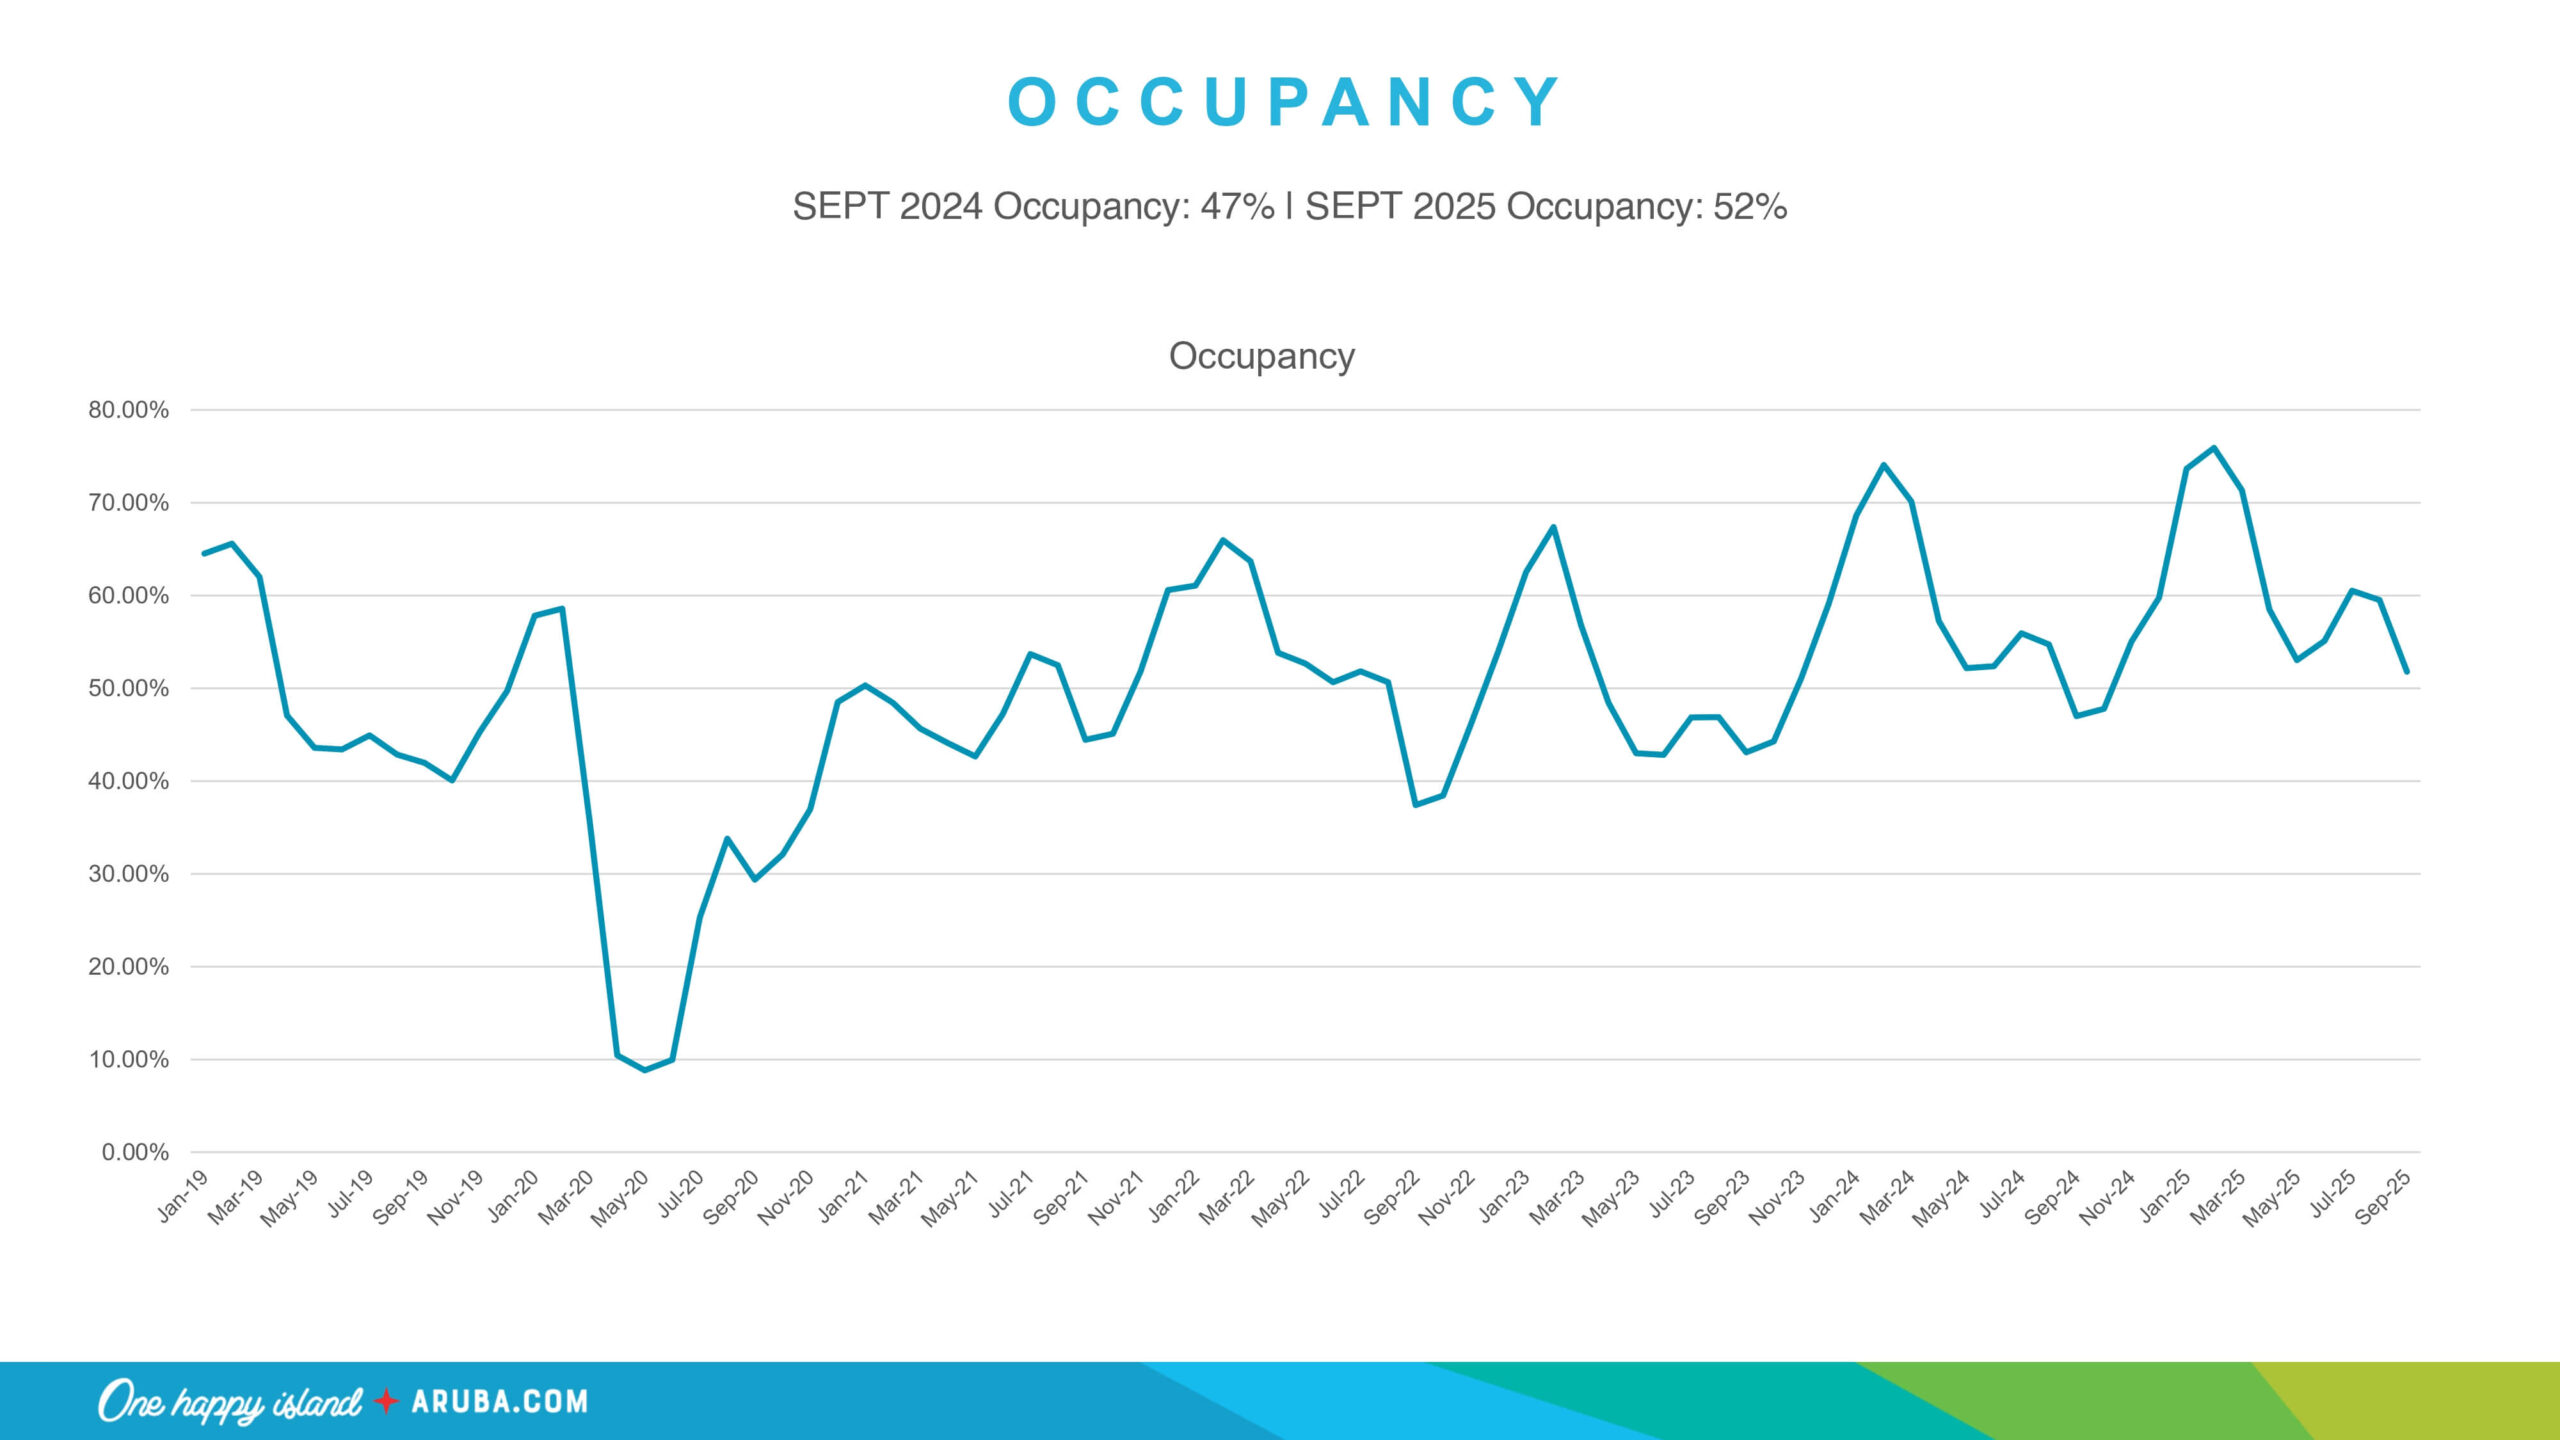
The increase in new hotel rooms is a key factor. More available inventory shares the same number of guests. Consequently, the Average Occupancy Rate (AOR) decreased. The strategy targets quality, not maximum occupancy. Therefore, the drop in AOR is a byproduct of prioritizing value. Traditional hospitality must actively address this trend.

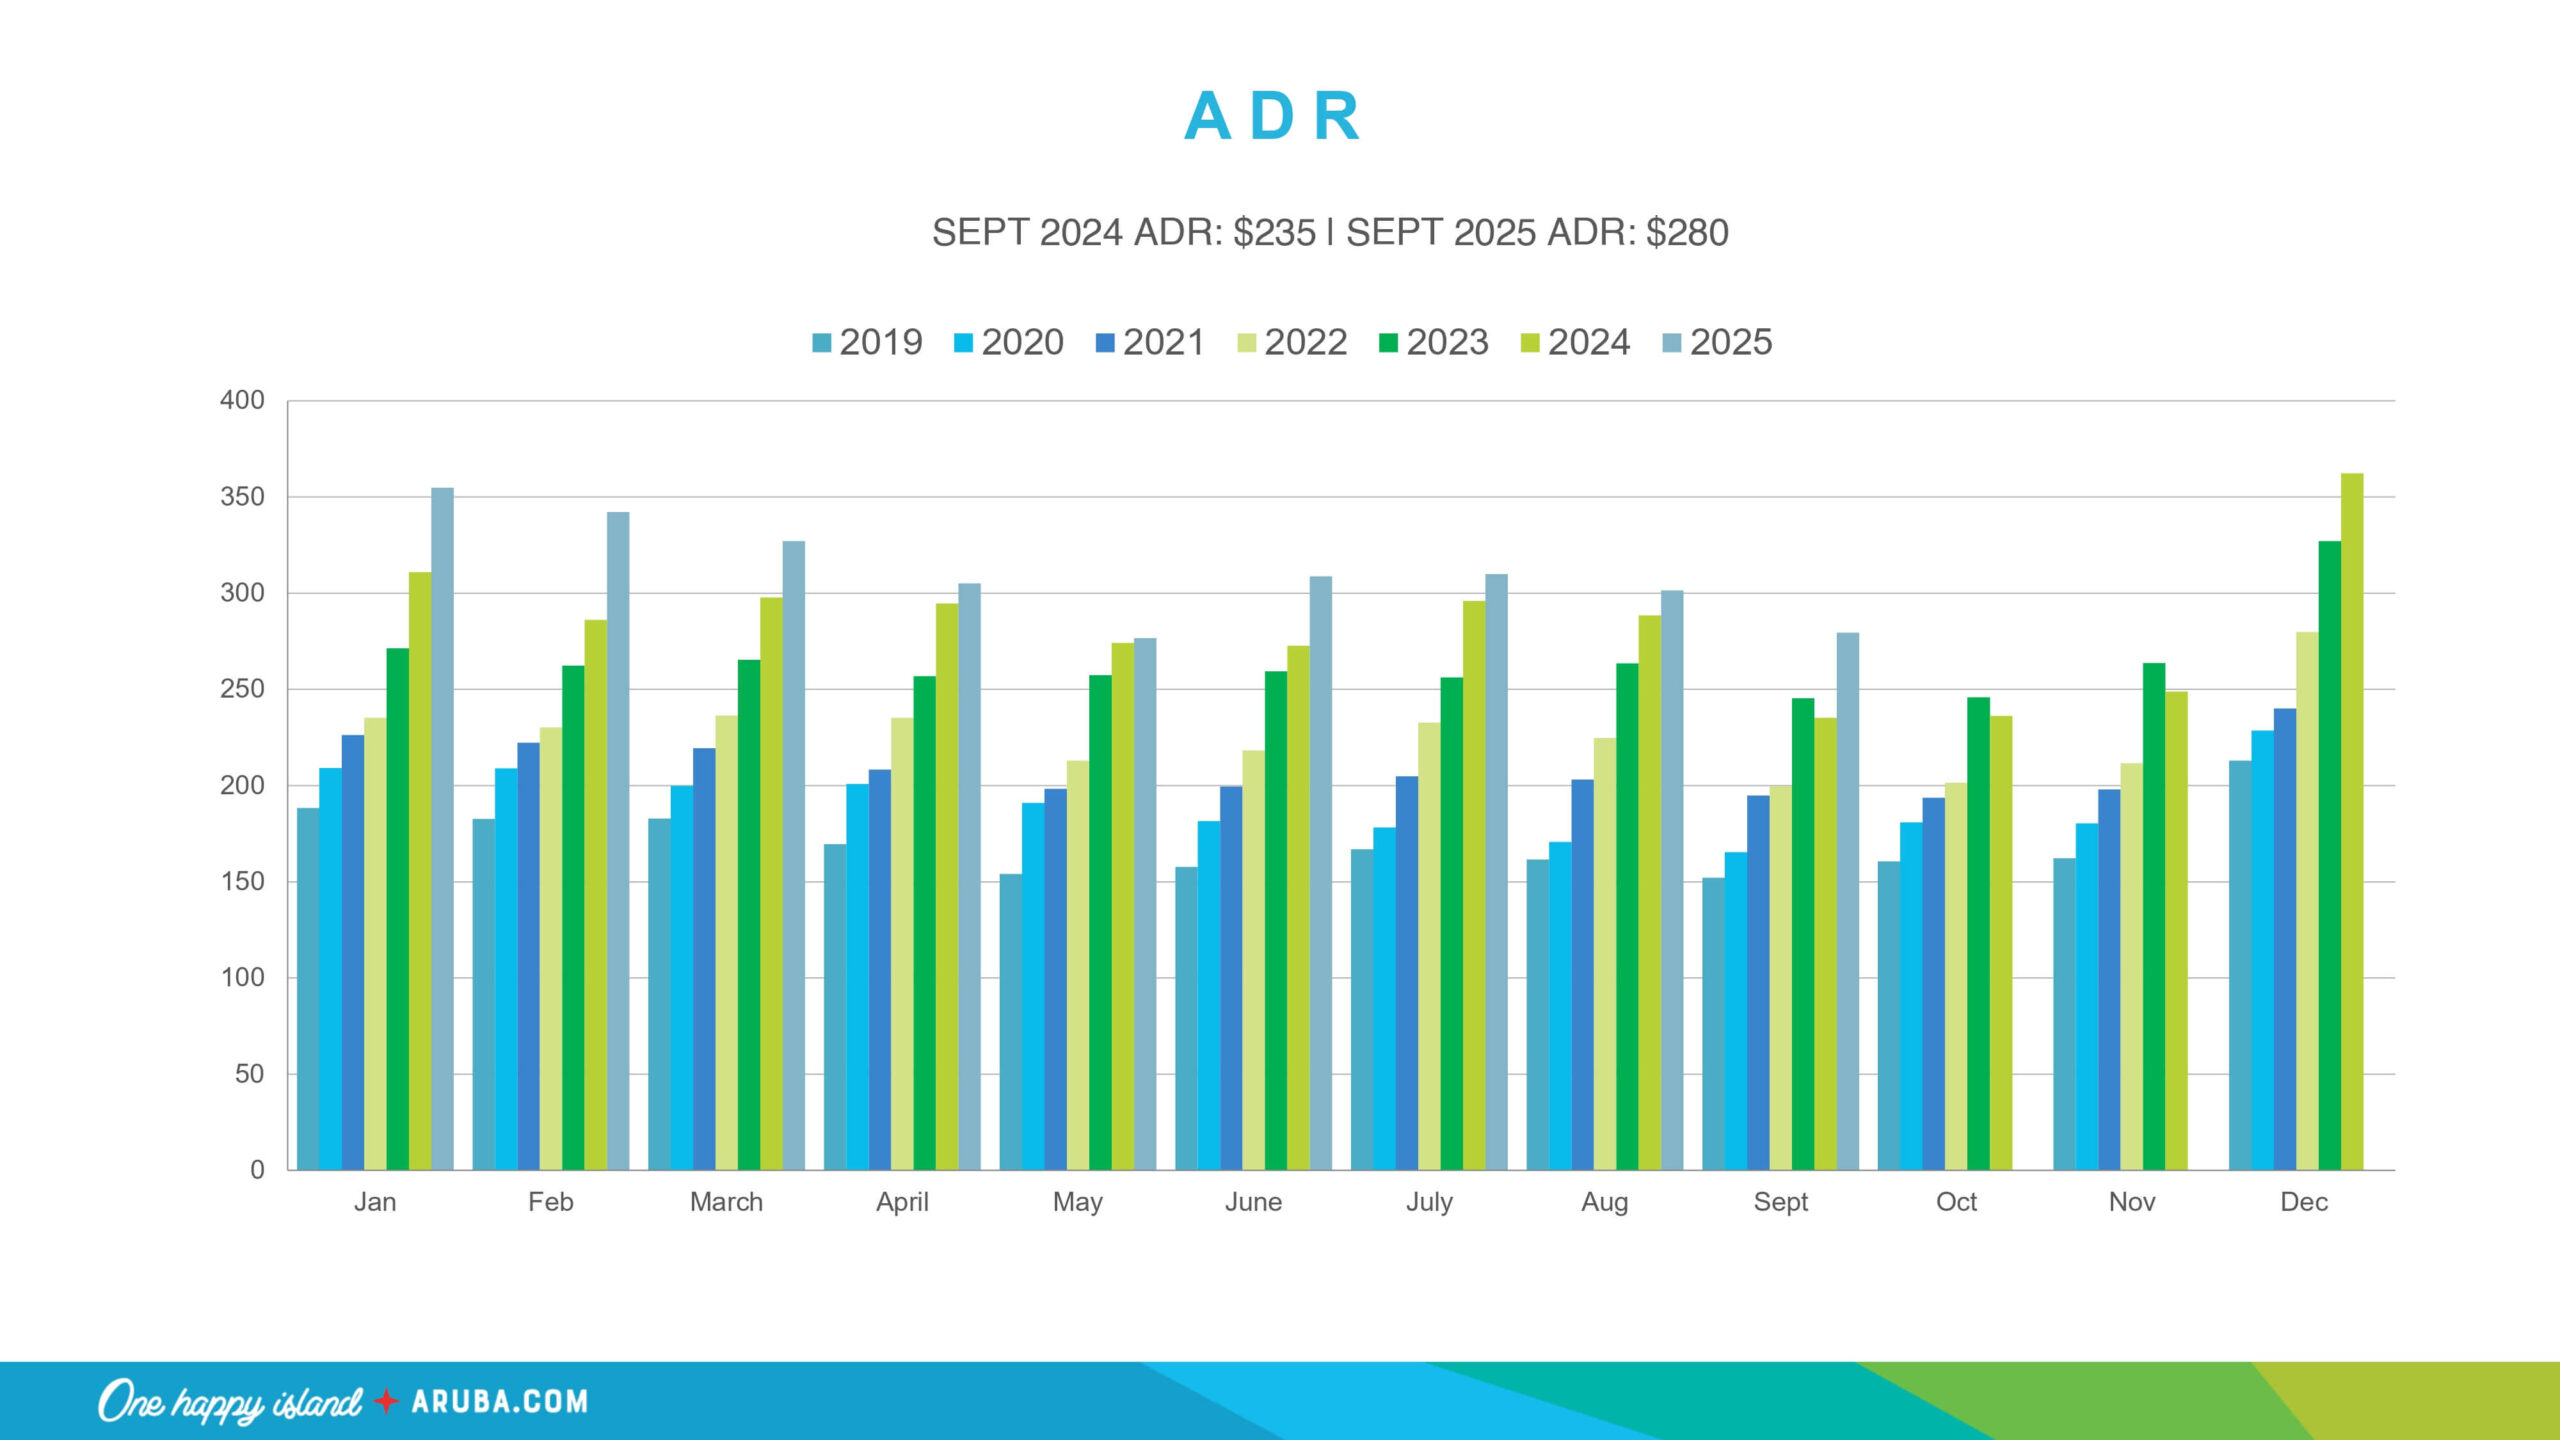

Maximizing Value: The Financial Metrics of Tourism
The Average Daily Rate (ADR) reveals crucial financial insights. Hotels reported a strong ADR of USD 336 in September. Vacation rentals reported an ADR of USD 280. Hence, traditional hotels retain a higher per-night rate. The $56 price difference is noteworthy for market positioning. This metric confirms the premium nature of the hotel product. In addition, it supports the value-based approach. Strong ADRs ensure healthy revenue streams for the island. The focus is always on high-yield tourism. This focus guides the entire Aruba travel data strategy. We must always protect the island’s price integrity. .
Cruise Sector Achieves Massive September Gains
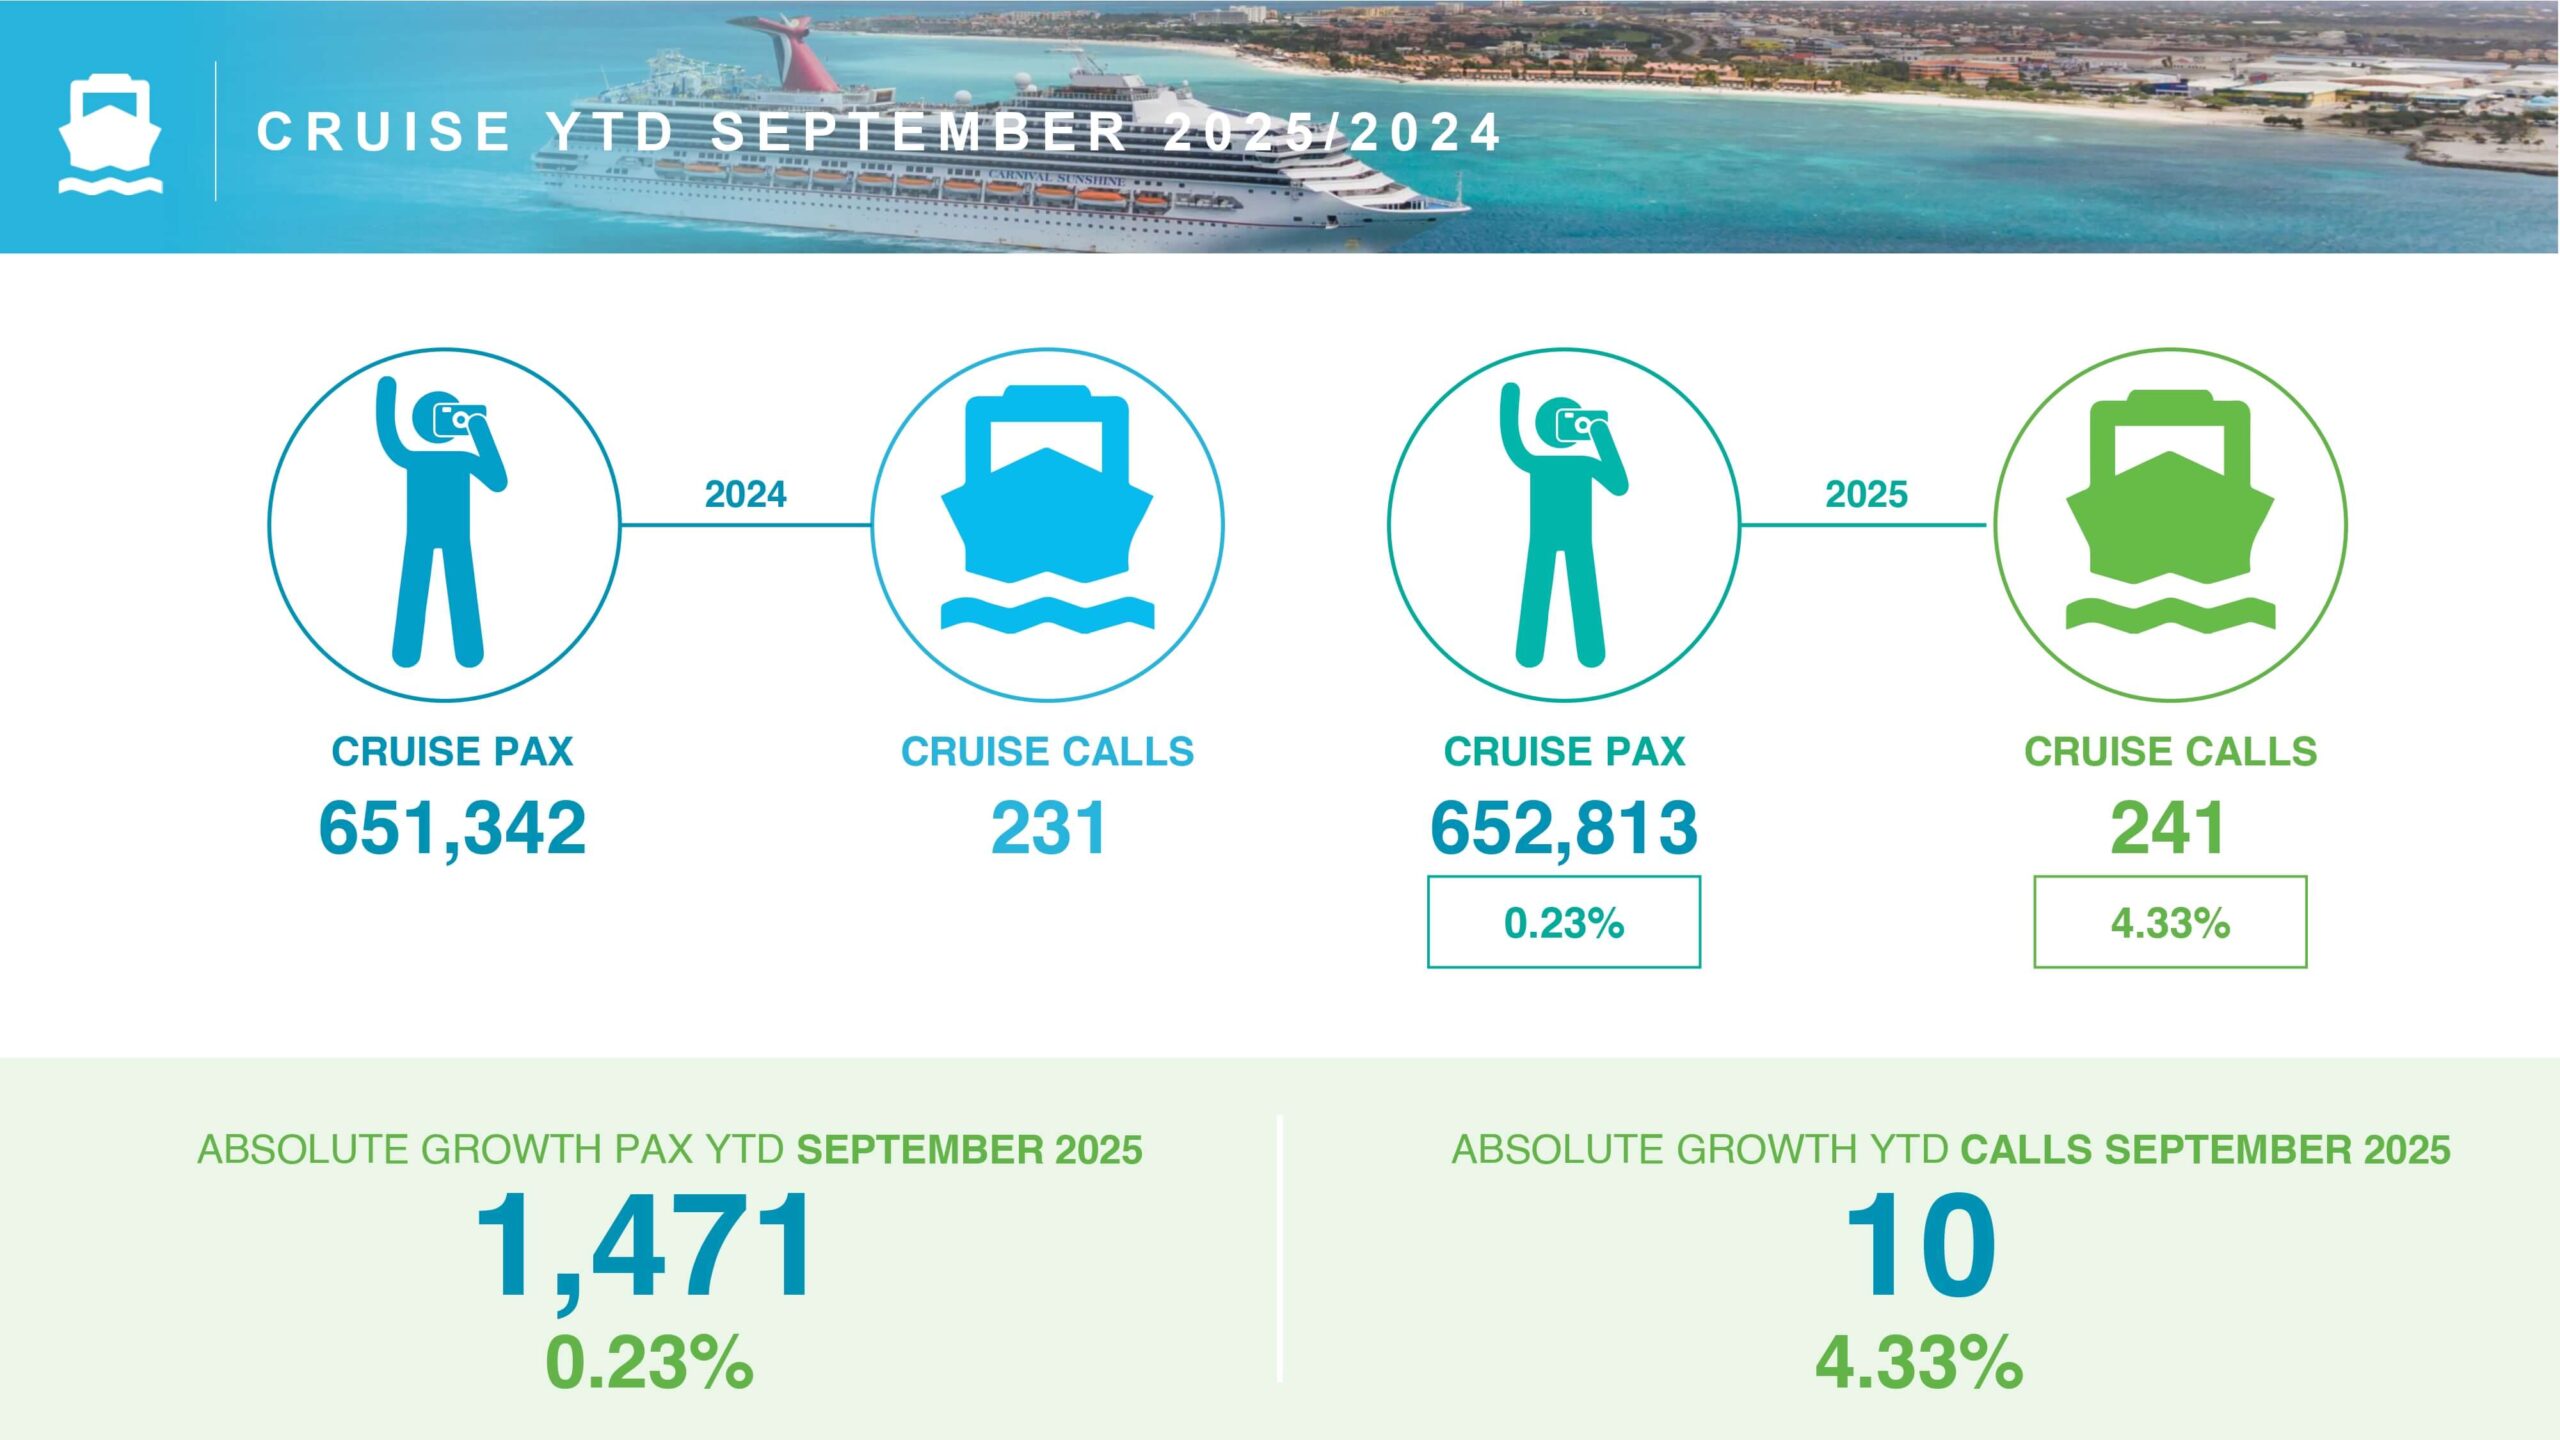
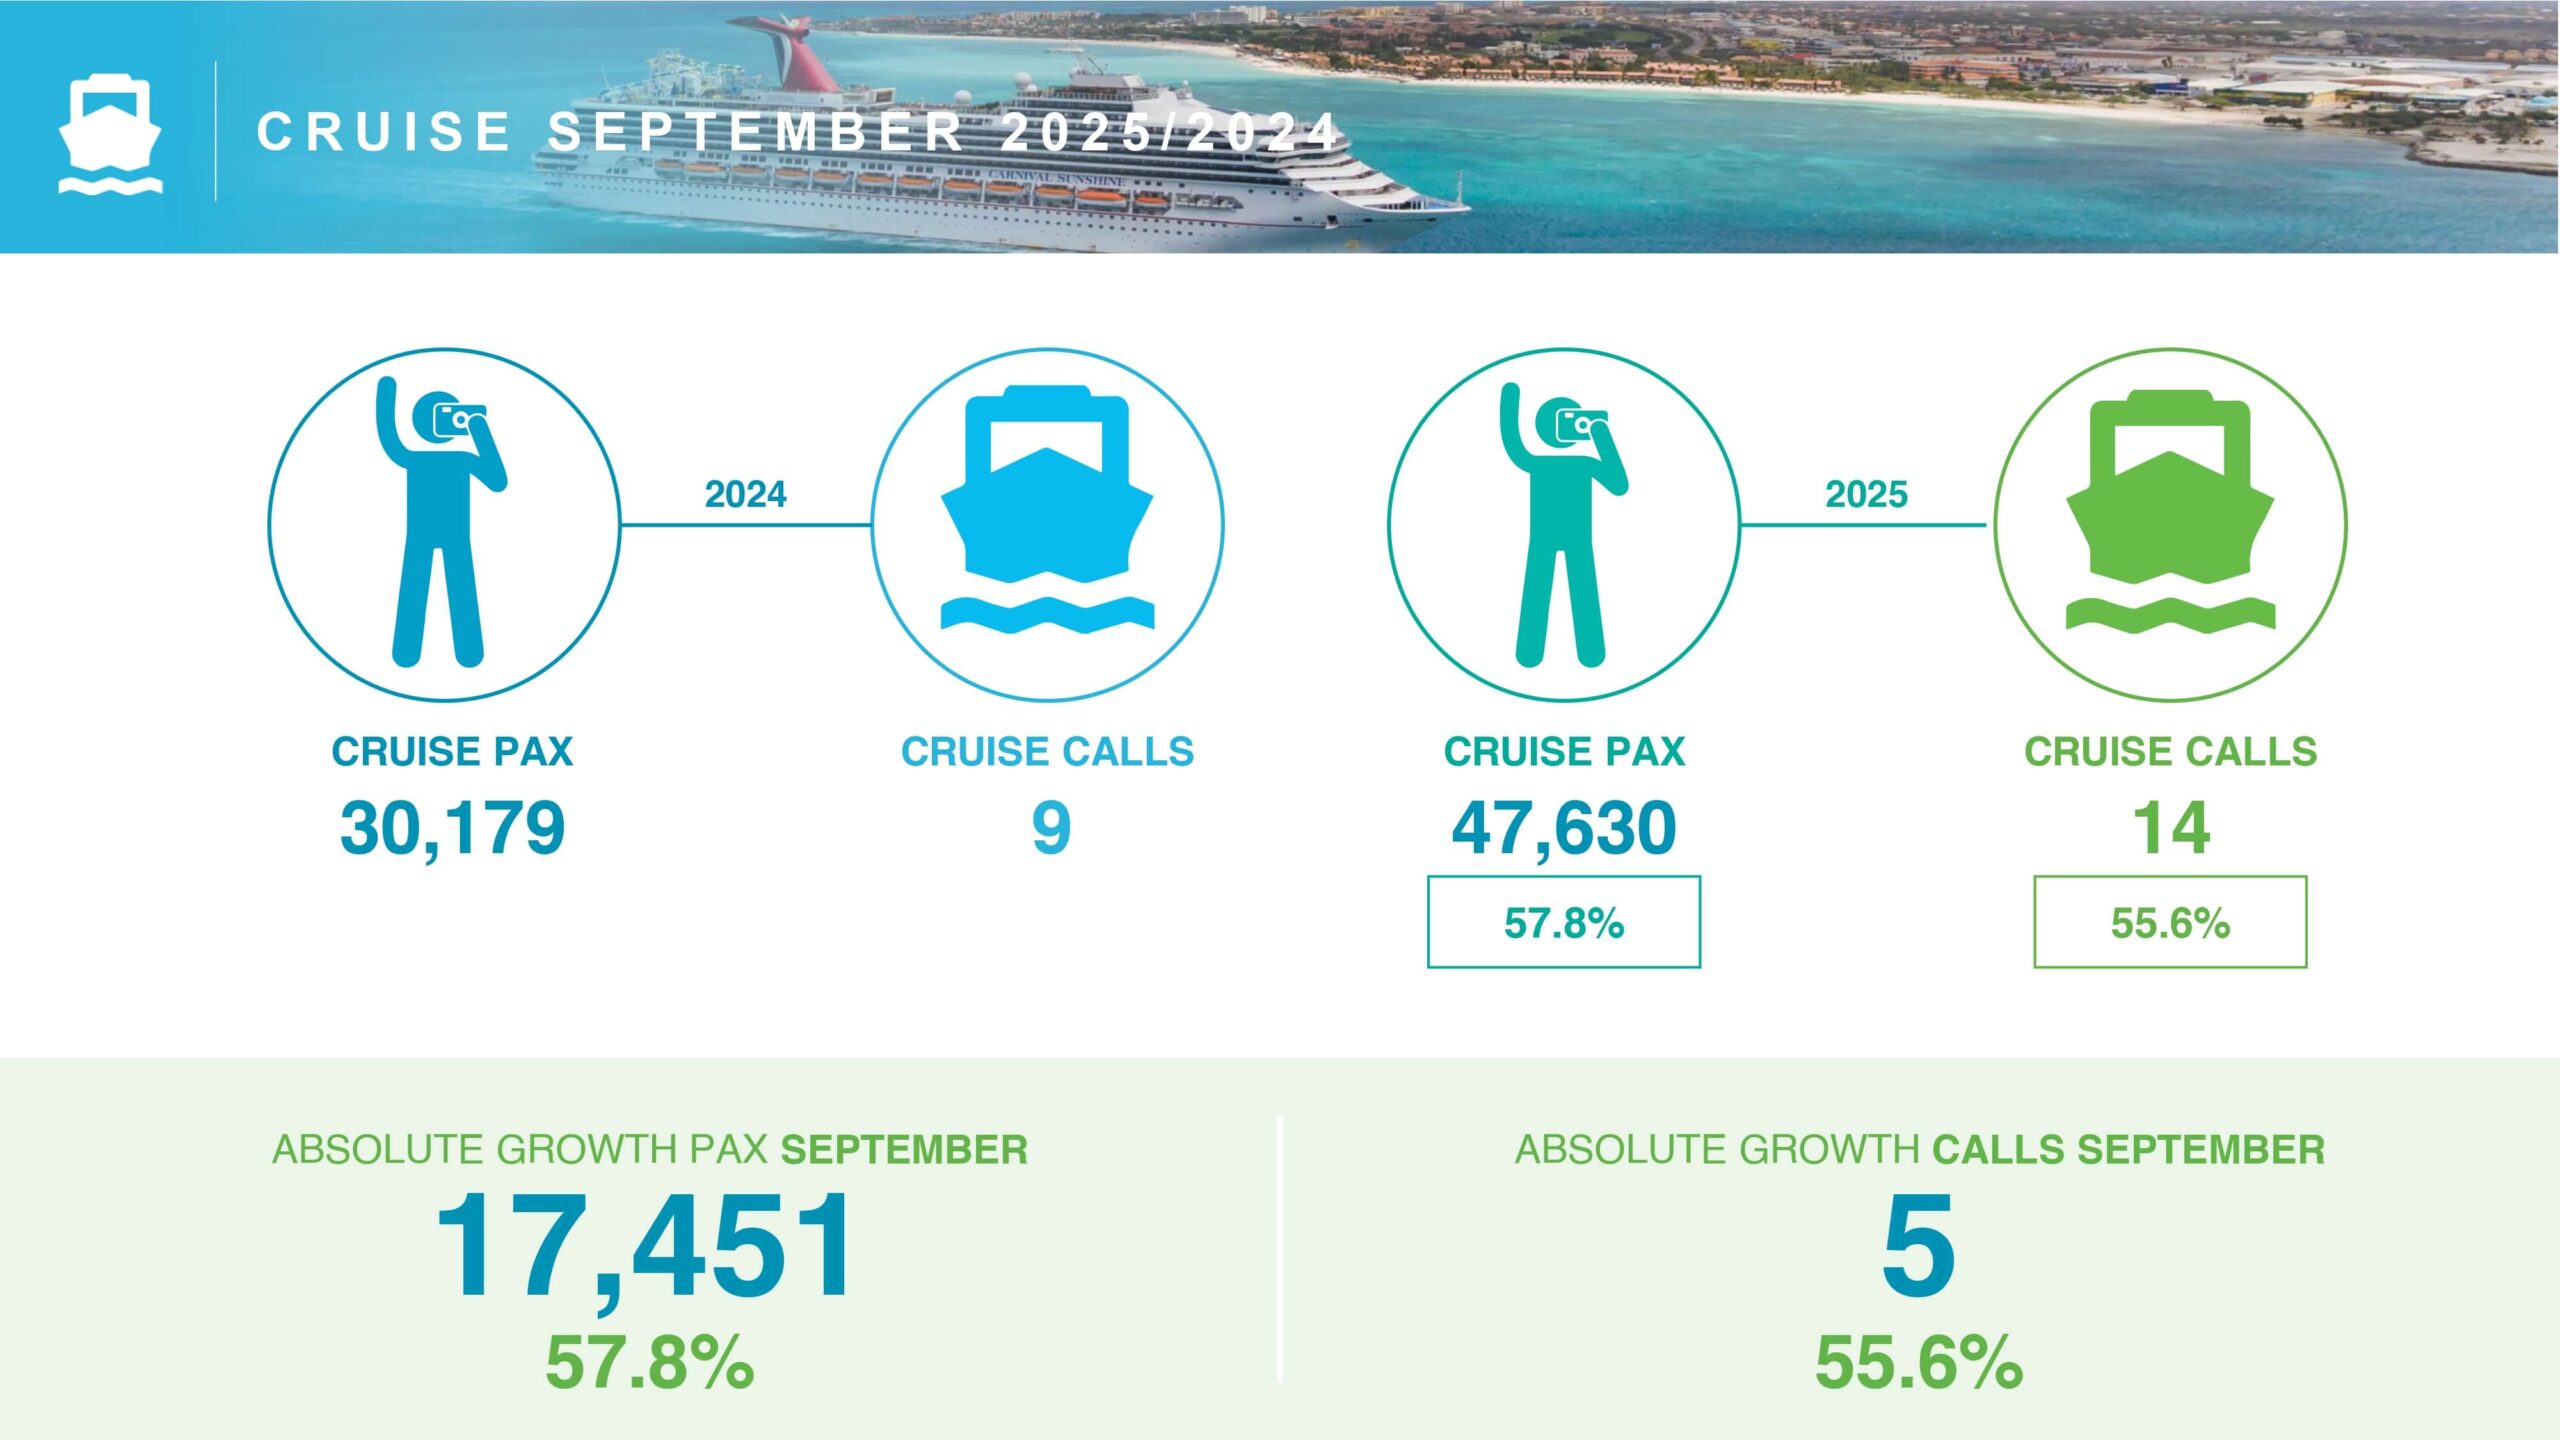
The cruise sector delivered phenomenal September results. Aruba welcomed 47,630 cruise visitors. Specifically, this marks a strong 57.8% increase over September 2024. Last year saw only 30,179 visitors. In addition, ship calls increased significantly. The port hosted 14 calls, up from 9 last year. Ultimately, this shows renewed confidence in cruise travel. The increased activity benefits local port operators greatly. This also boosts spending in local shops and tours. Furthermore, a strong cruise sector complements the stay-over segment. The island offers an exceptional port experience. .


Economic Impact: Understanding Tourism Credits
The Central Bank of Aruba (CBA) provides essential economic context. The CBA now reports ‘Tourism Credits’ instead of ‘Tourism Receipts’. This crucial reclassification includes timeshare maintenance fees. The fees were previously classified as “Other Services.” Consequently, the total reported tourism value is higher. This updated reporting provides a clearer financial picture.
Q1 2025 Tourism Credits increased by 2.4%. Total credits reached Afl. 1,624.50 million. Therefore, tourism firmly supports Aruba’s national economy. This consistent growth demonstrates Aruba tourism statistics strength. Above all, the reclassification allows for more precise economic analysis. We now better understand the full financial scope of tourism. This ensures policymakers make data-driven decisions. The government uses these metrics for national planning.
Conclusion: Sustaining the Momentum of Aruba Tourism Growth 2025
The 2025 data paints a complex yet positive picture. Overall arrivals show steady growth and resilience. Specifically, the total YTD arrival growth reached 4.8%. The strategic shift to “value over volume” is essential. Growth in spending must consistently exceed volume gains. South America’s market emergence is a major success story. Furthermore, the incredible gains offset North American and European dips. The island maintains a powerful position in the Caribbean.
The flat hotel visitor nights are a challenge for traditional hospitality. They must address the increased room inventory effectively. In contrast, vacation rentals show rising popularity. They capture a growing portion of the visitor nights. This trend requires proactive management and regulation. Indeed, every sector contributes to the island’s prosperity. Policymakers will use this report for future campaigns. They will continue promoting Aruba’s unique offerings. Hence, the future of Aruba tourism growth 2025 looks bright. We actively look forward to continued growth and prosperity. The Aruba Tourism Authority (ATA) actively monitors these essential trends.
For more updates on local events, follow us on social media or send your news to info@arubaonline.news.