Aruba’s Tourism Growth: August 2024 Analysis
In August 2024, Aruba saw a substantial growth in its tourism sector. The Aruba Tourism August 2024 report reveals a remarkable 17.5% increase in overall visitor arrivals compared to the previous year. This surge, driven by key markets like the USA and Canada, reflects the island’s growing popularity. The data also highlights patterns in accommodation, visitor spending, and the reasons for travel, offering insights into the island’s continued success as a top destination.
Aruba’s Tourism Surge: A Closer Look at August 2024
Aruba’s tourism industry continued to thrive in August 2024, with an impressive 17.5% growth in visitor arrivals compared to the same period in 2023. This growth aligns with global trends as the island remains a sought-after destination for travelers seeking sun, sand, and sea. This report delves into key statistics, including visitor demographics, spending habits, accommodation preferences, and more.
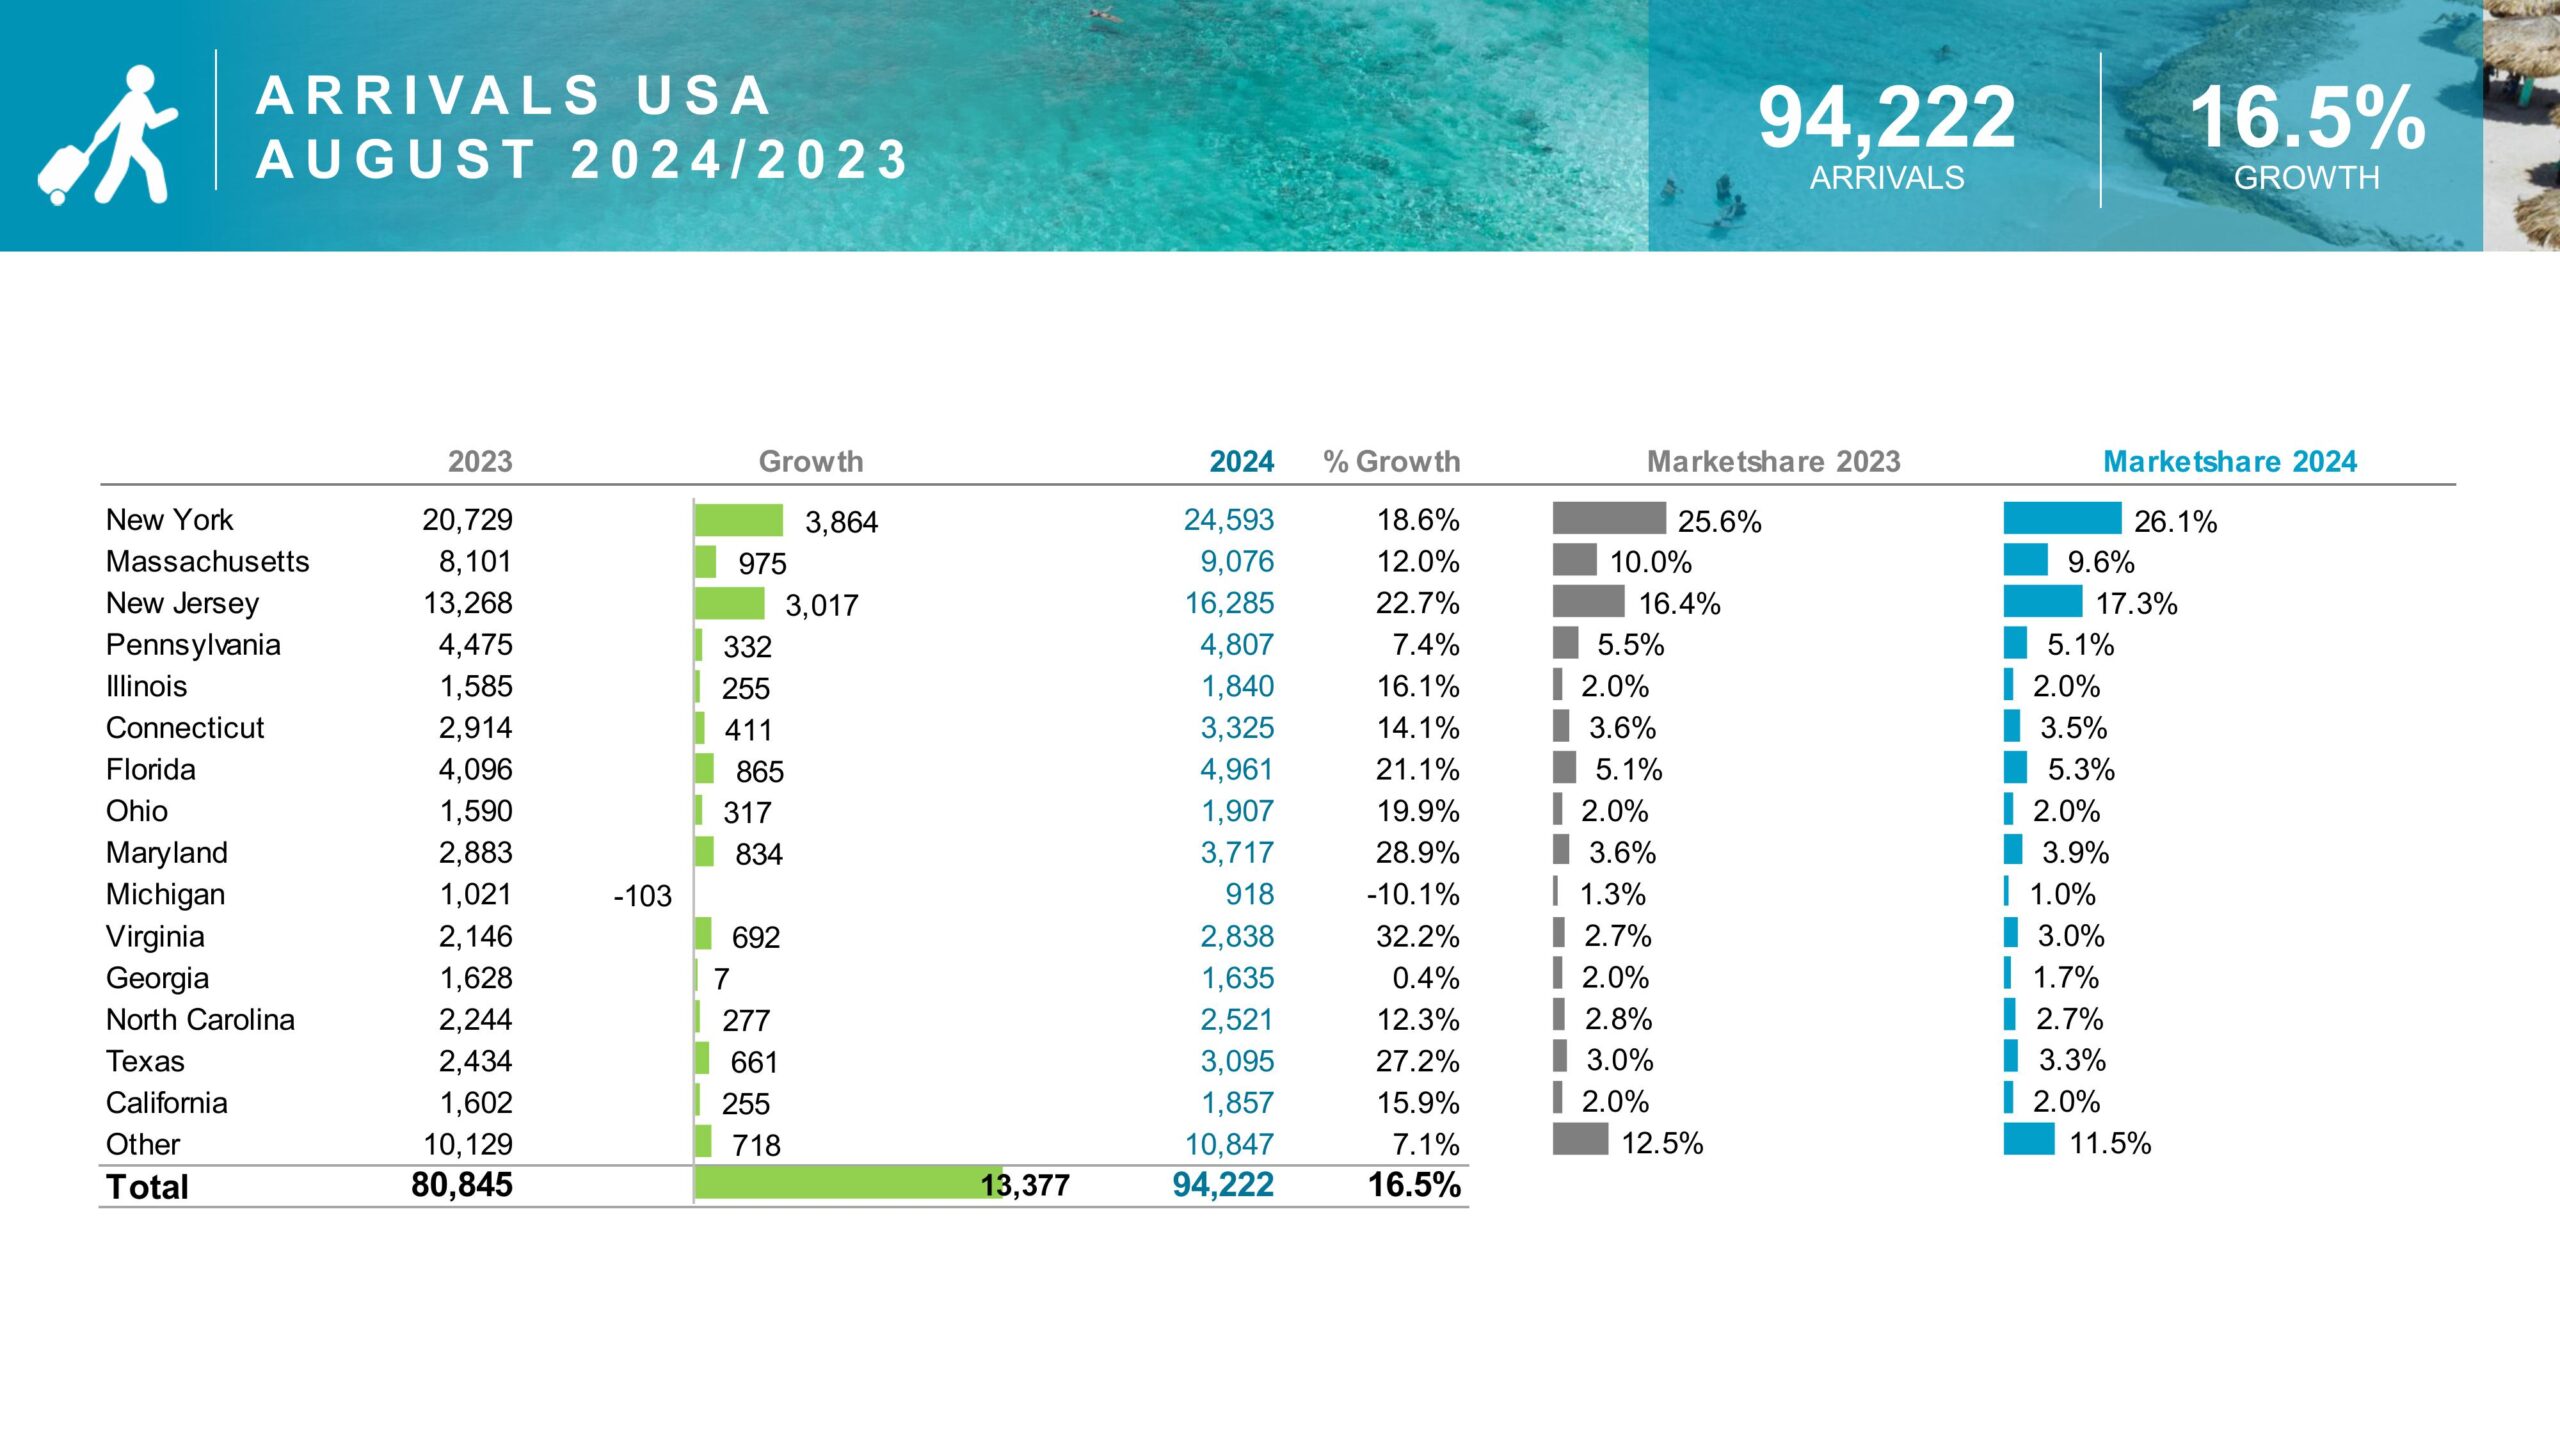
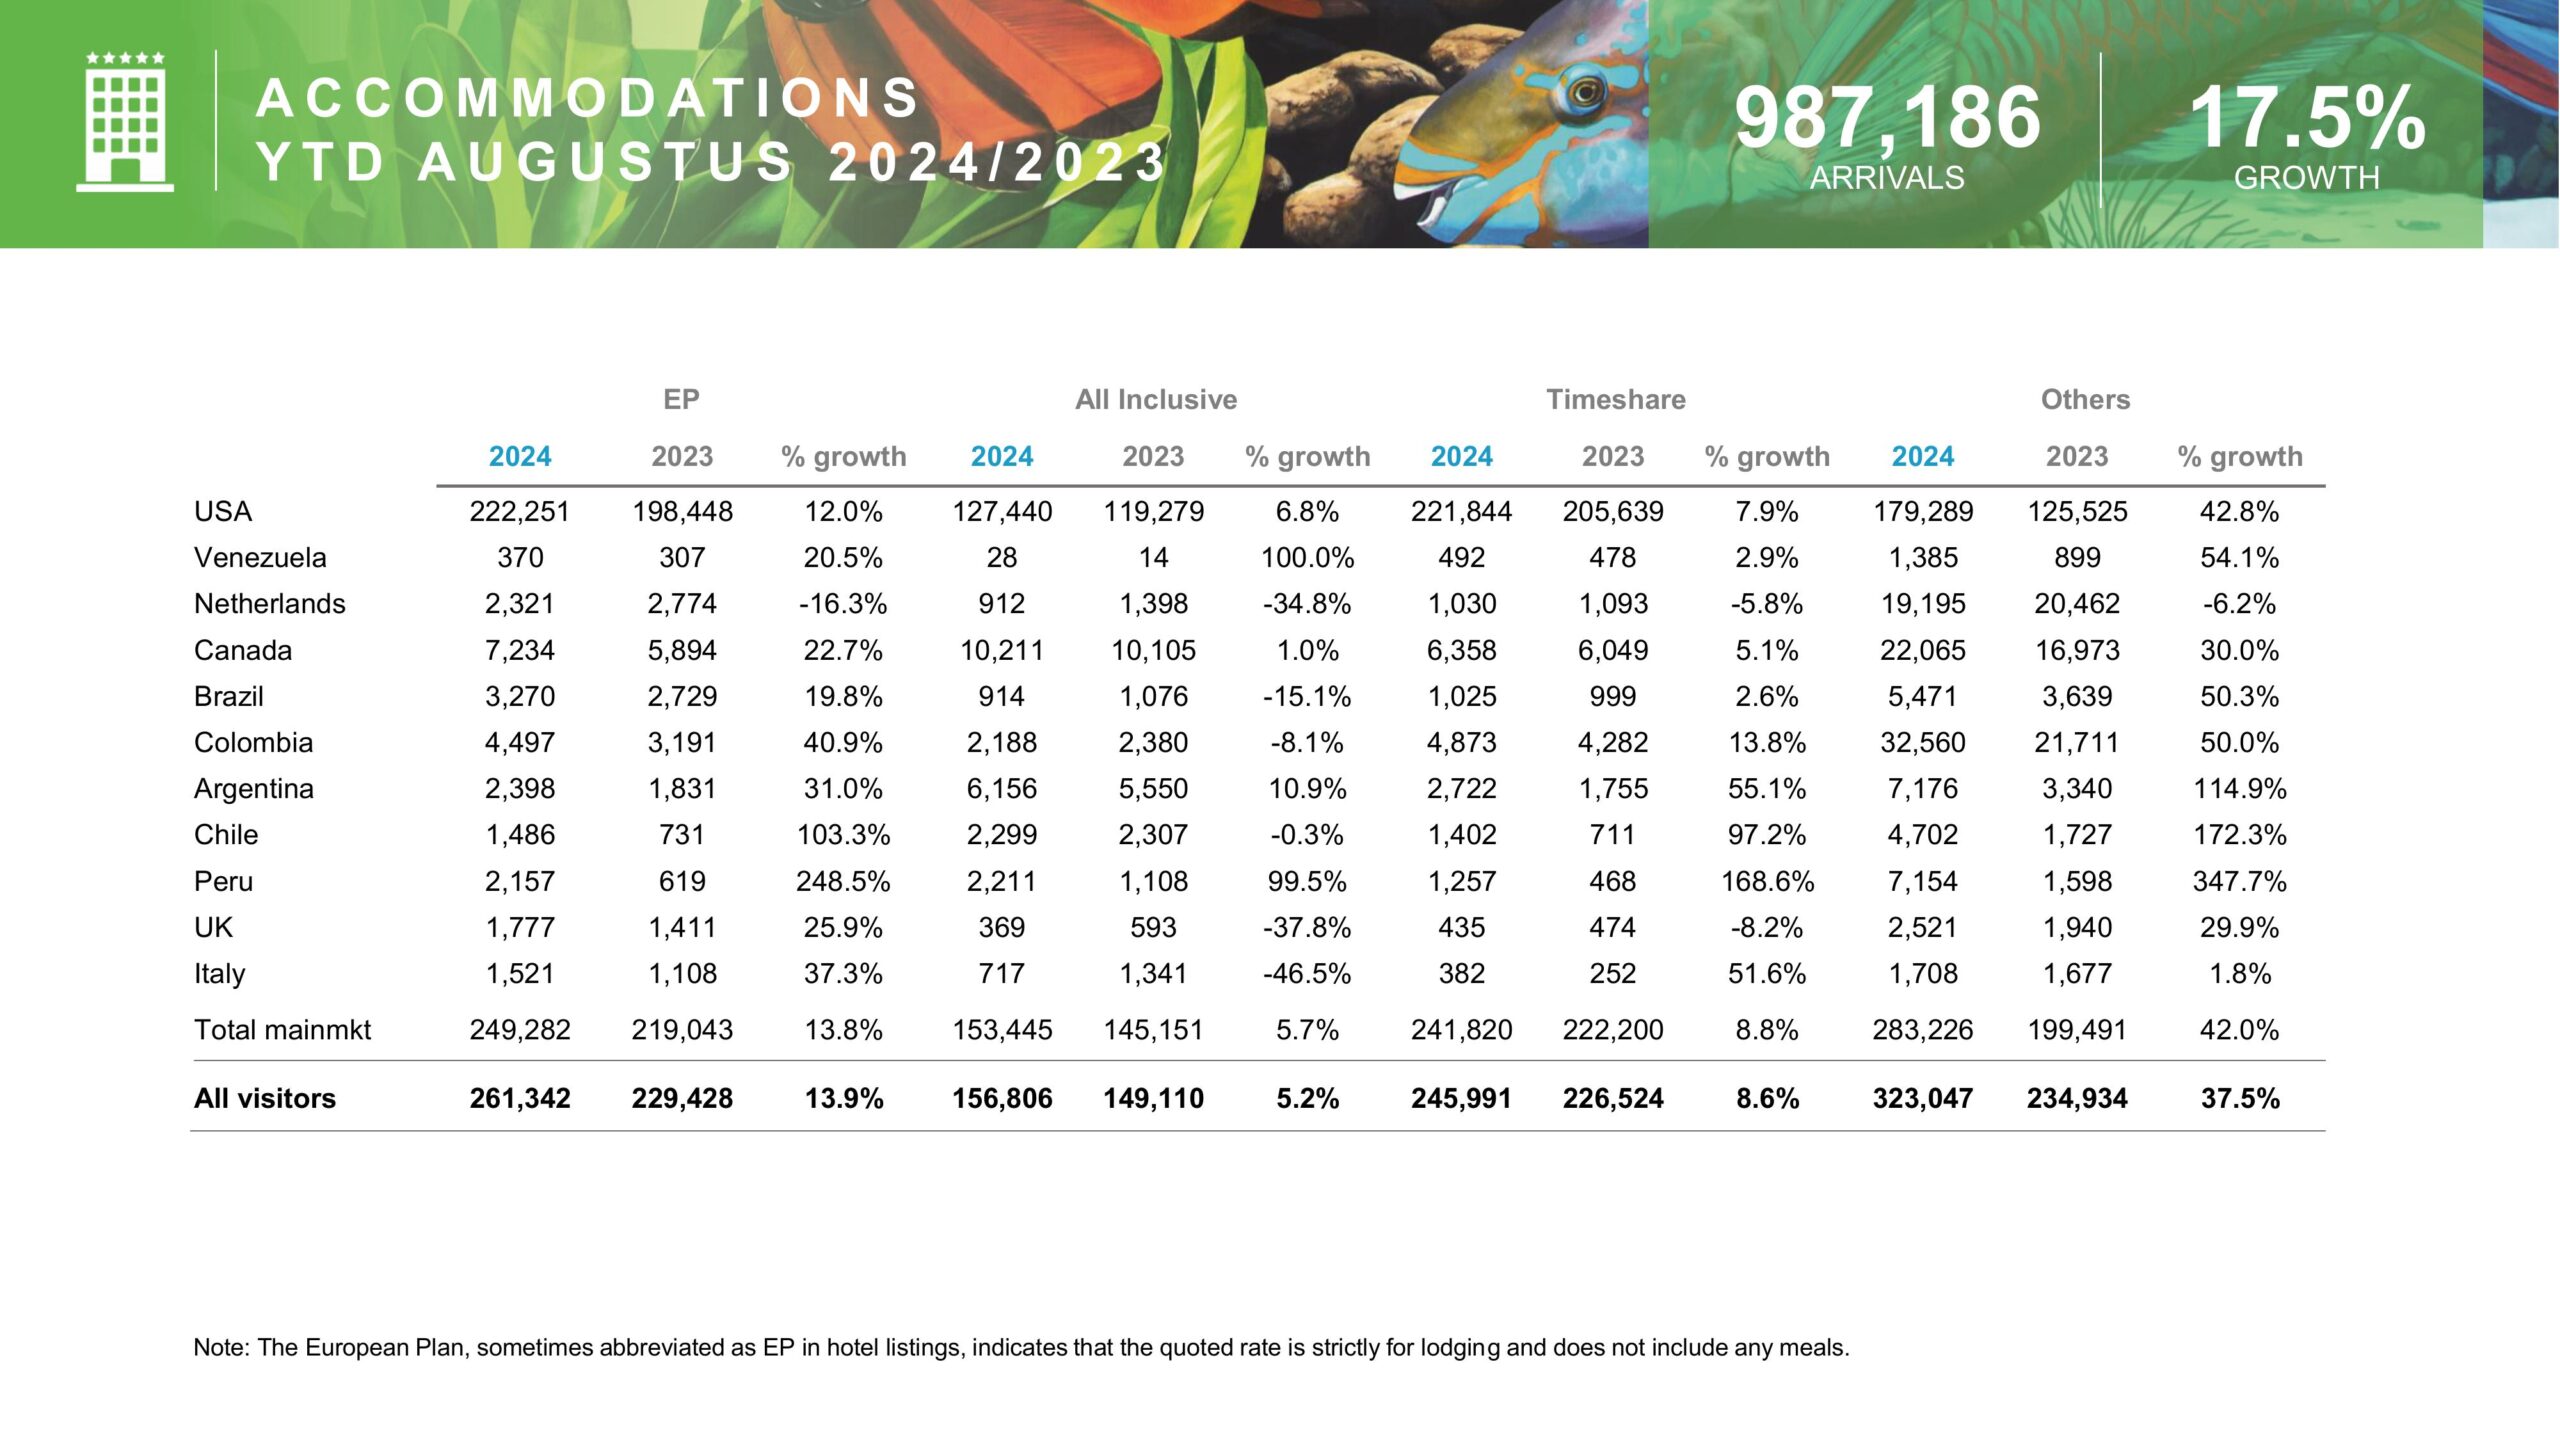
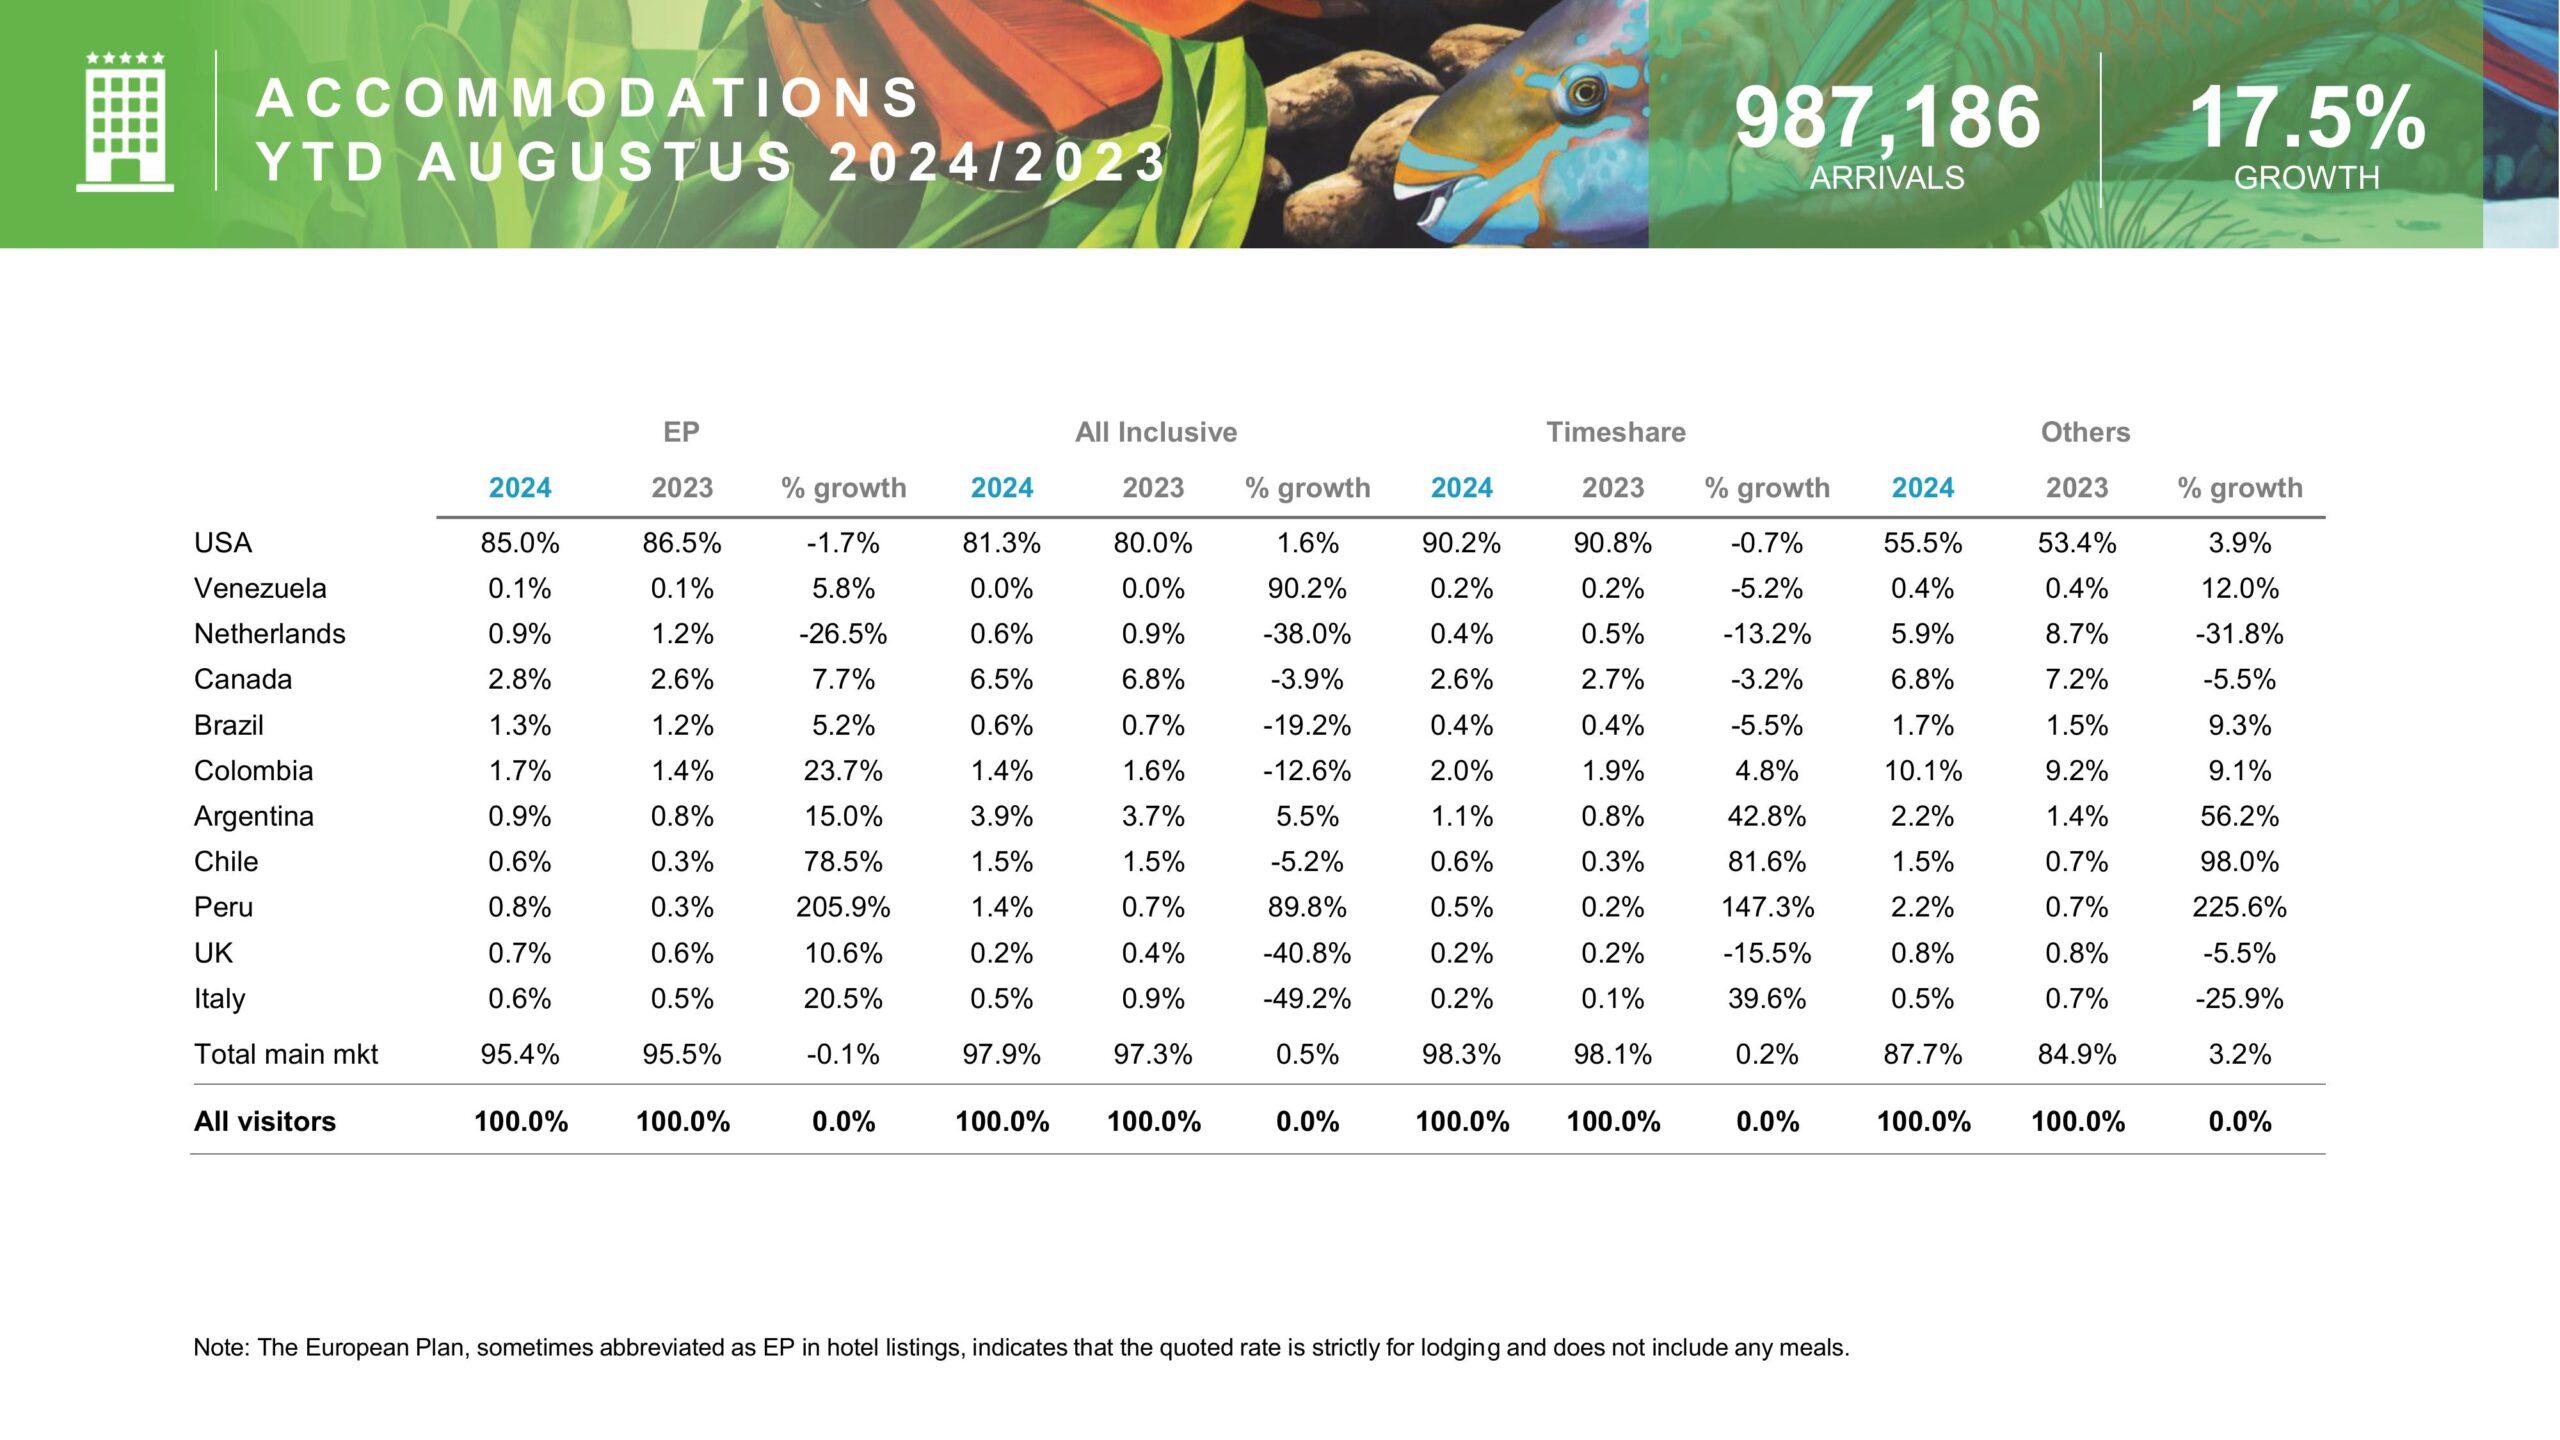
Visitor Arrivals and Growth
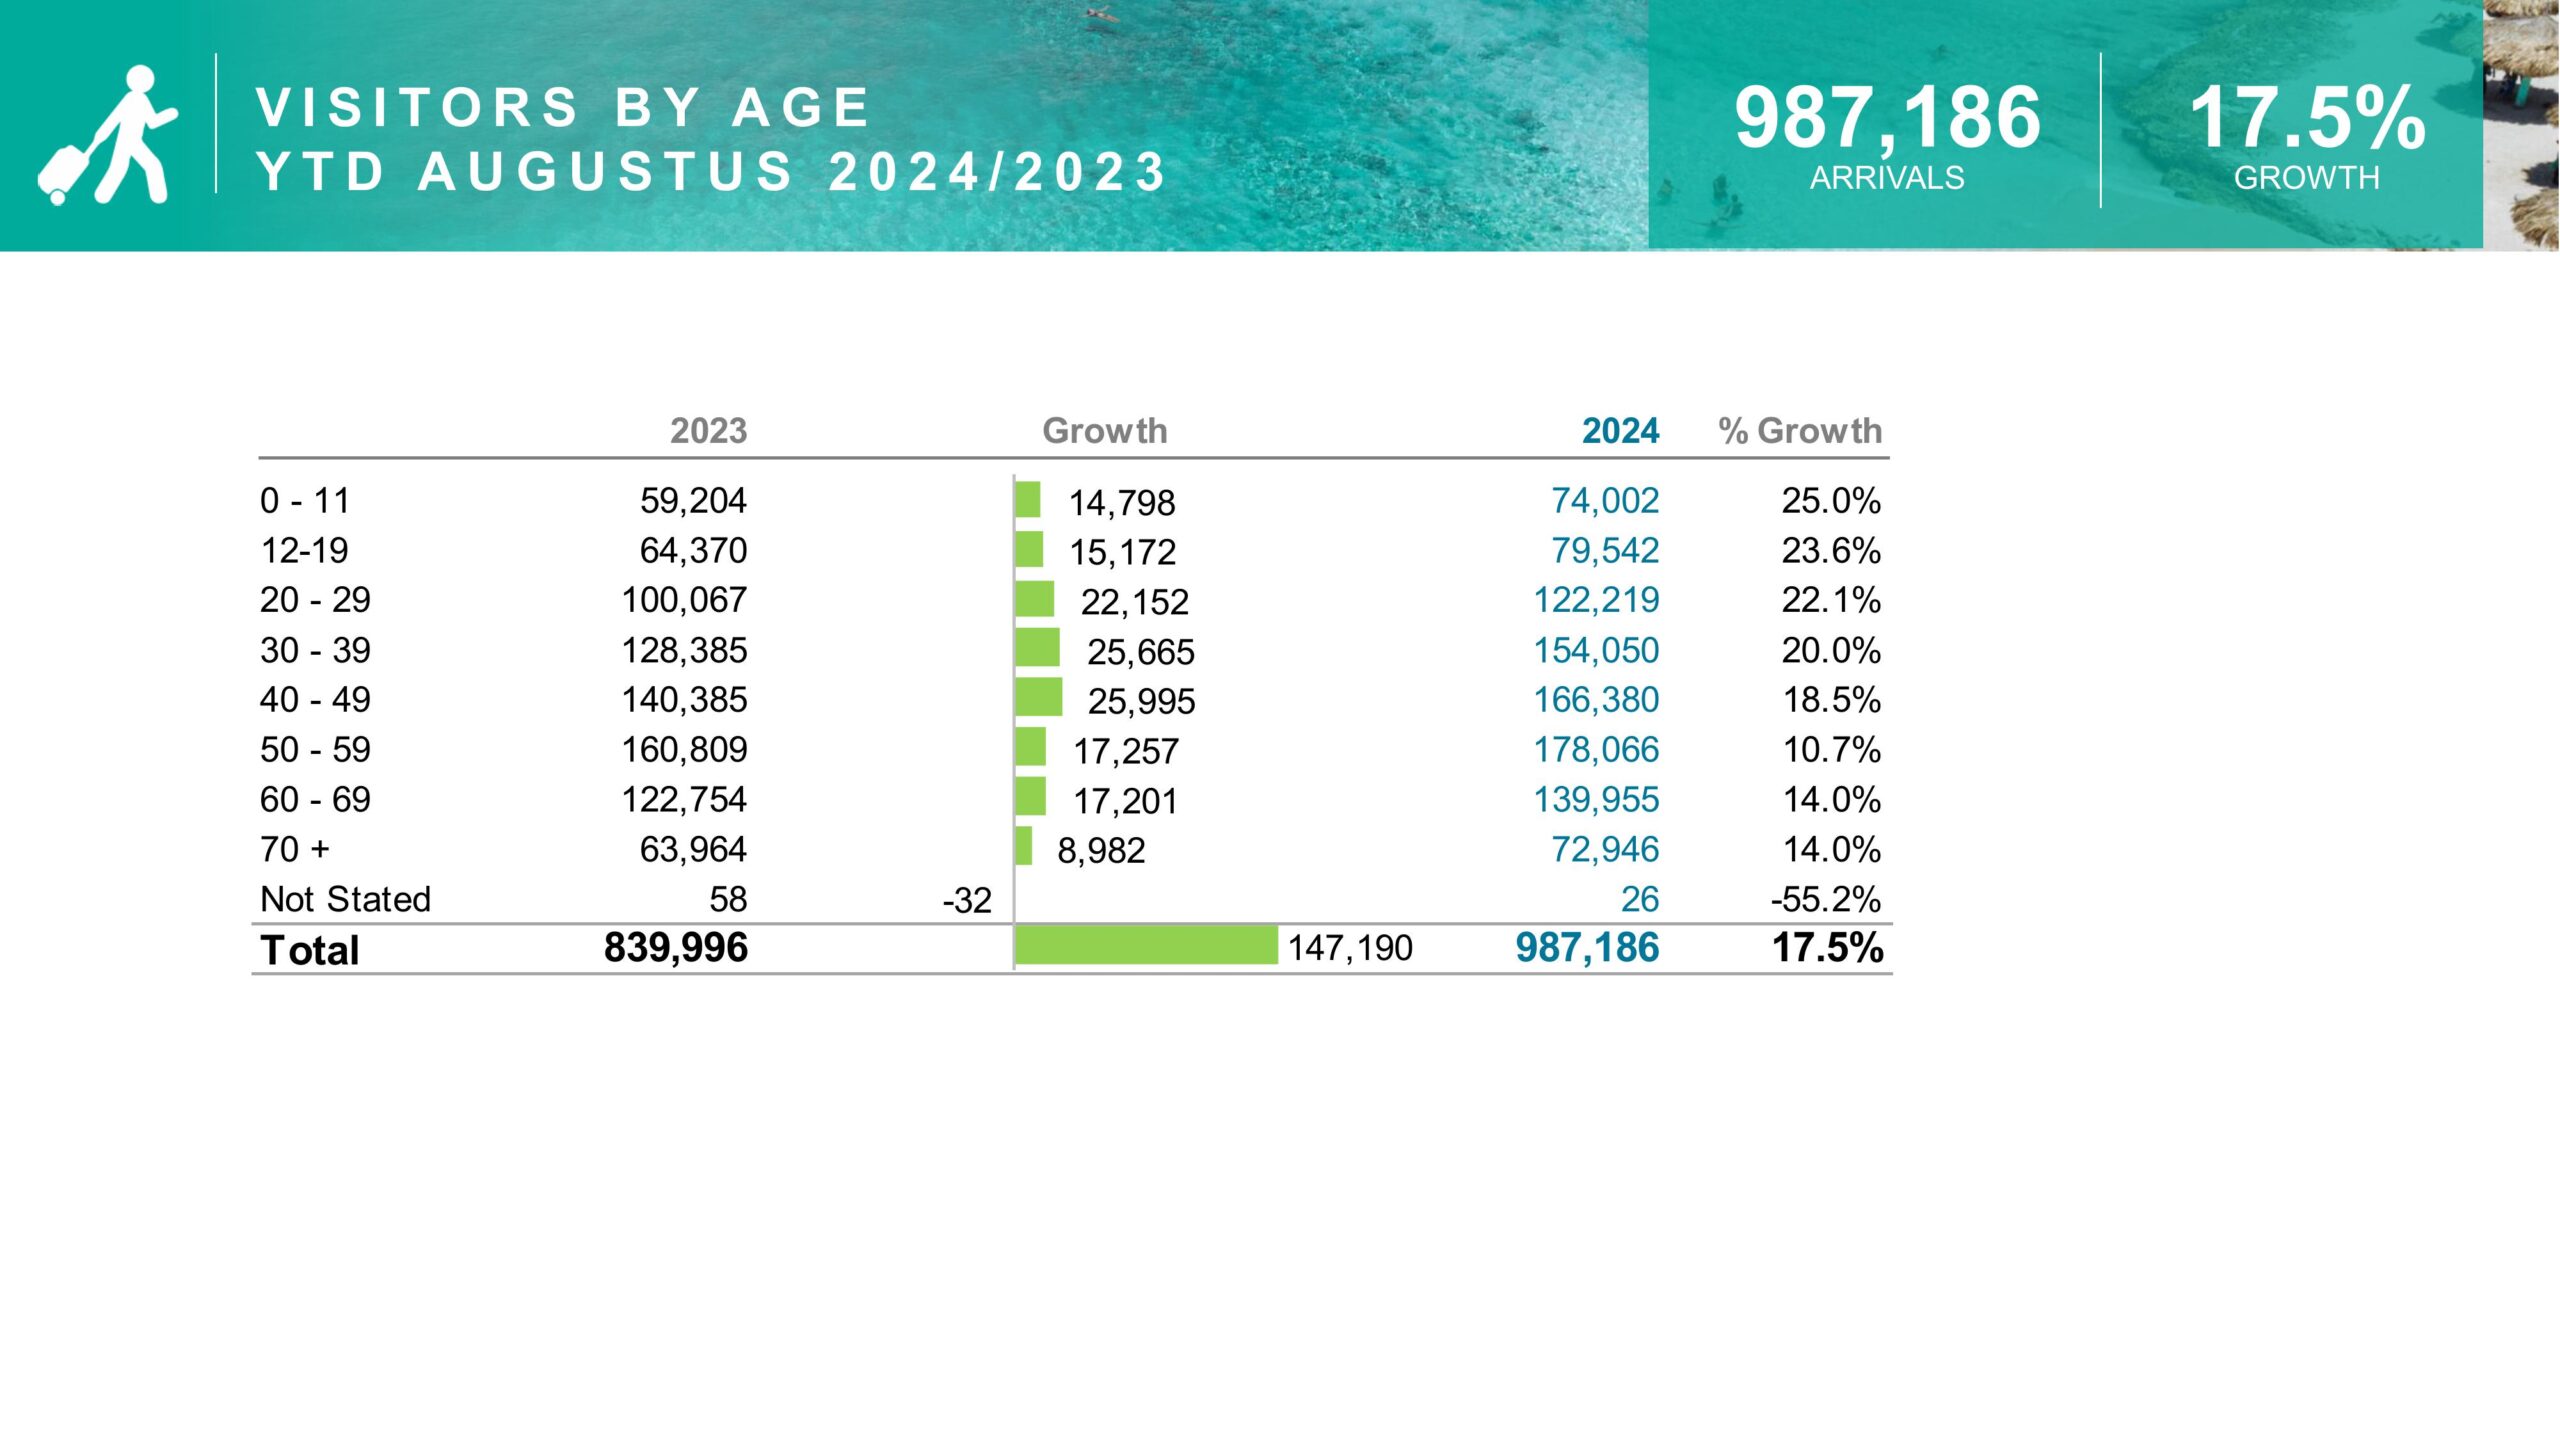
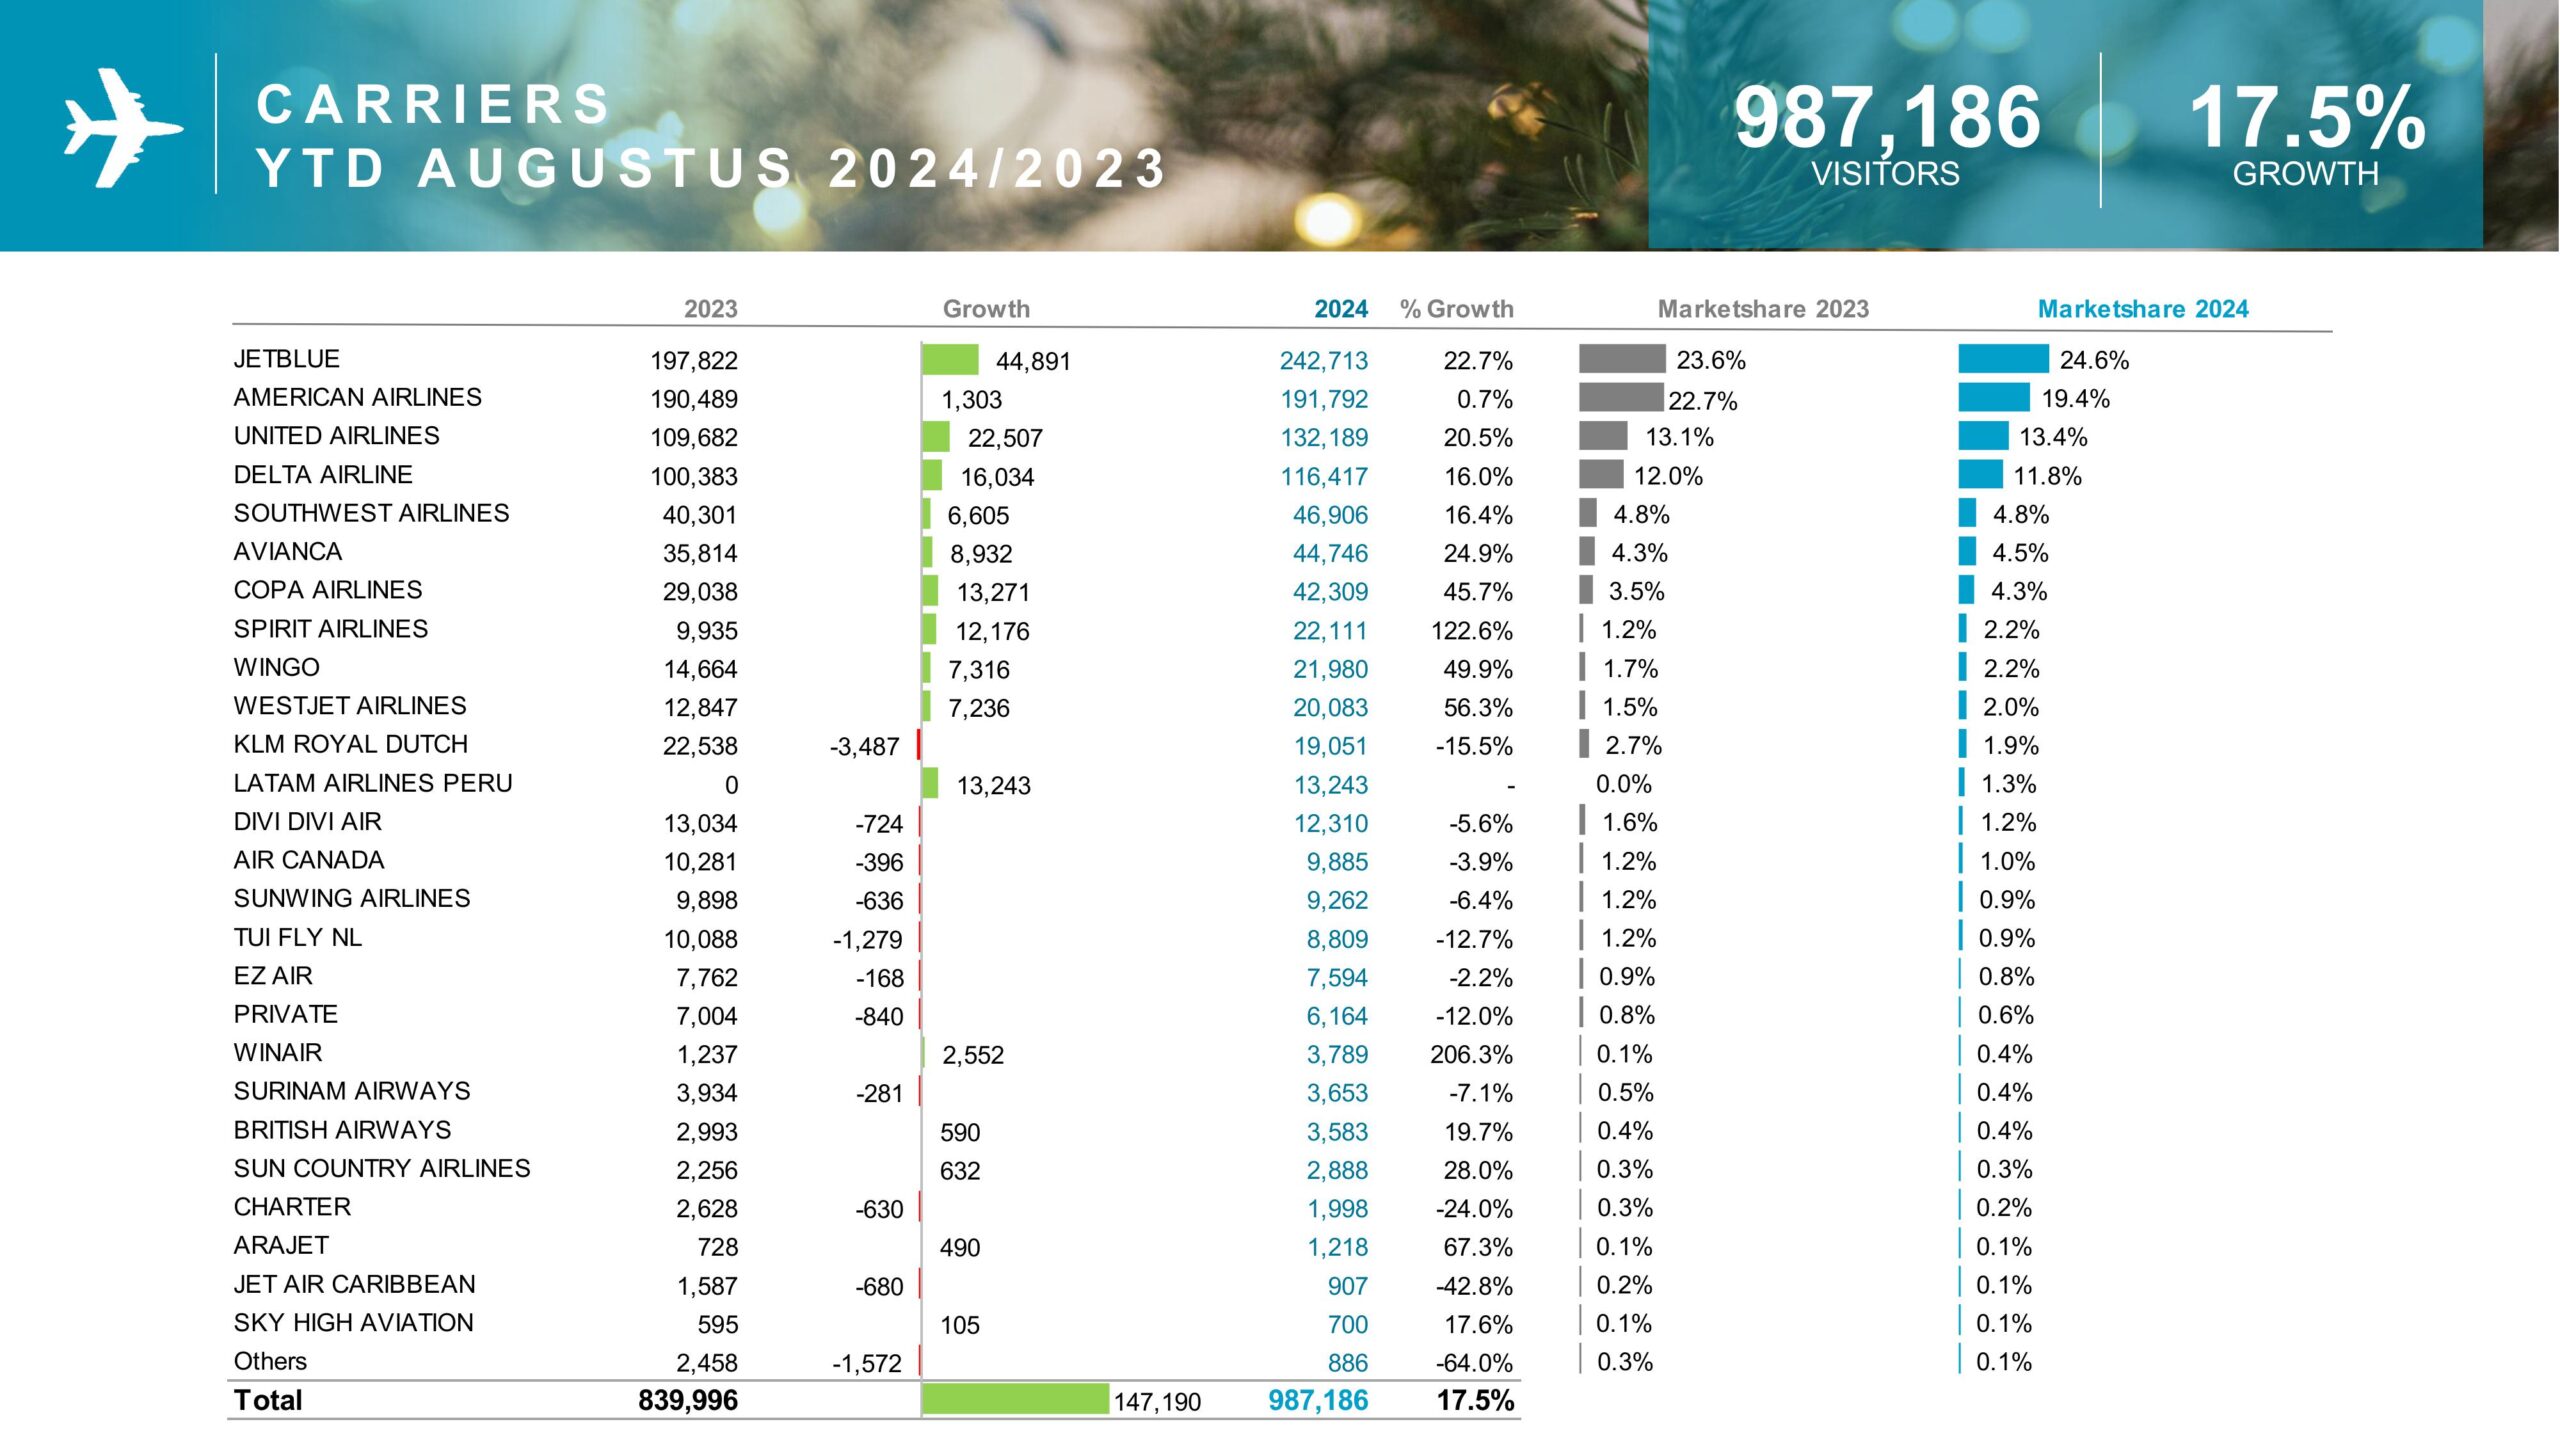
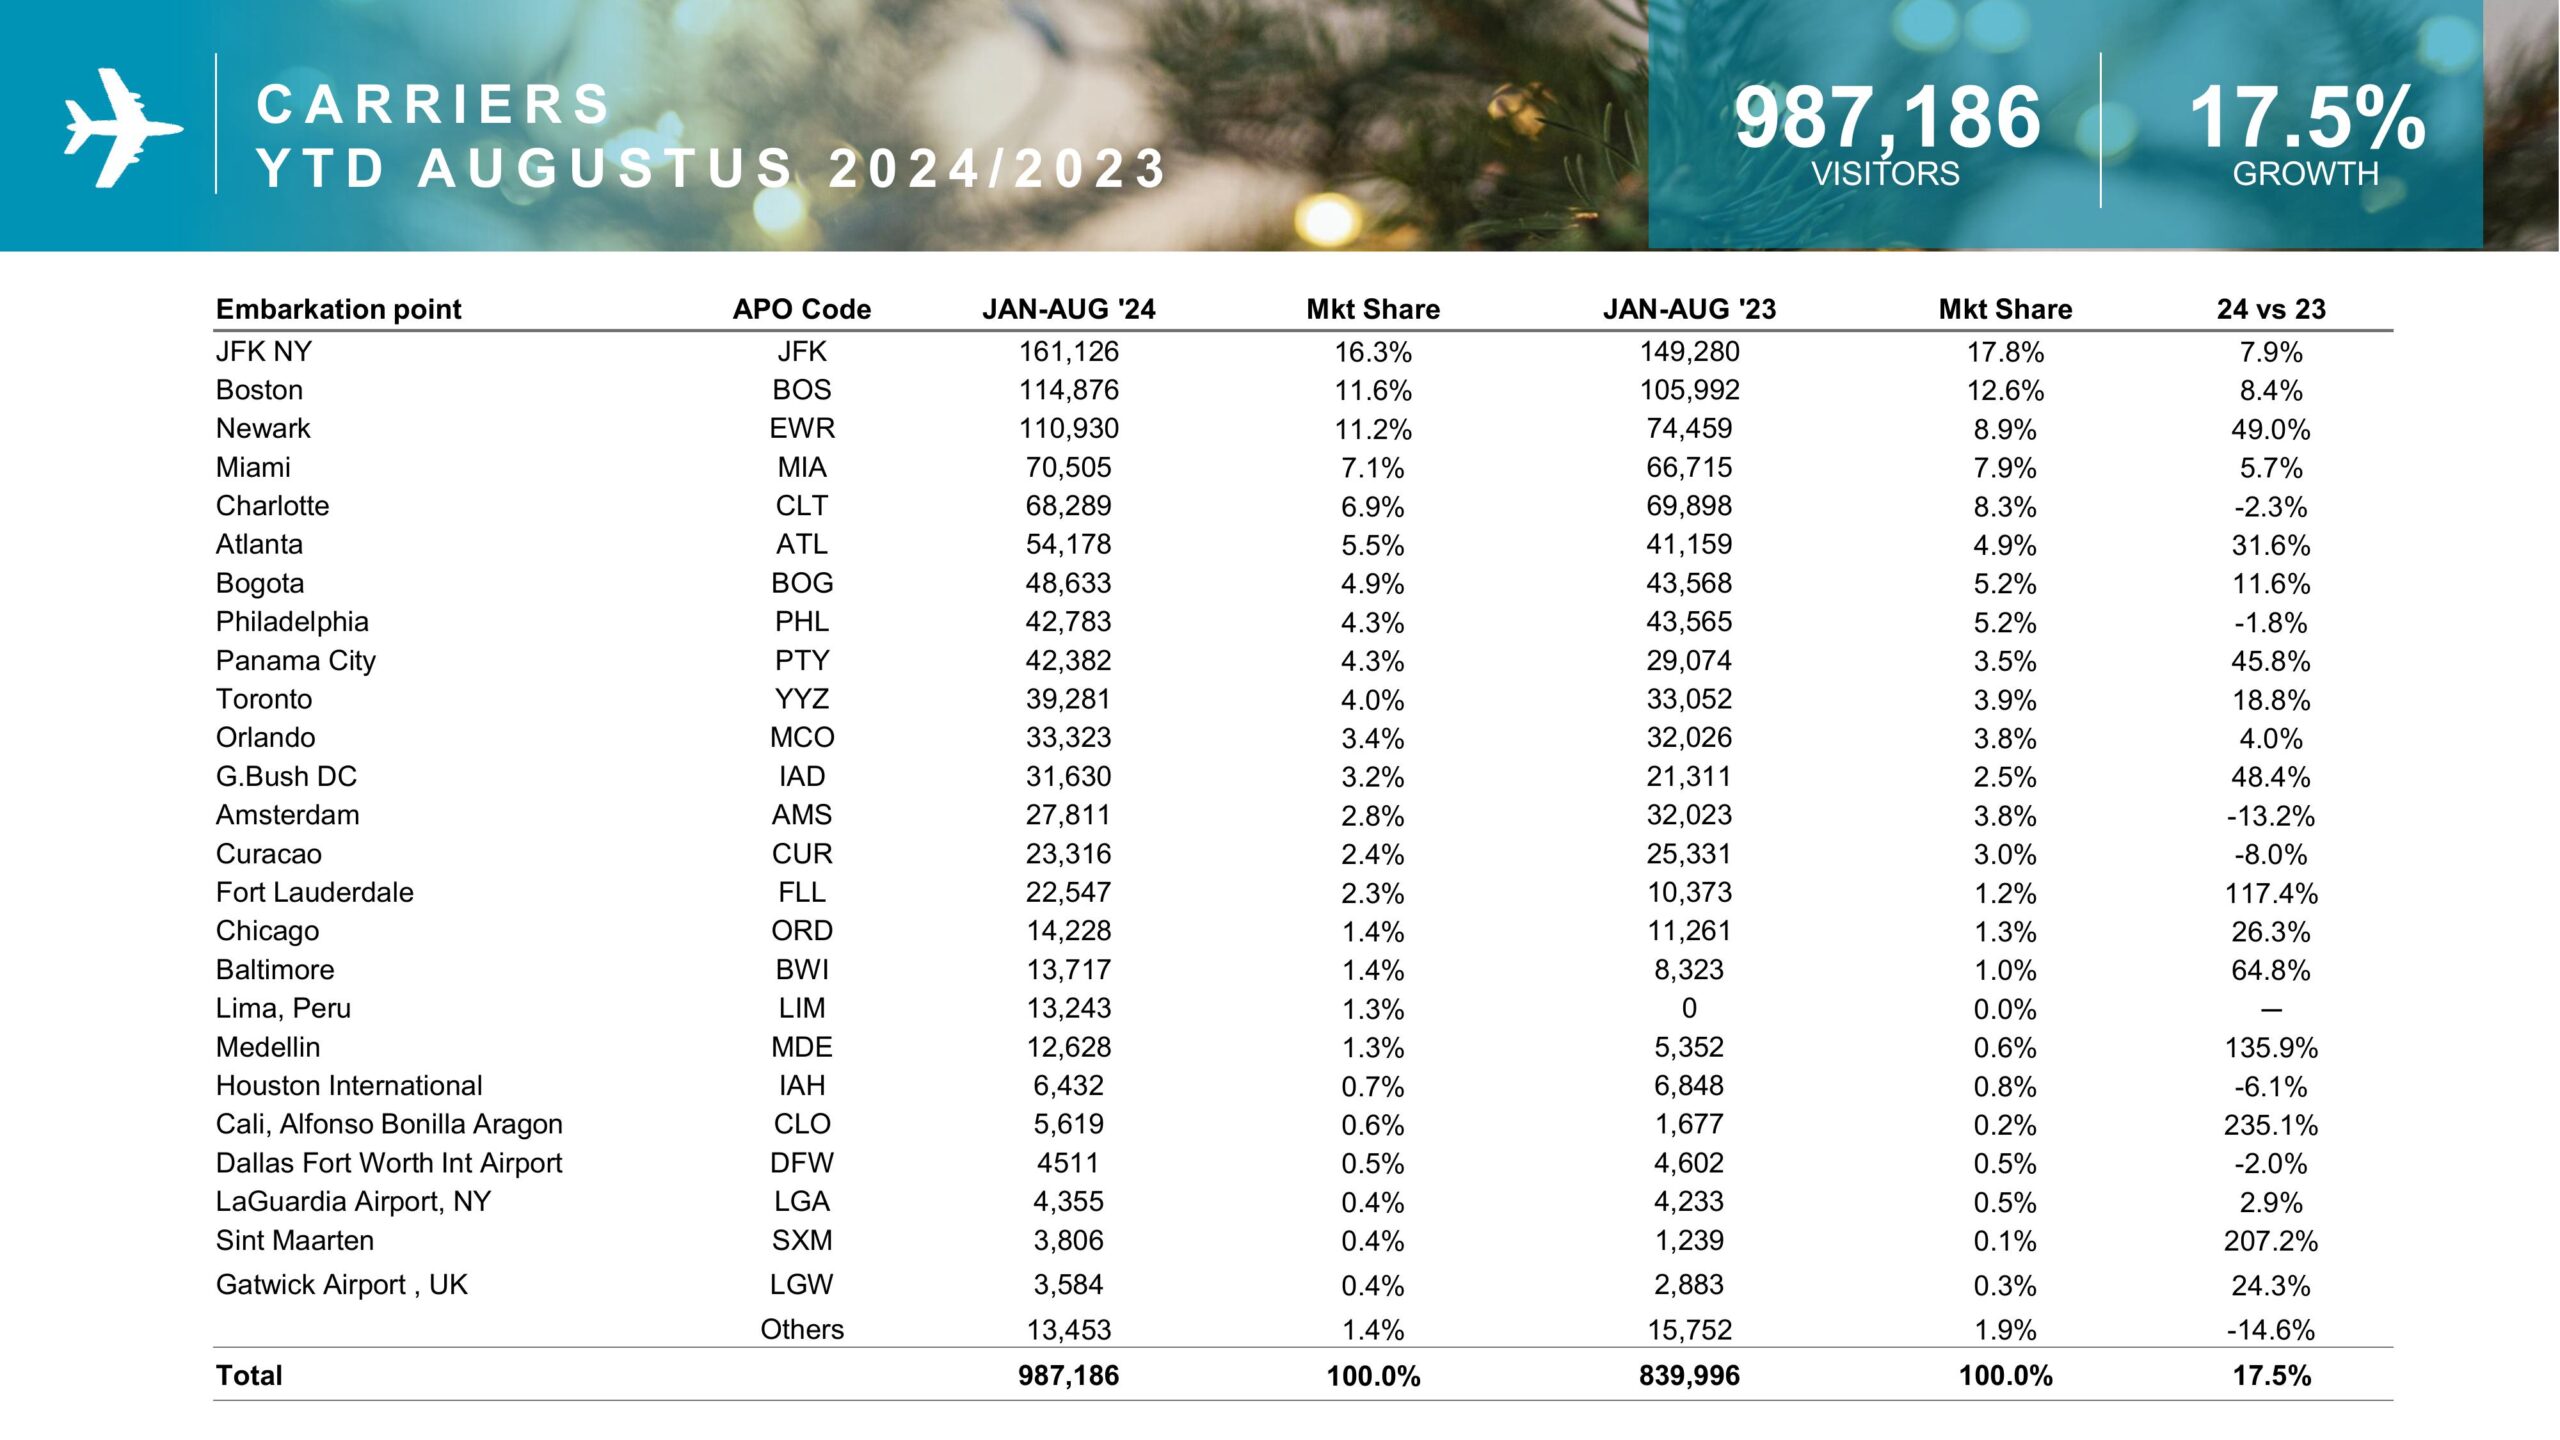
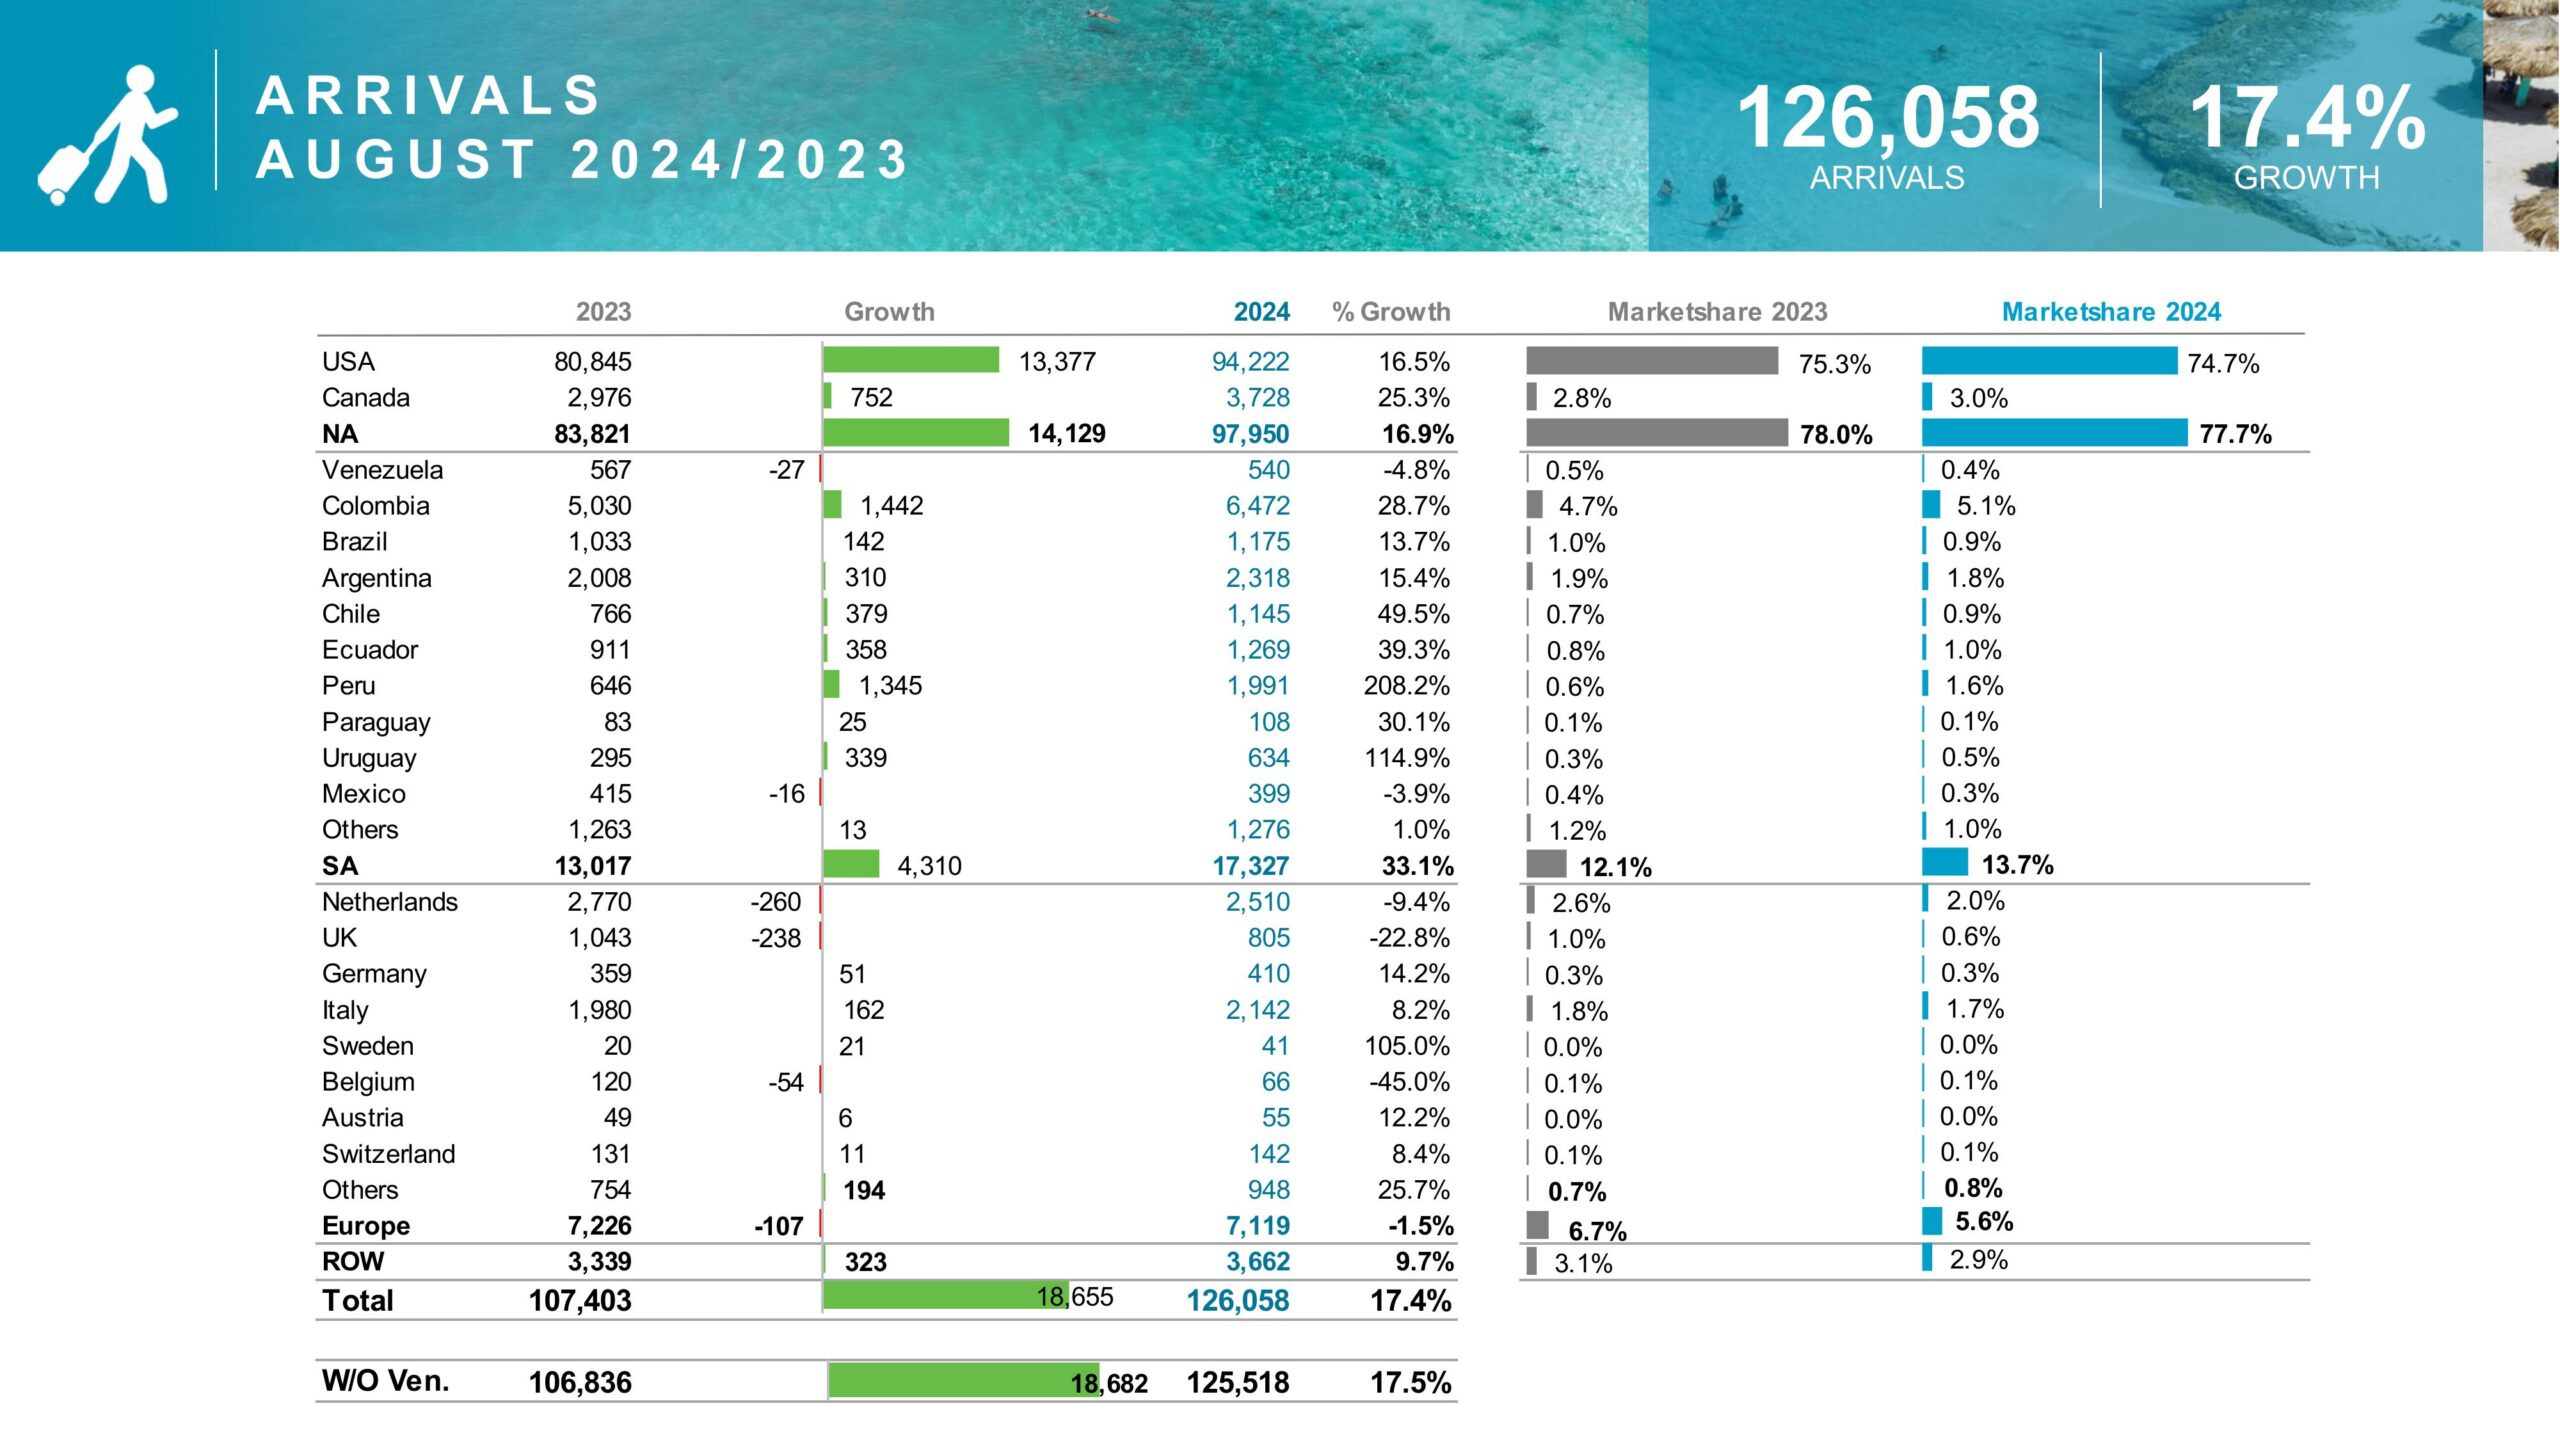
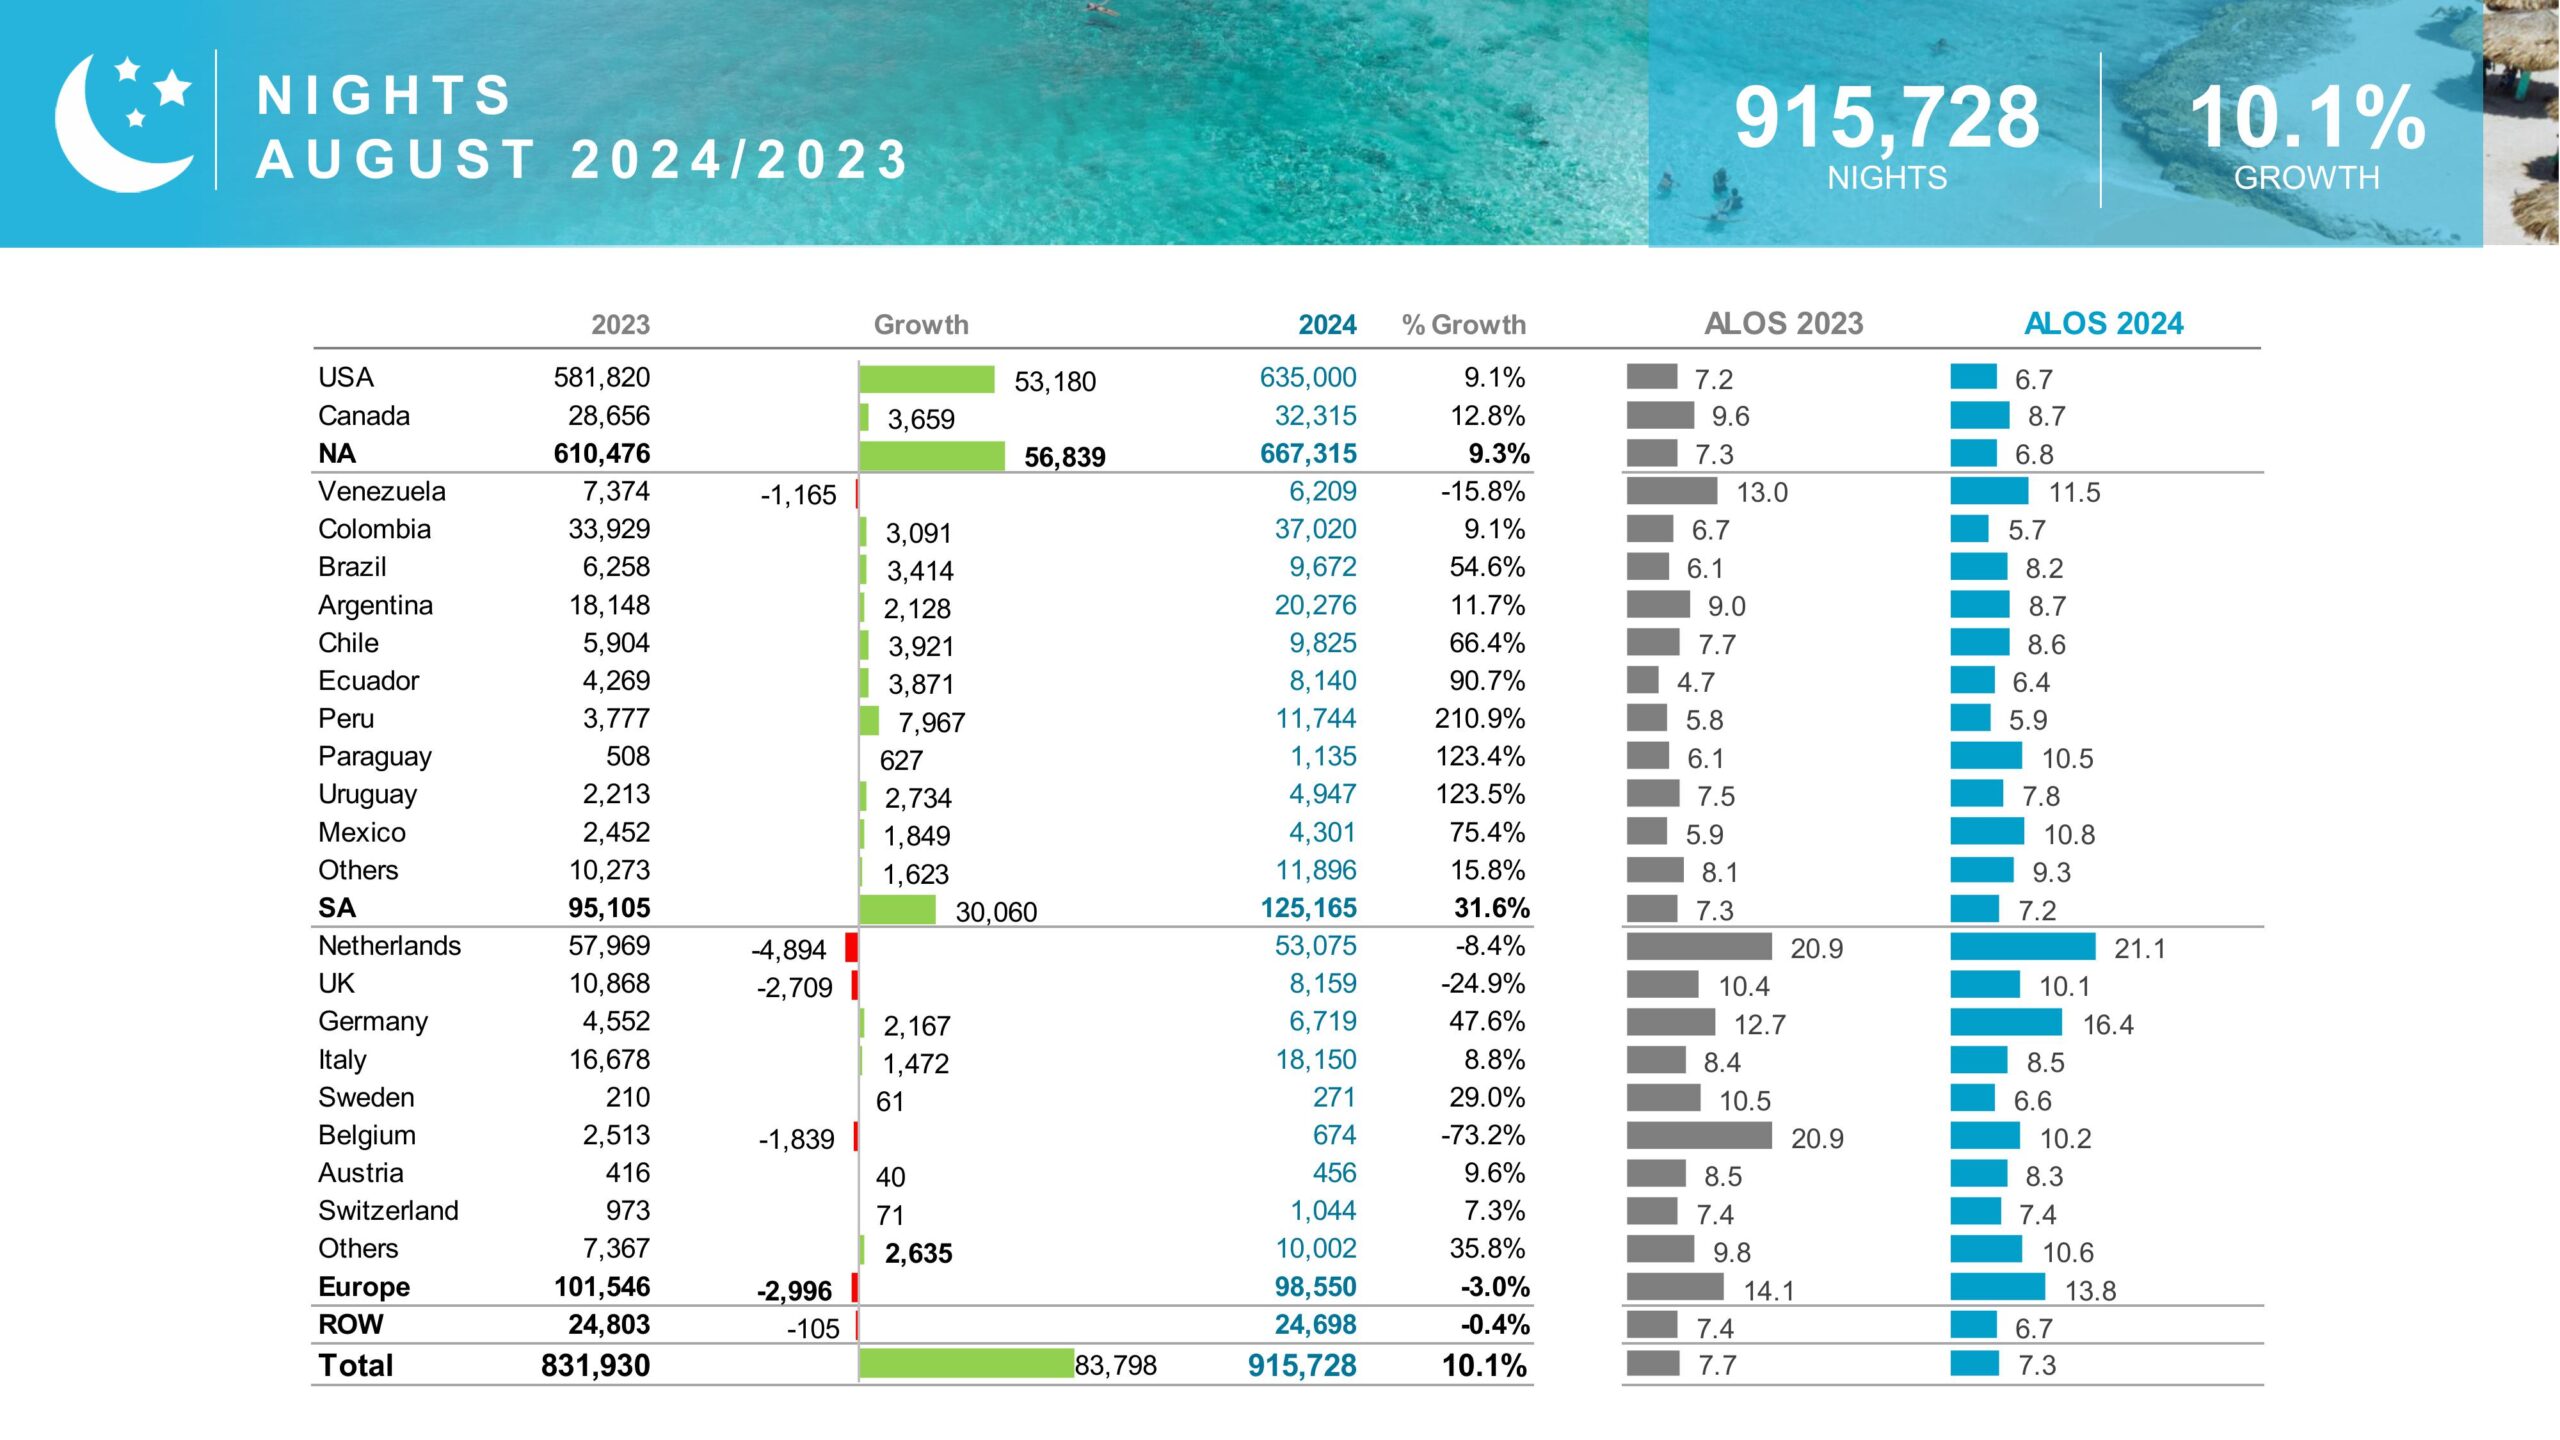
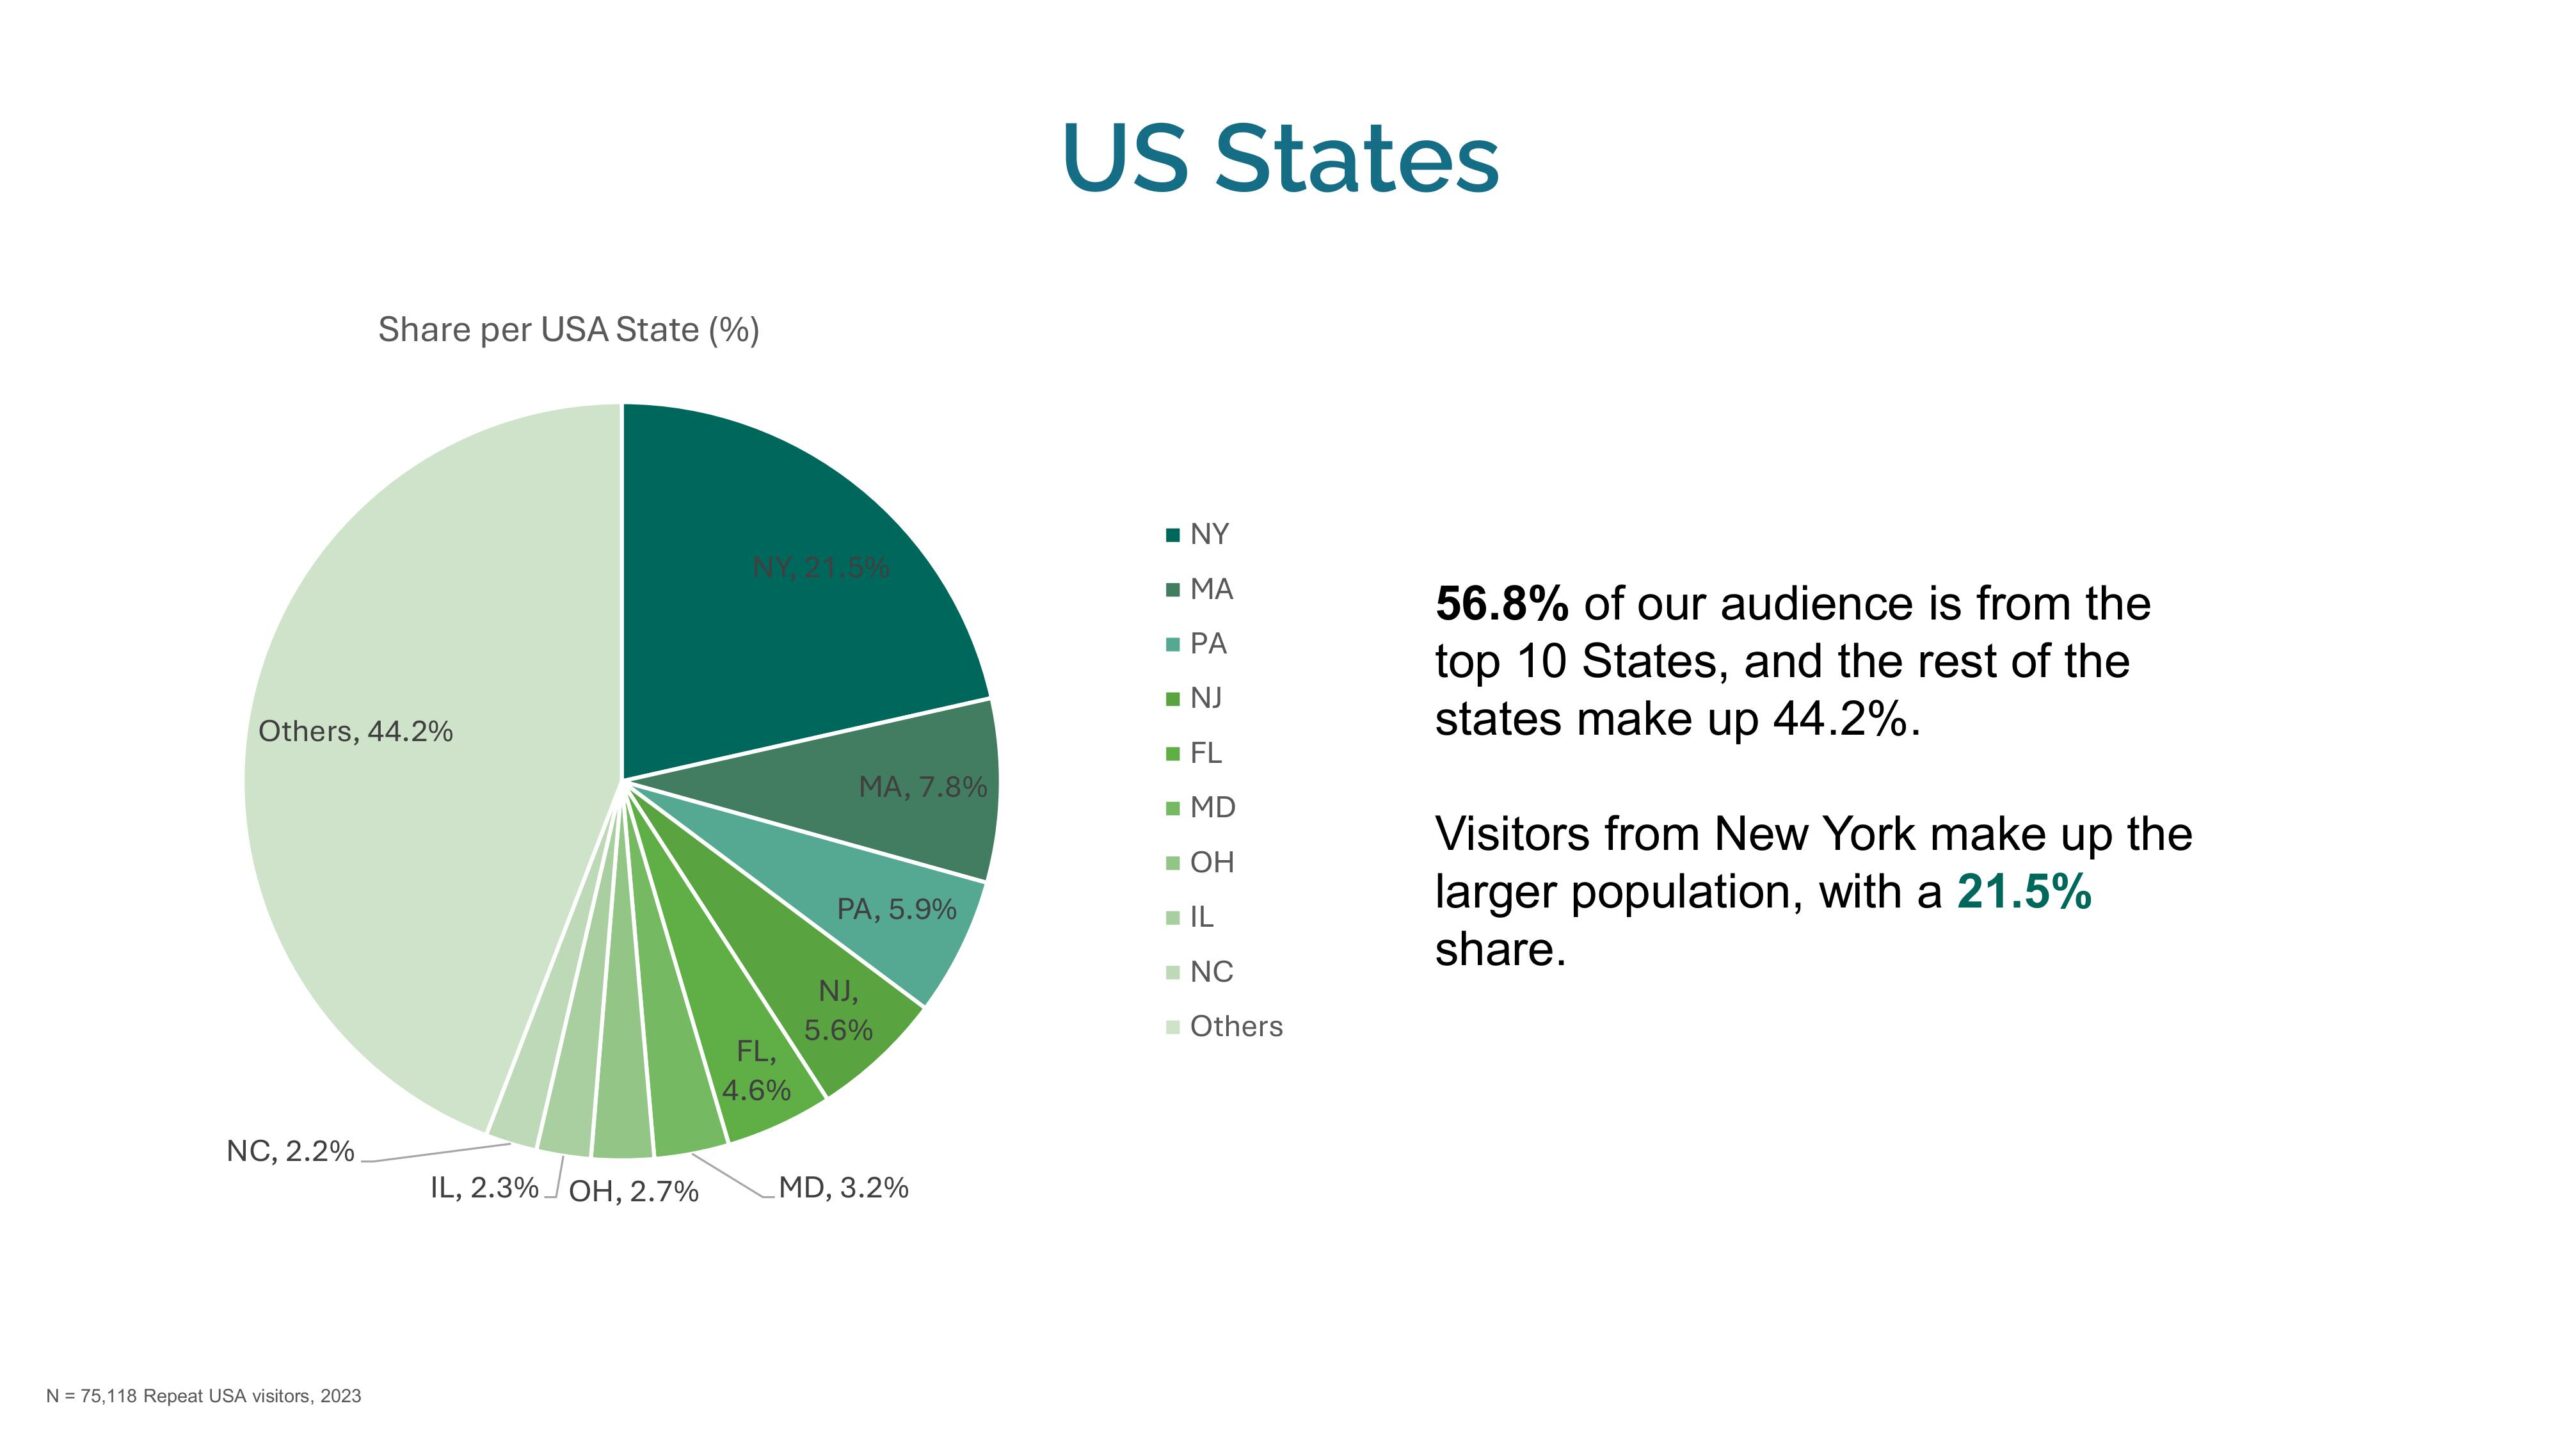
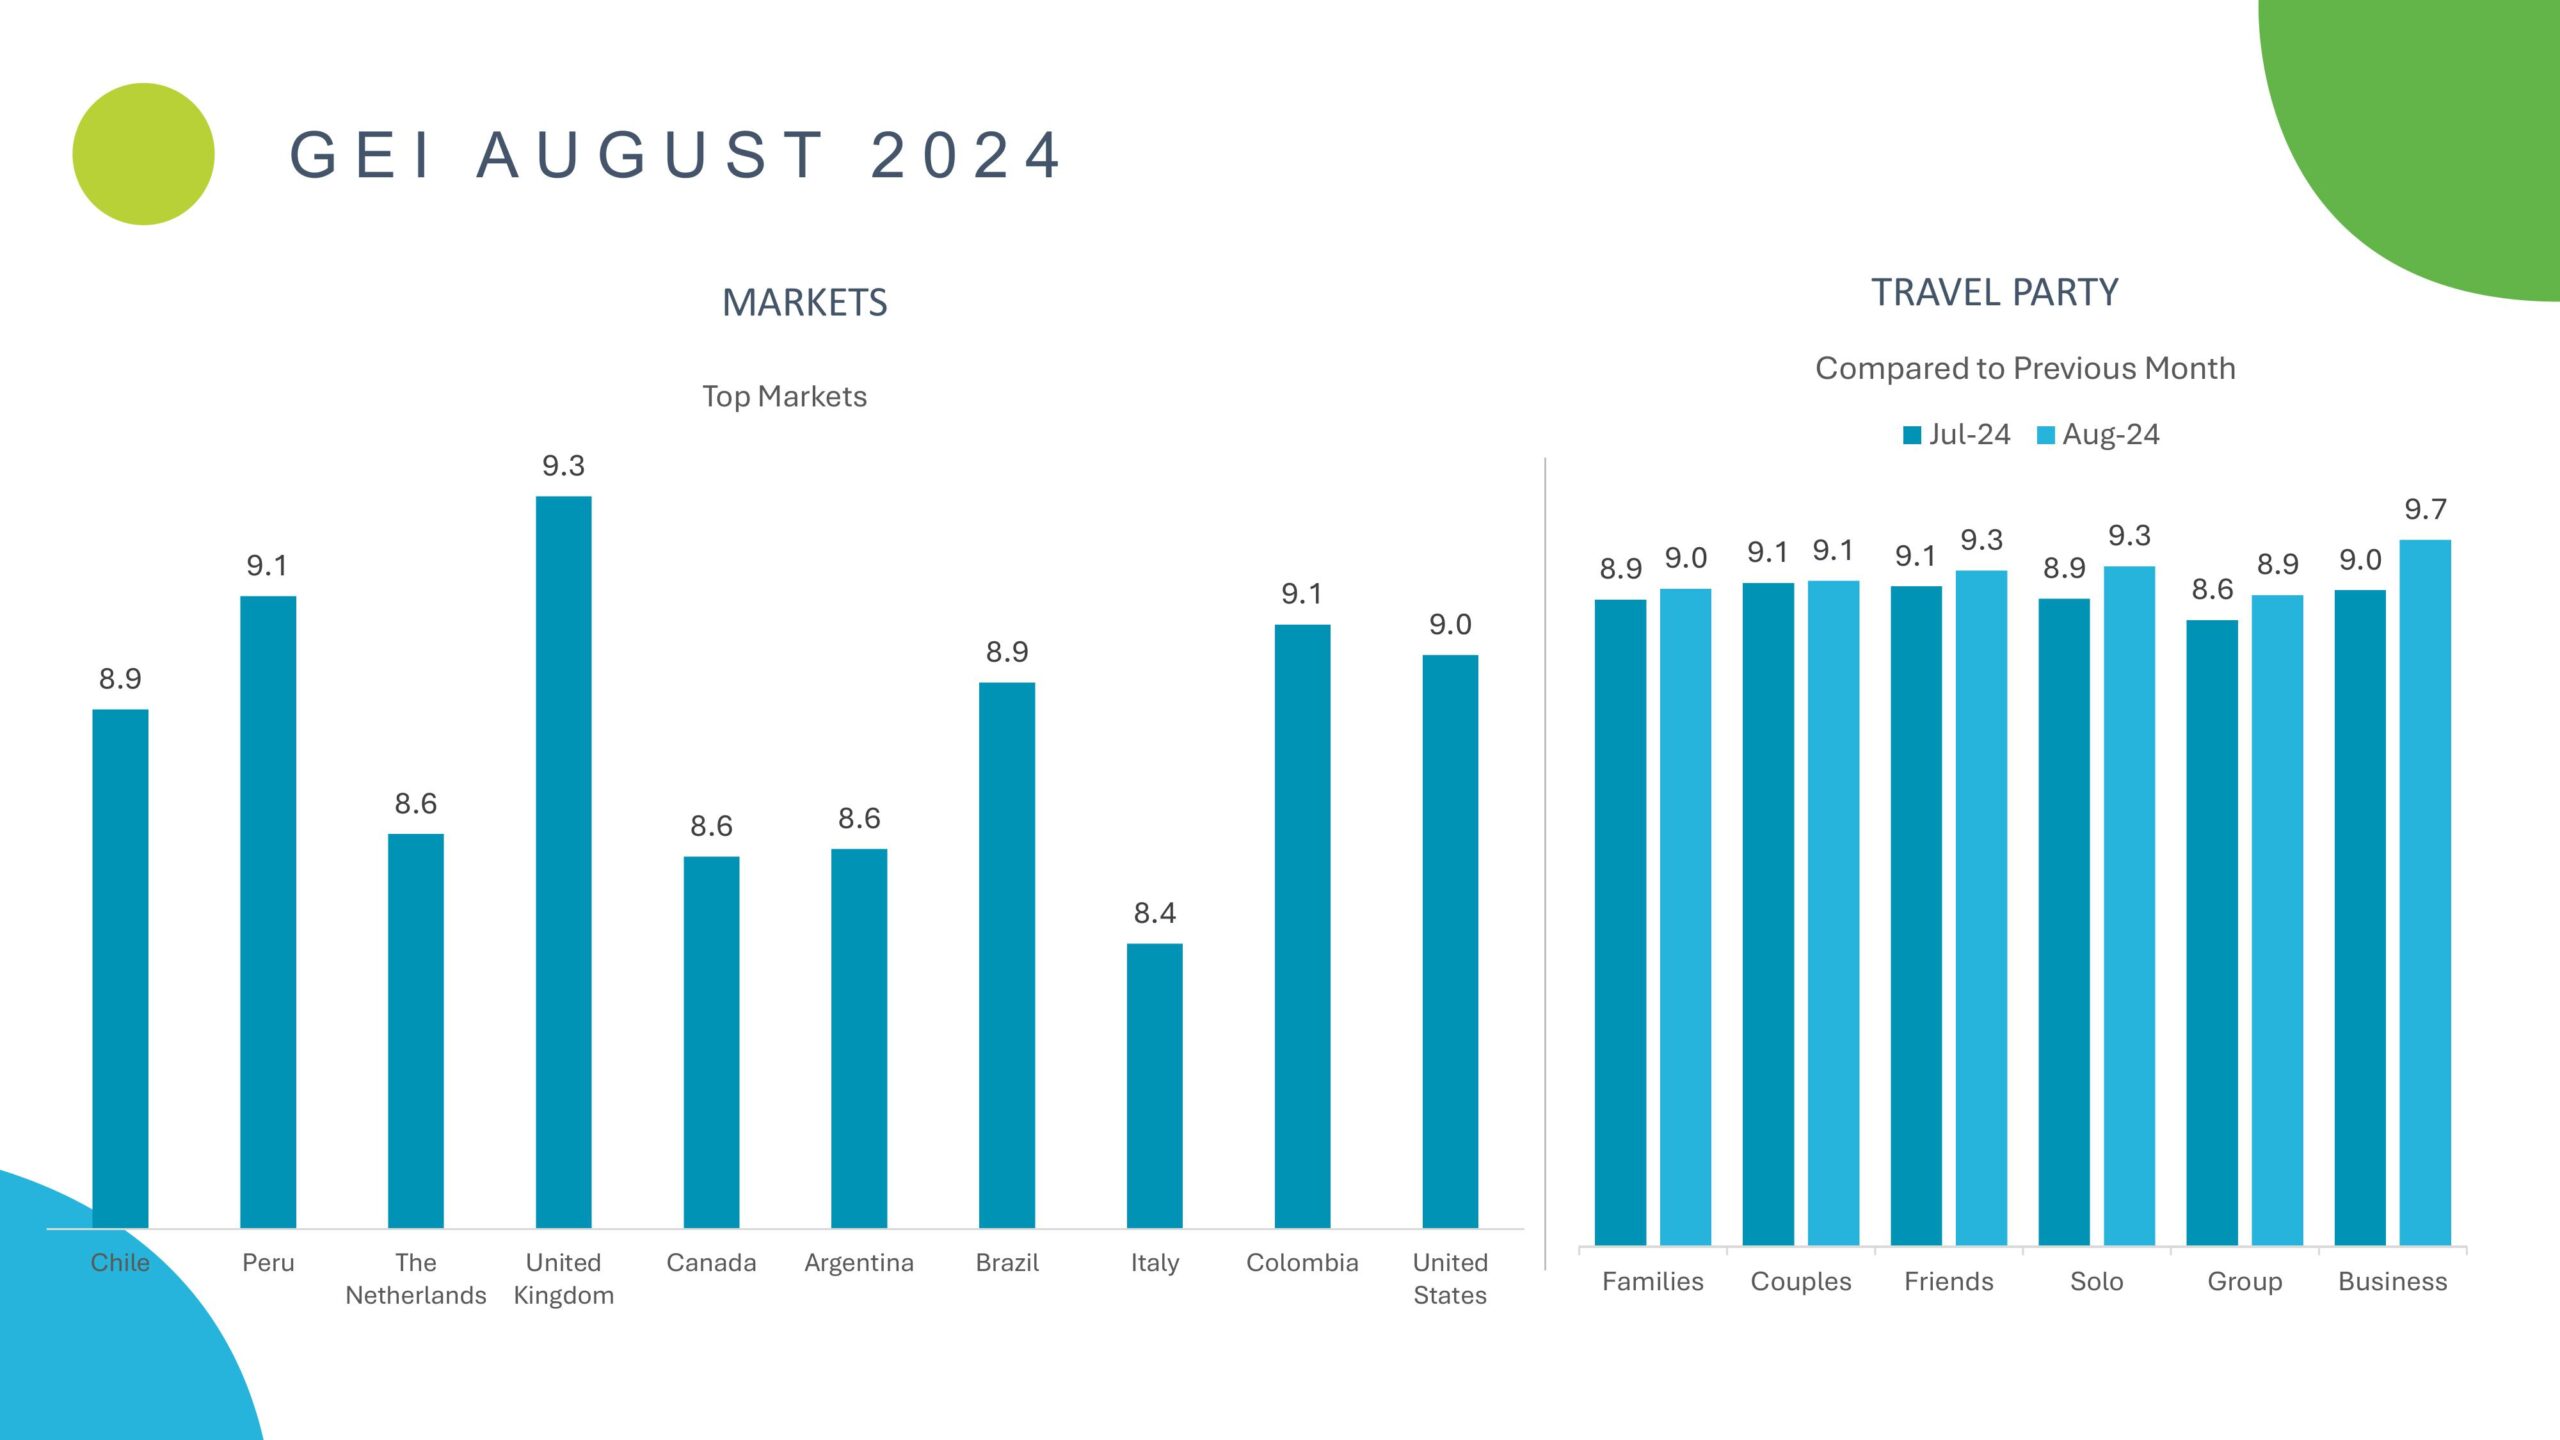
The Aruba Tourism August 2024 report reveals that the island welcomed 987,186 visitors by the end of August 2024. The USA remained the dominant source of tourists, with a 15.7% increase in arrivals, contributing significantly to Aruba’s overall tourism growth. Canadian visitors also surged by 17.5%, while notable increases were observed in South American markets, including Colombia and Argentina, which saw rises of 39.8% and 47.9%, respectively.


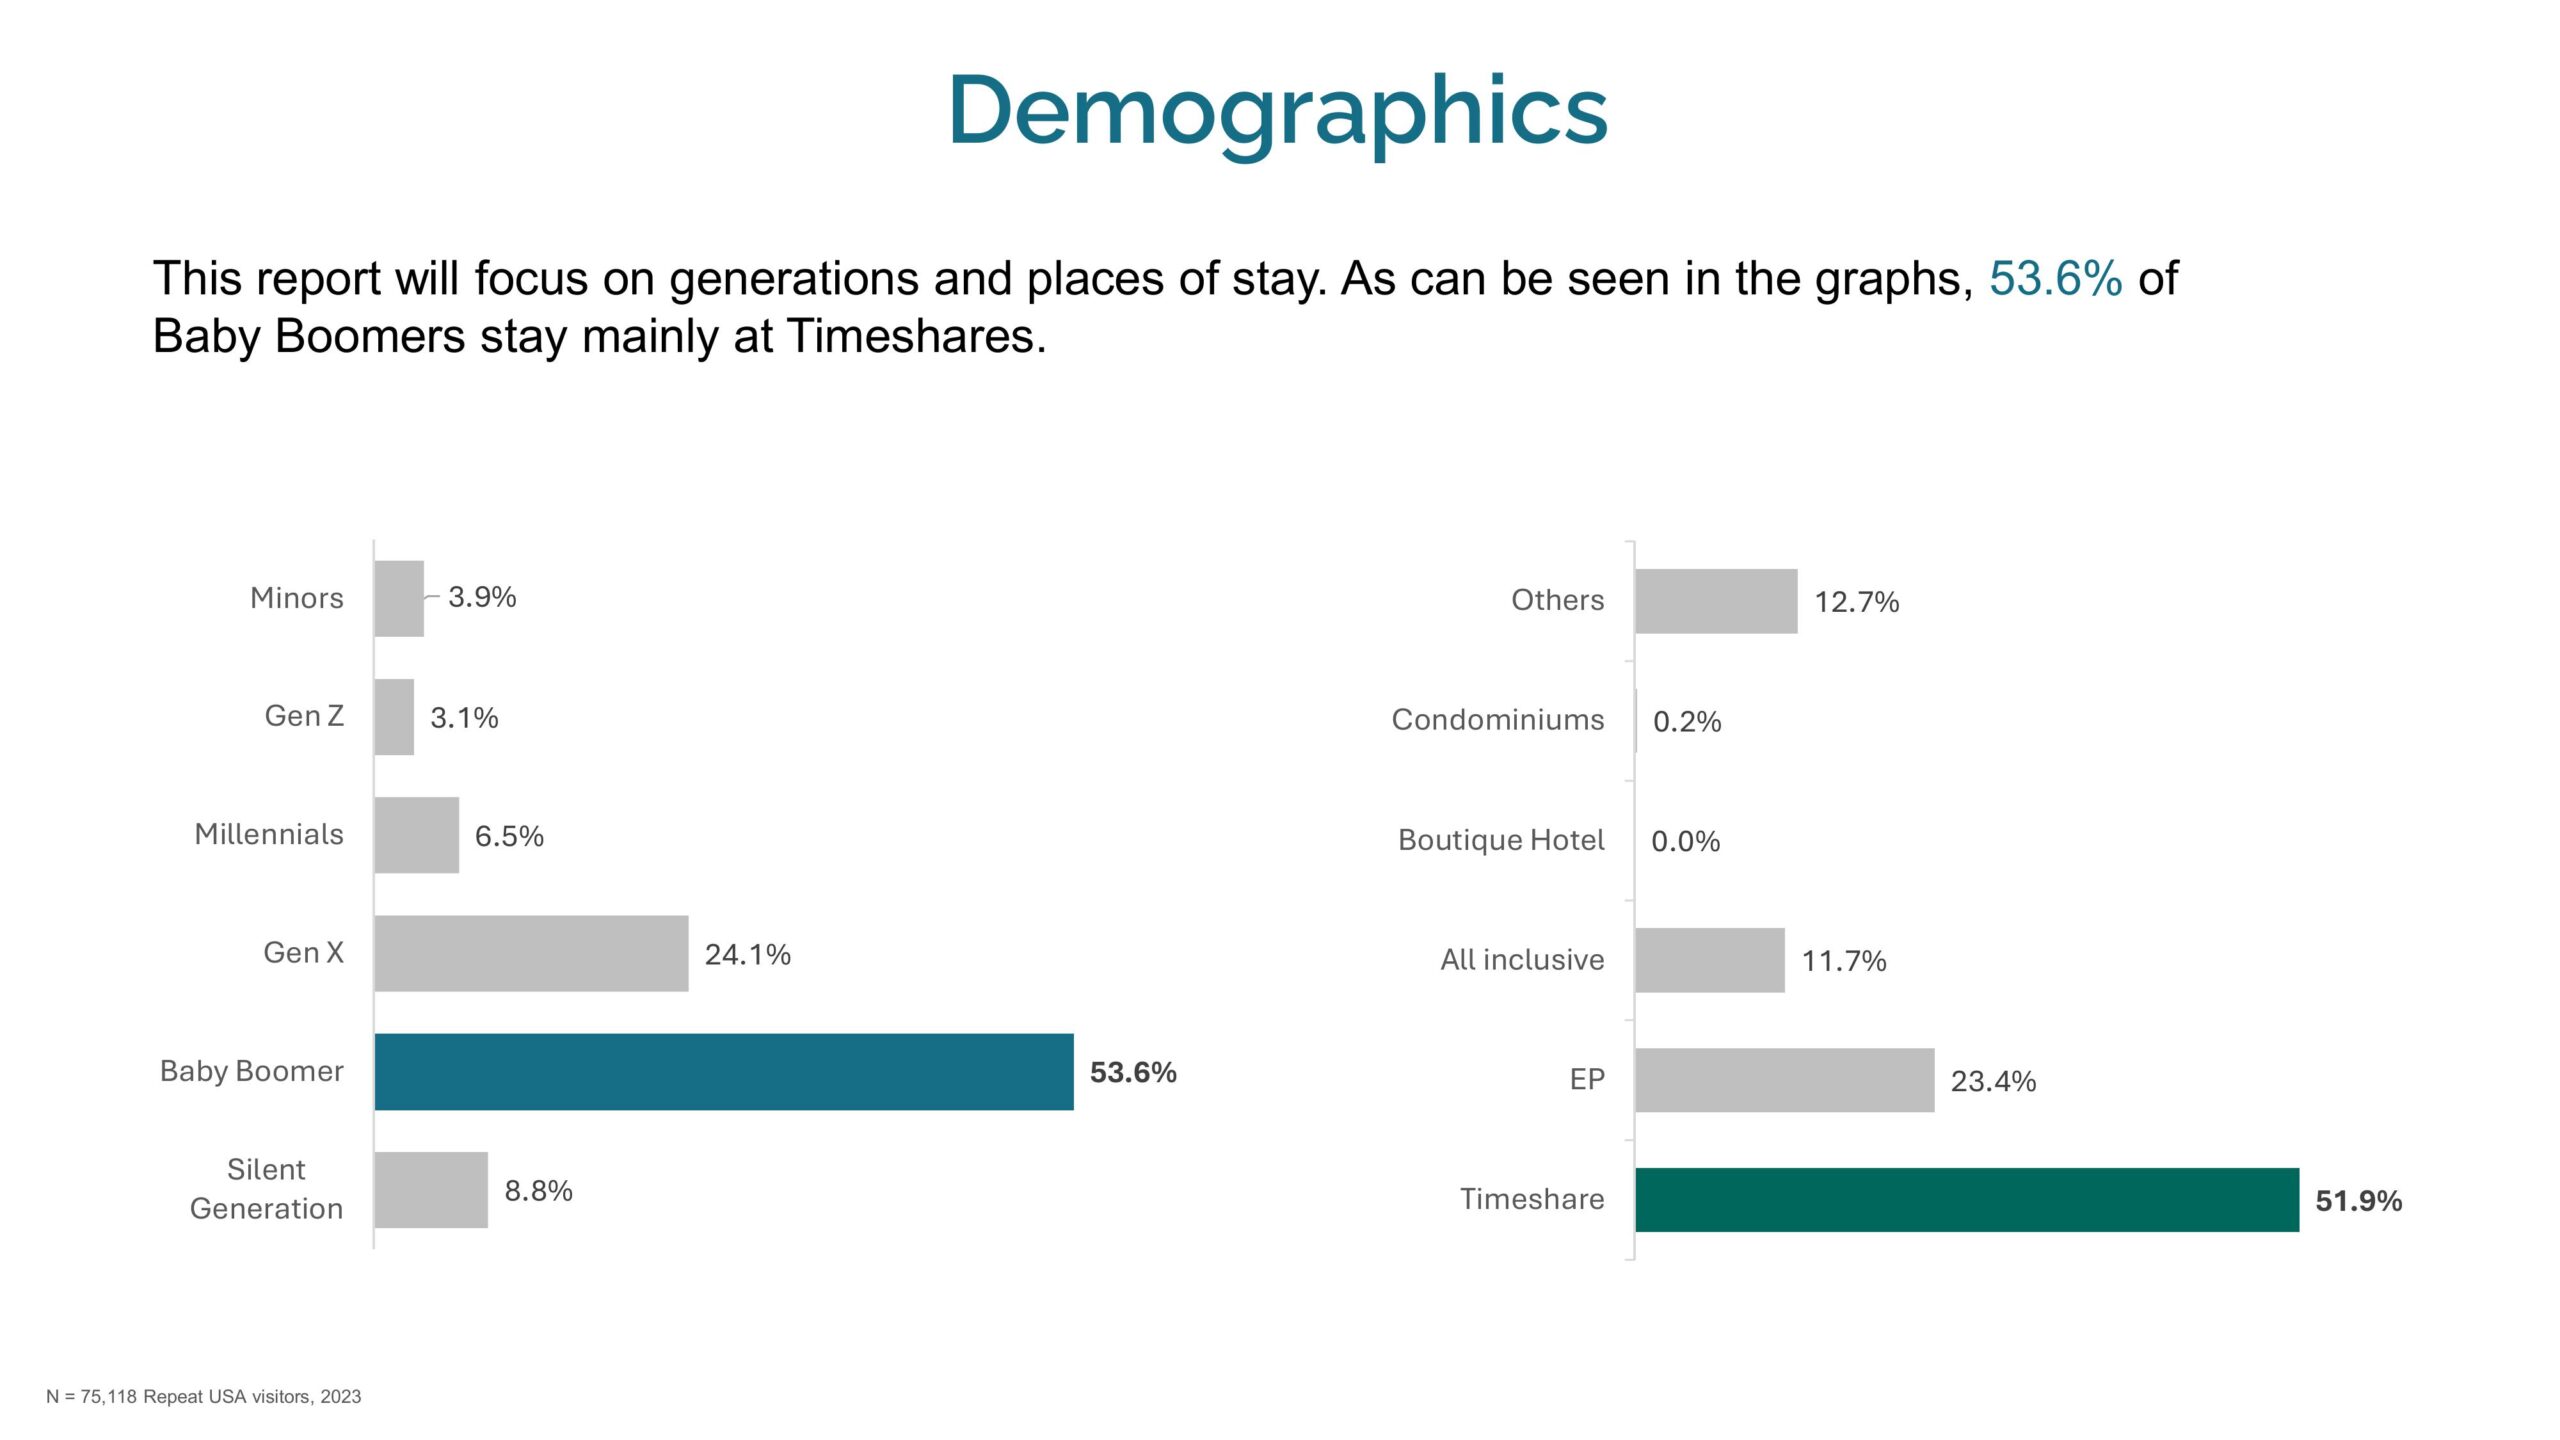
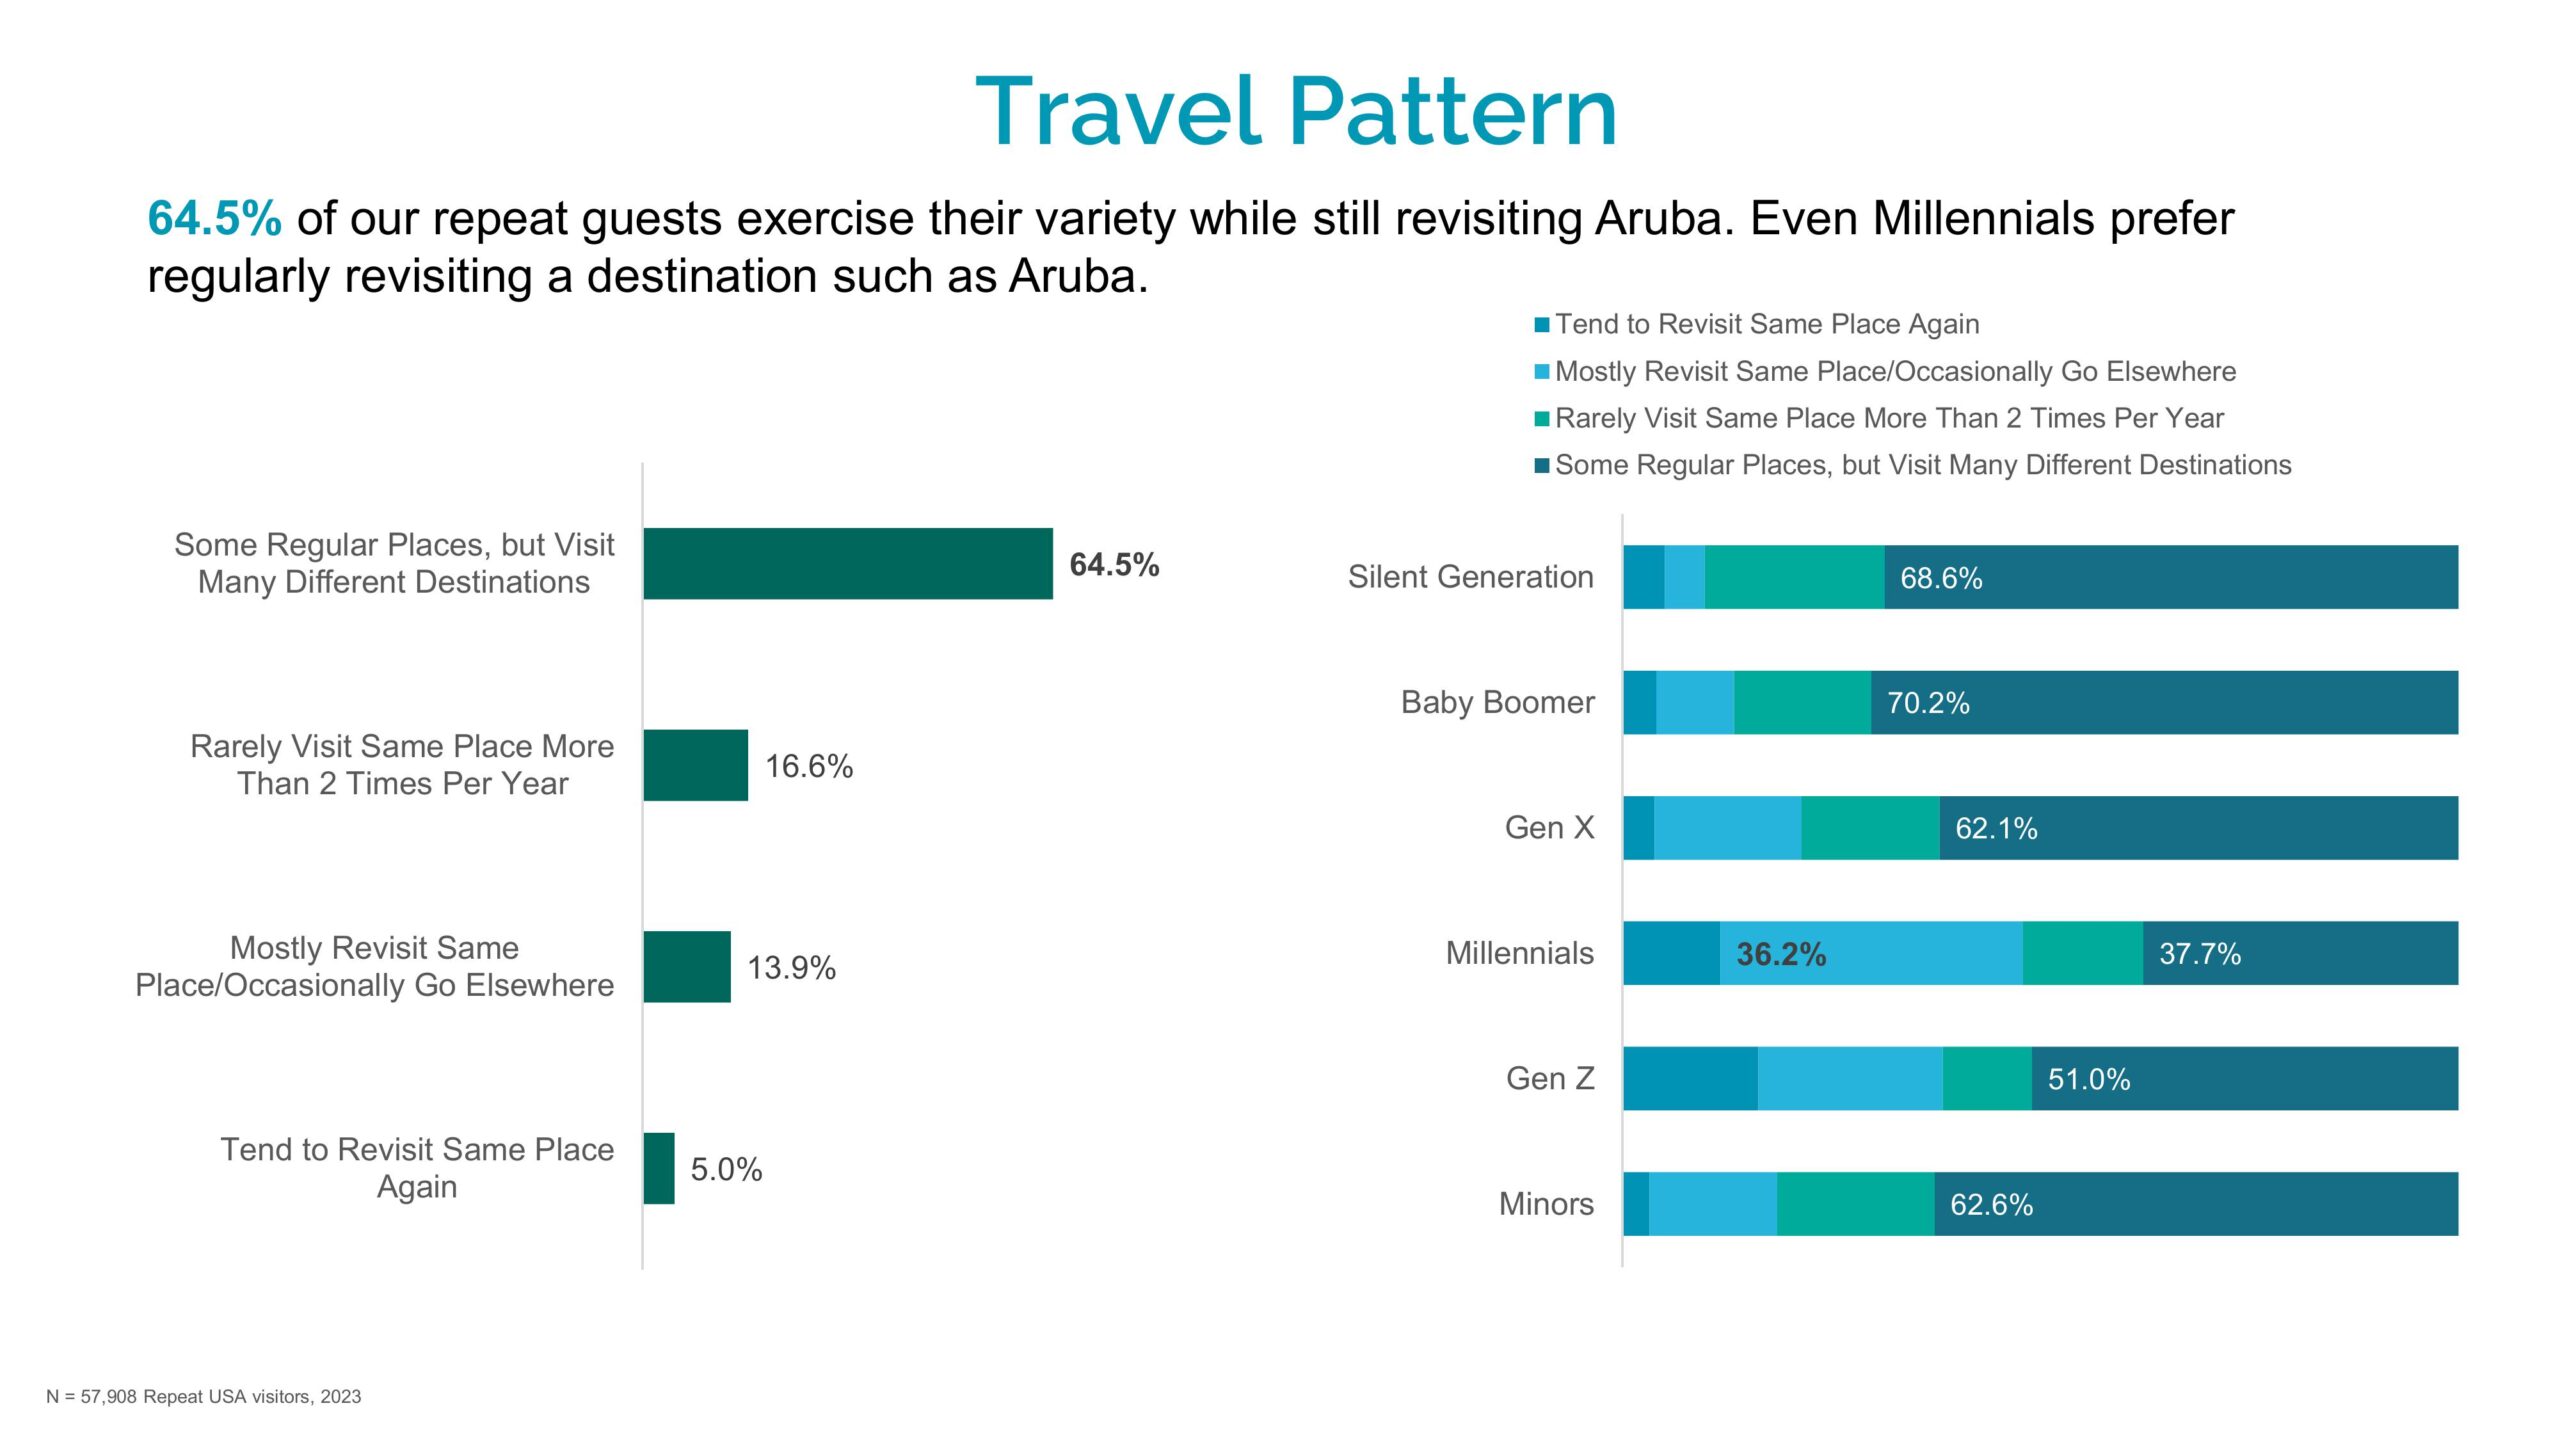
Visitor Demographics
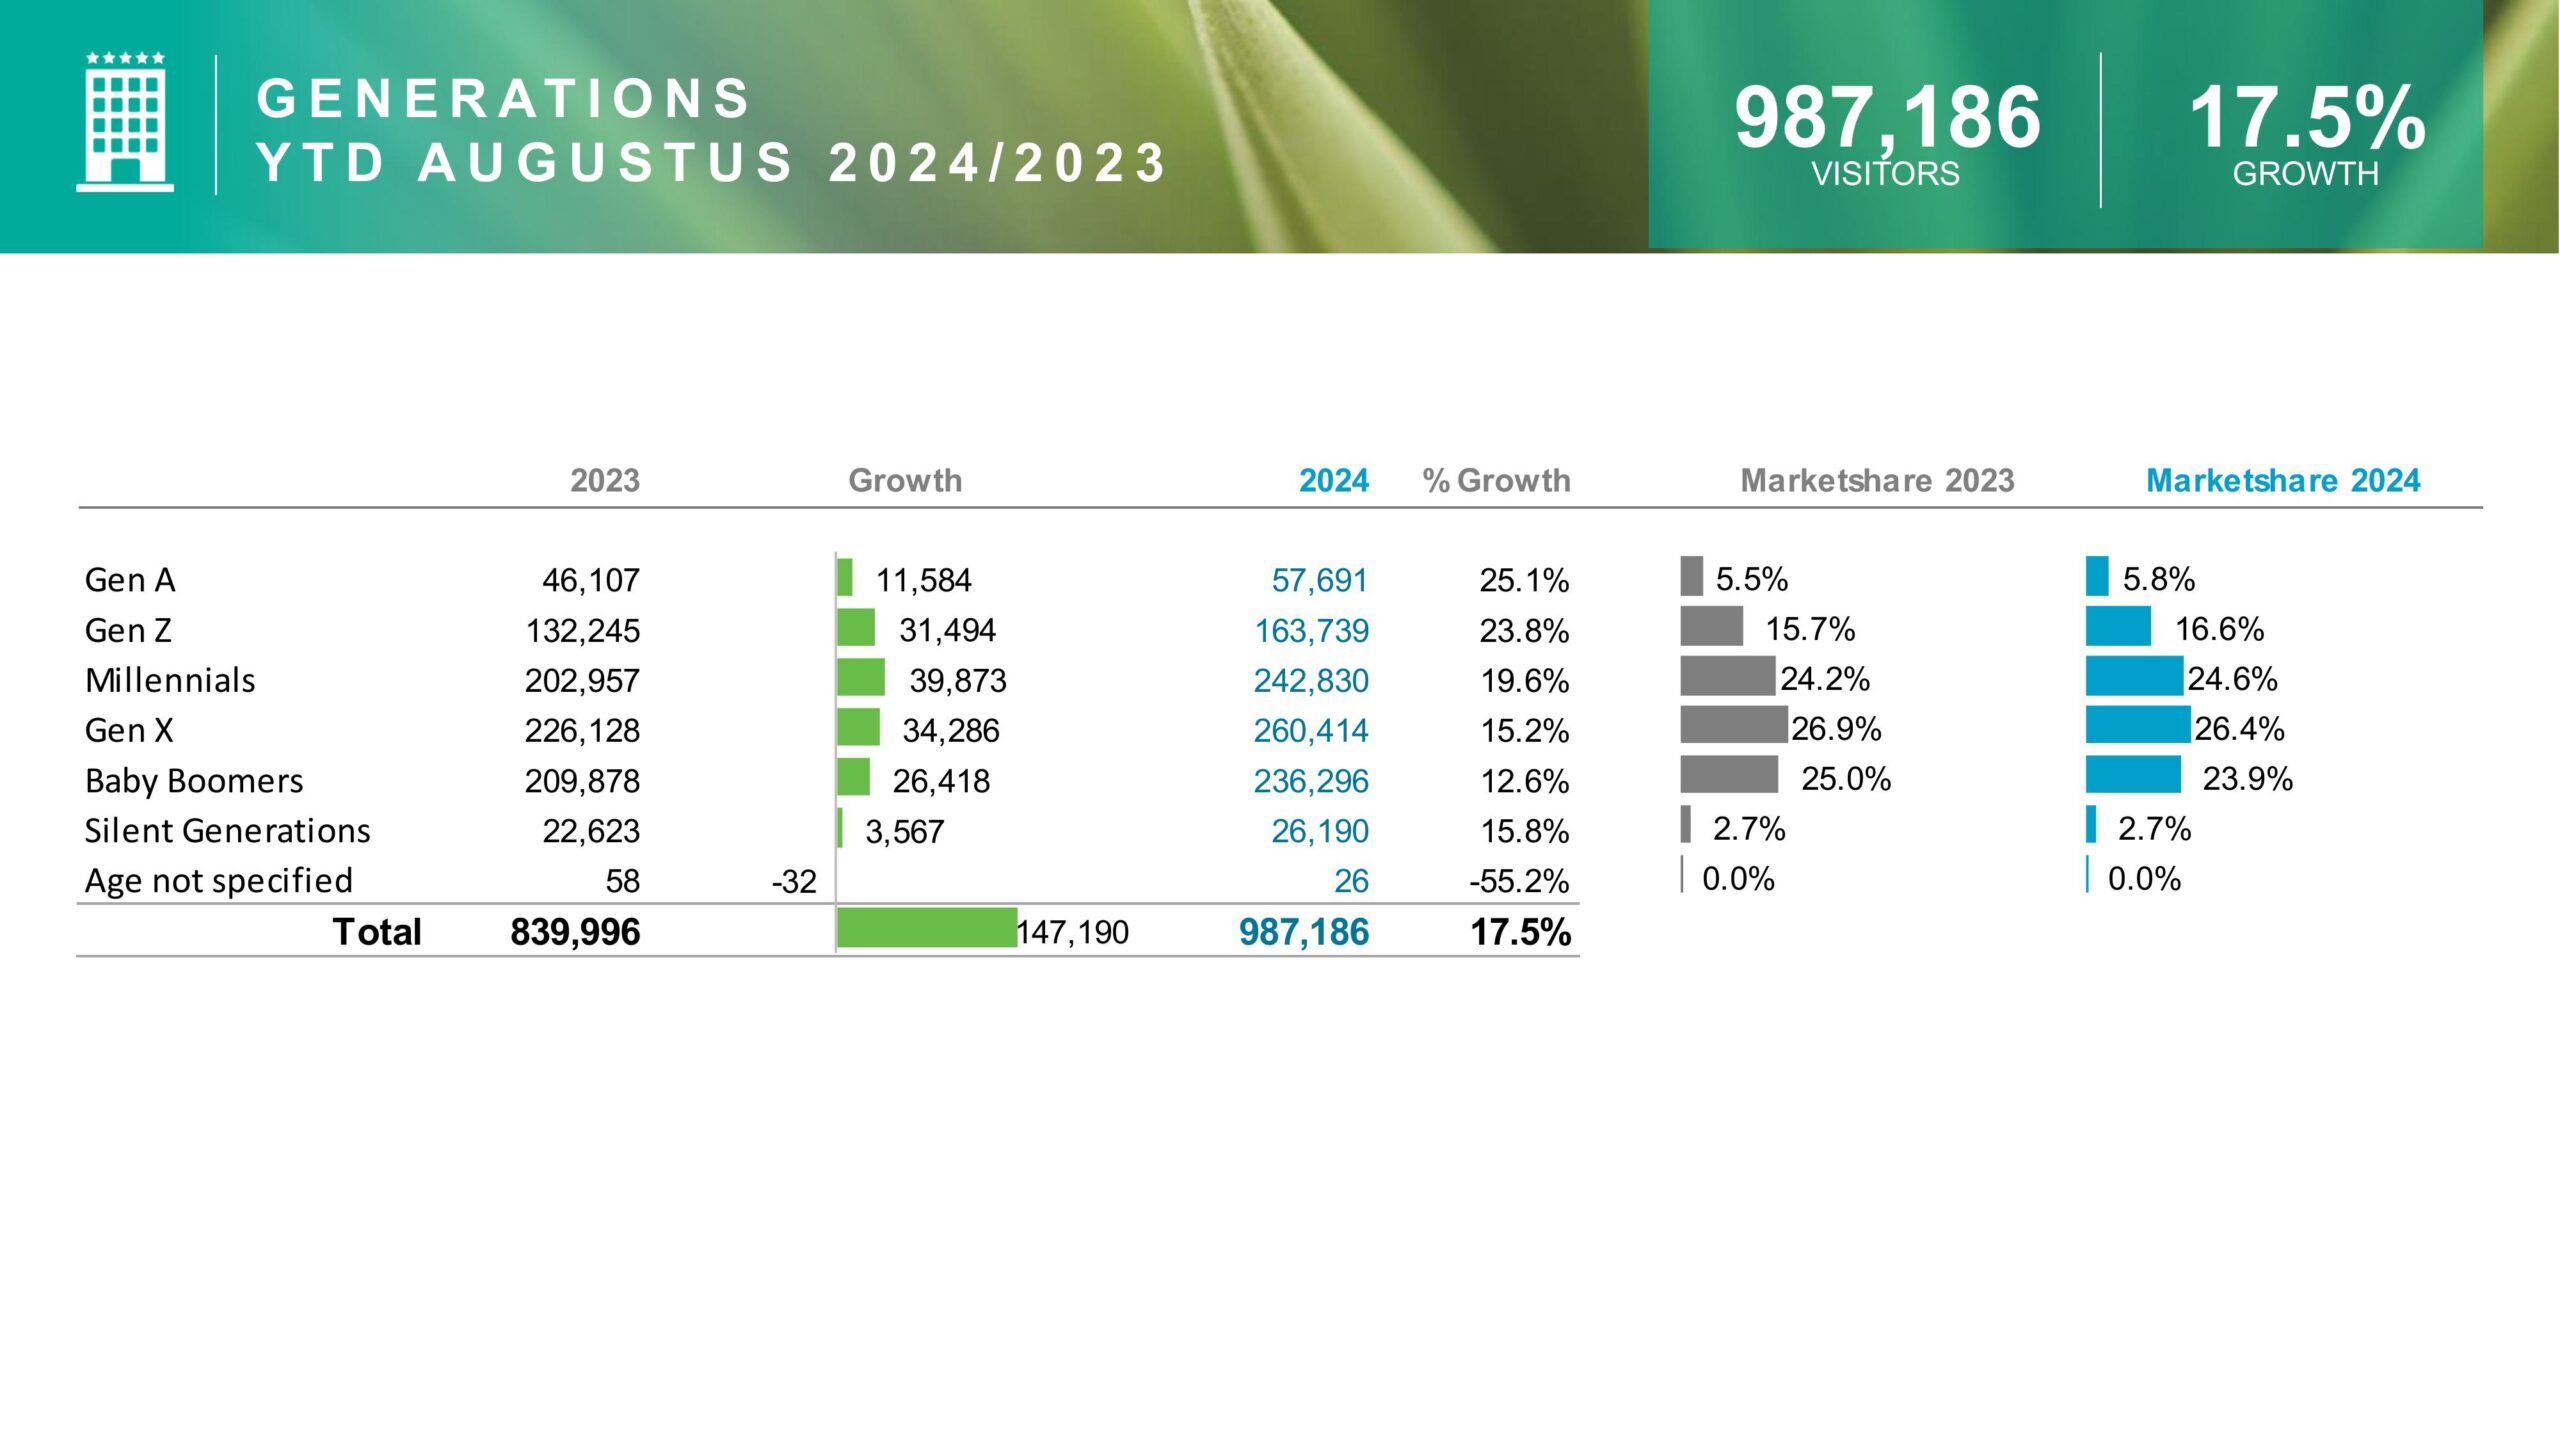
The report breaks down visitors by age and generation, shedding light on who is traveling to Aruba. The majority of visitors were from the 30-49 age range, which accounted for 33.5% of the total arrivals. Millennials and Generation X led the generational segments, representing 26.9% and 26.4% of visitors, respectively. These age groups have consistently shown a preference for Aruba’s welcoming environment and diverse activities.

Spending Patterns of Tourists
An important highlight of the Aruba Tourism August 2024 report is the spending patterns of visitors. The average spending for tourists varied by country, with the Netherlands showing the highest average at USD $835 per visitor. U.S. visitors, who made up the majority of the tourist demographic, spent an average of $699, contributing significantly to the local economy. South American visitors, particularly from Colombia and Brazil, also showed strong spending patterns, with averages of $403 and $685 respectively.
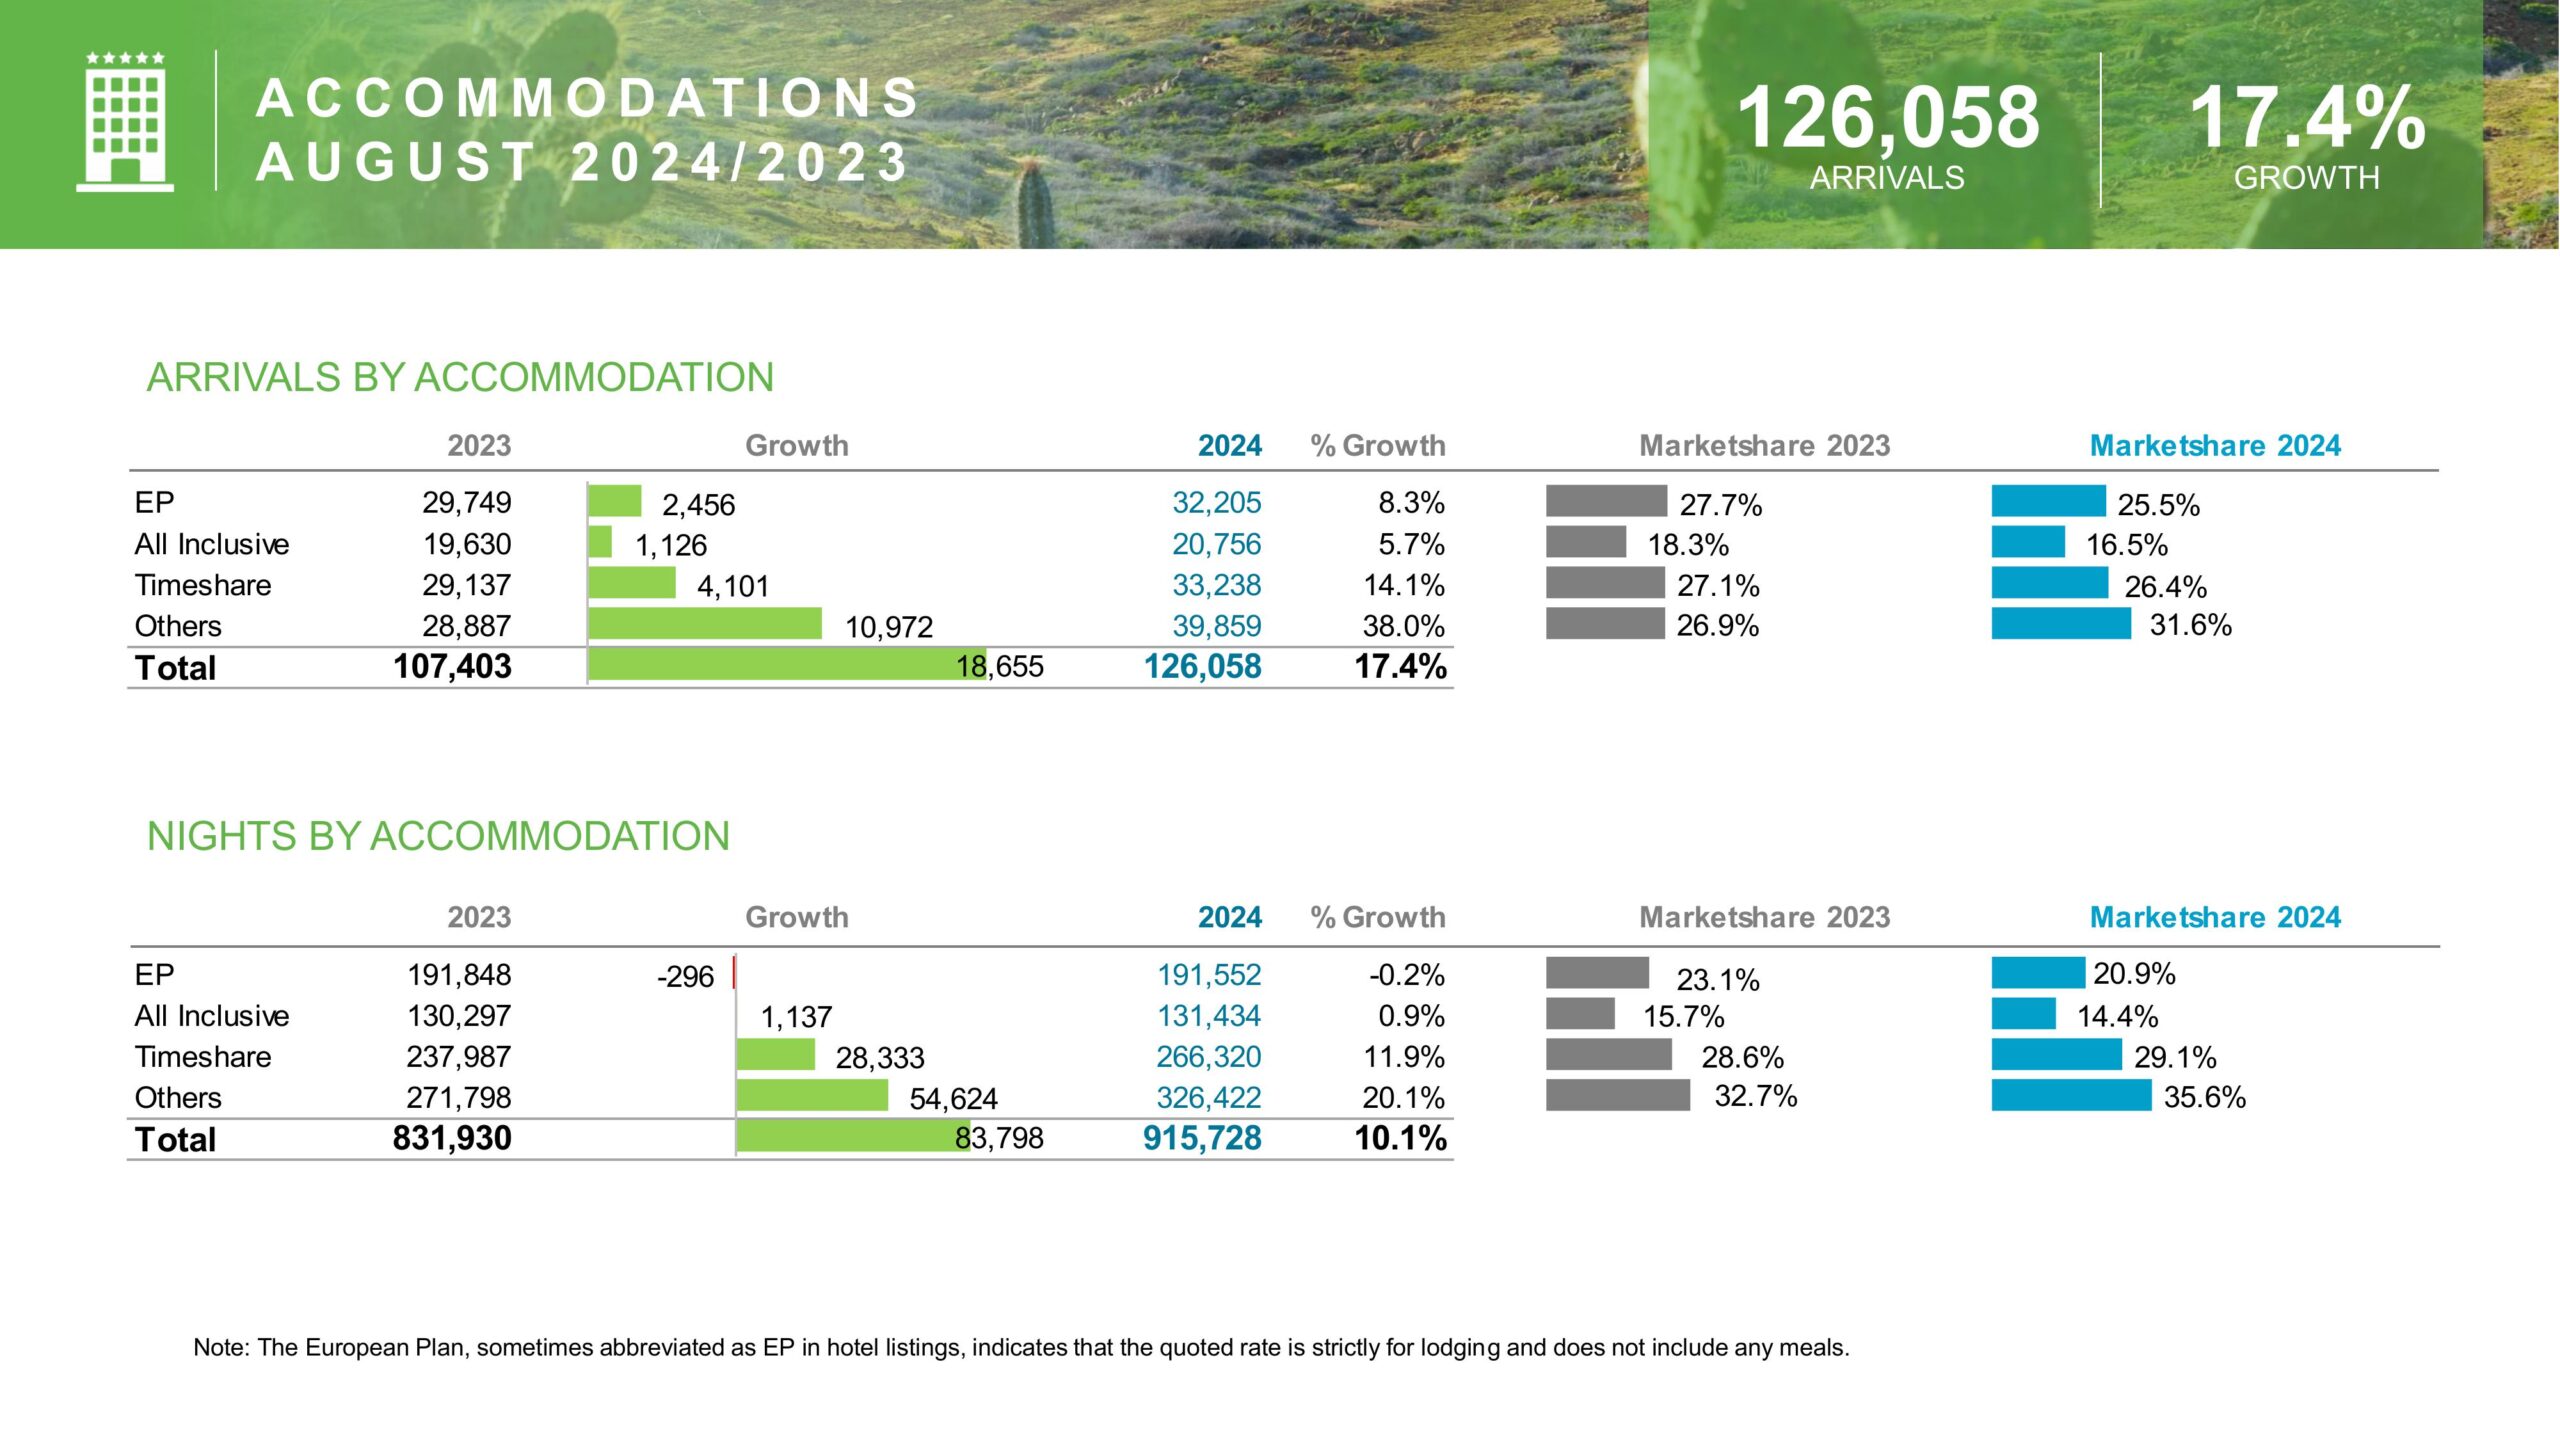
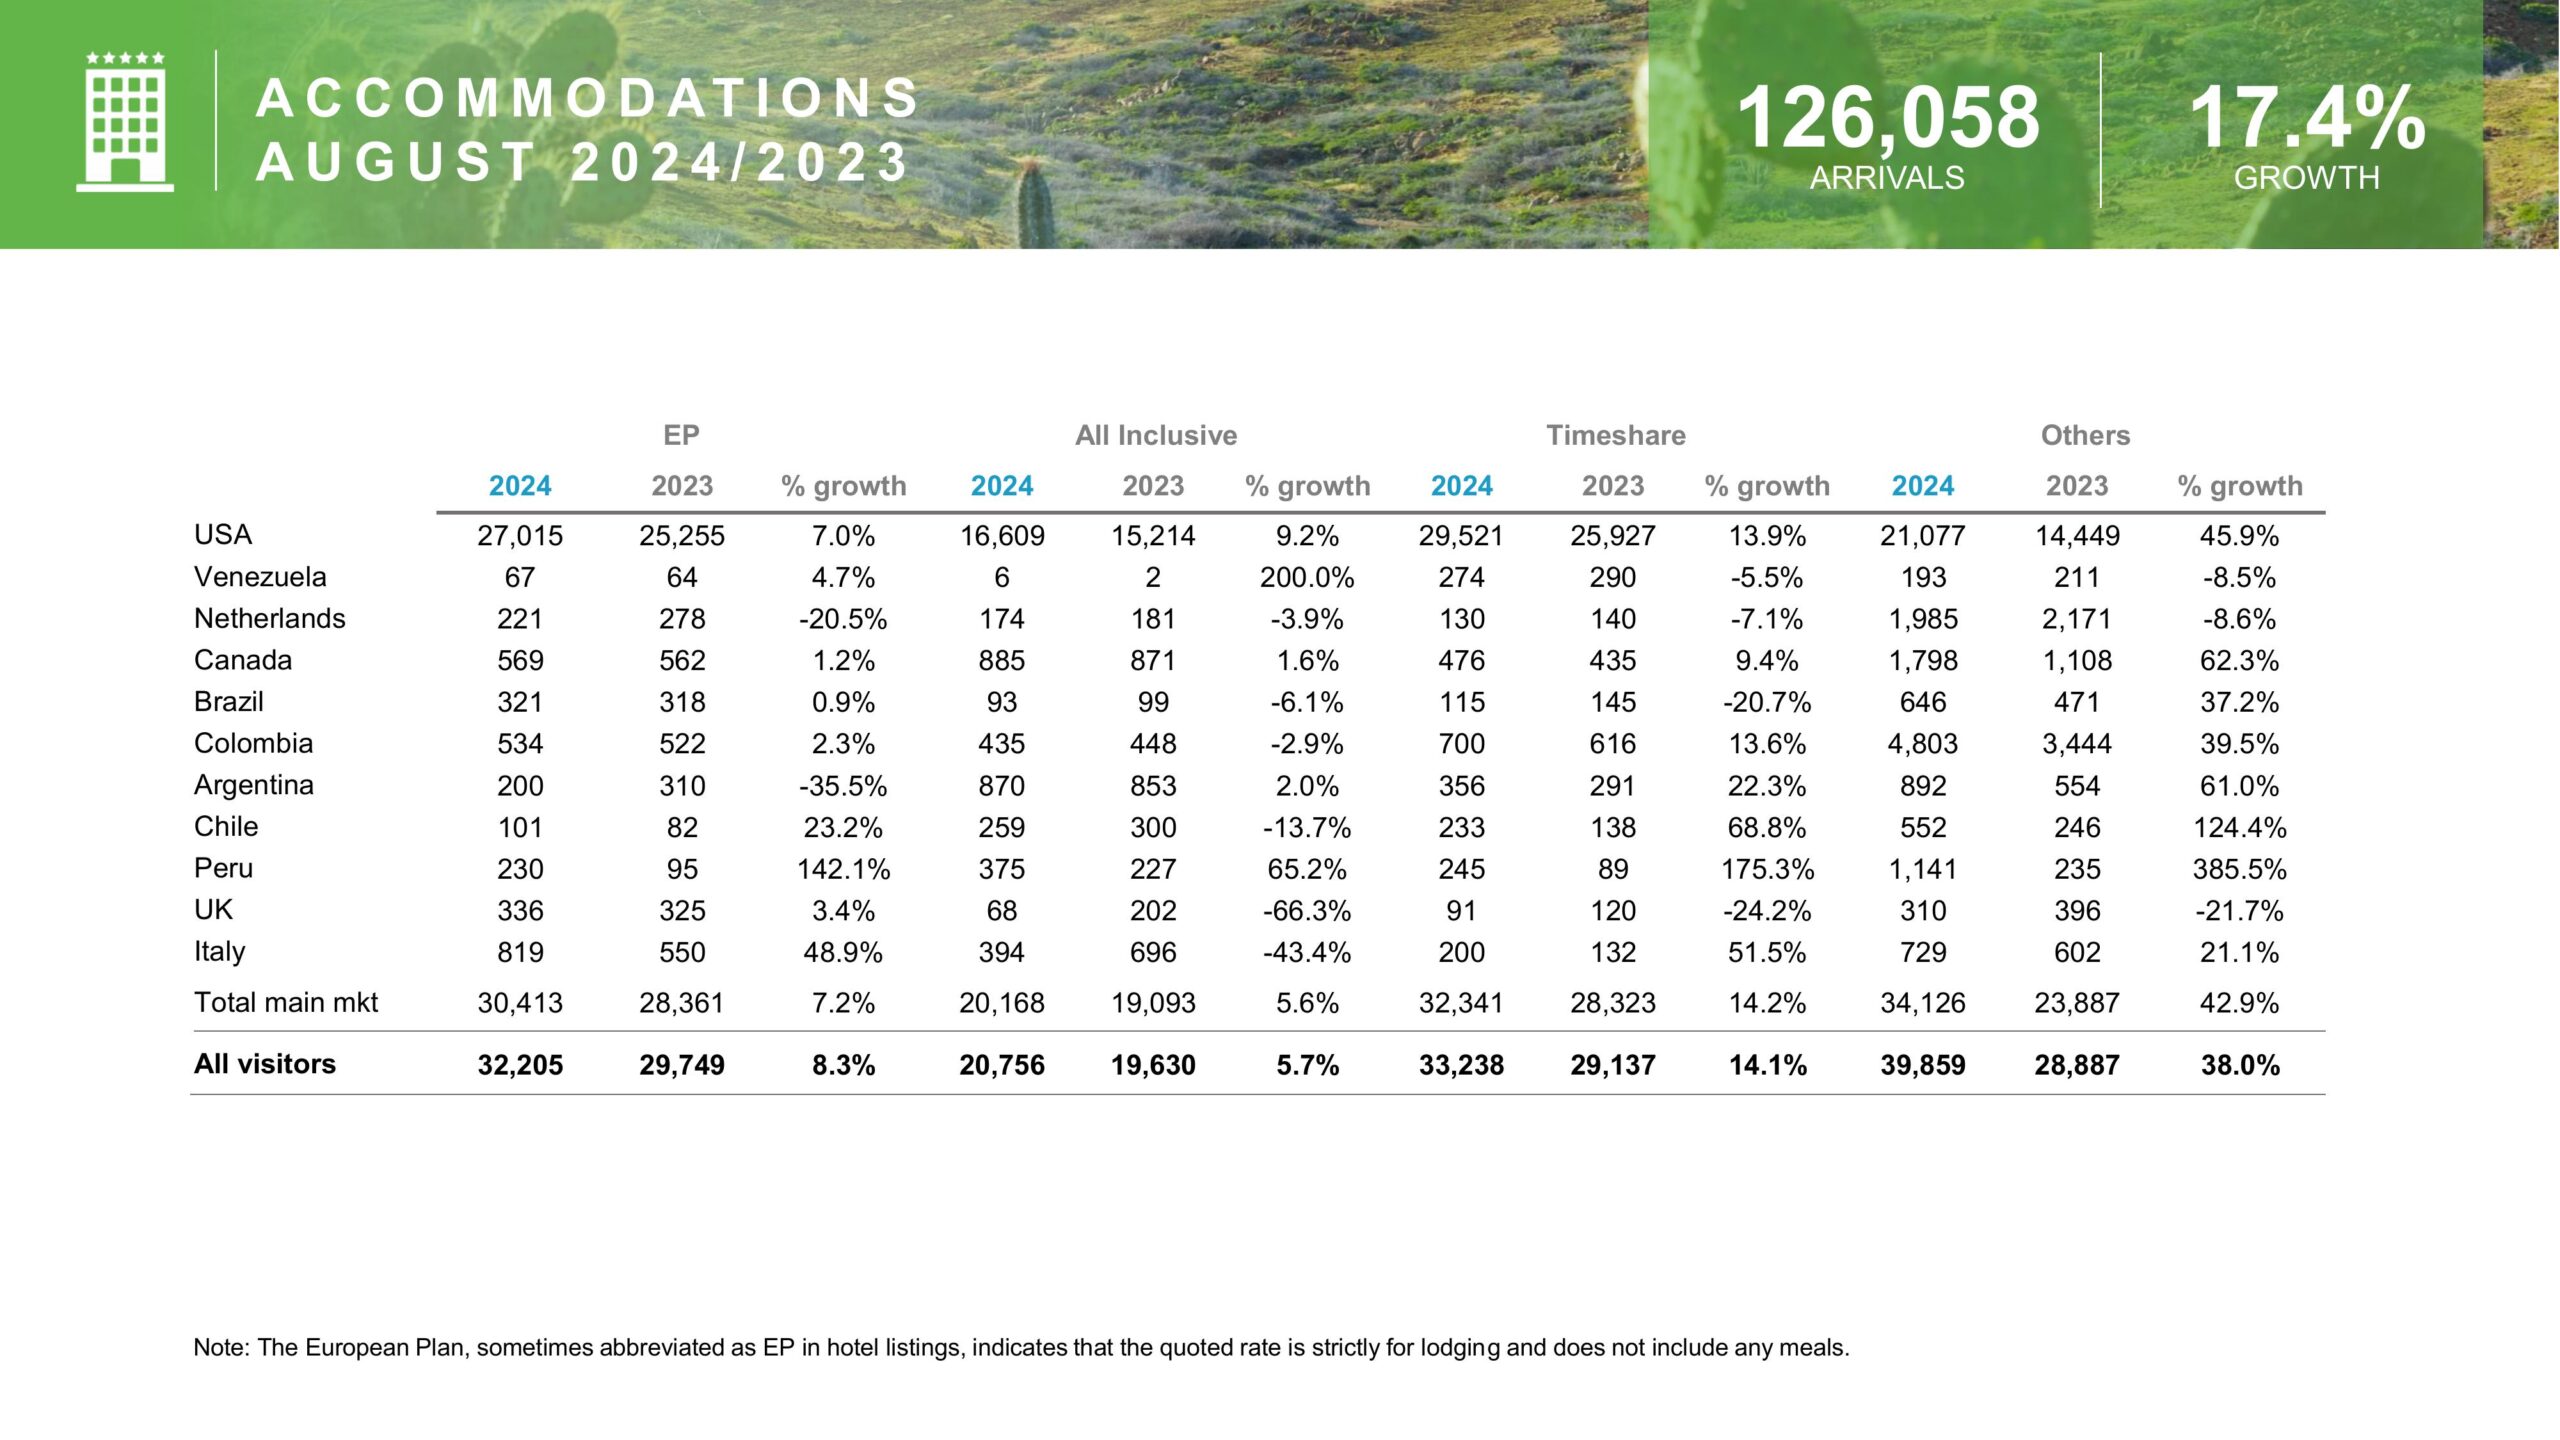
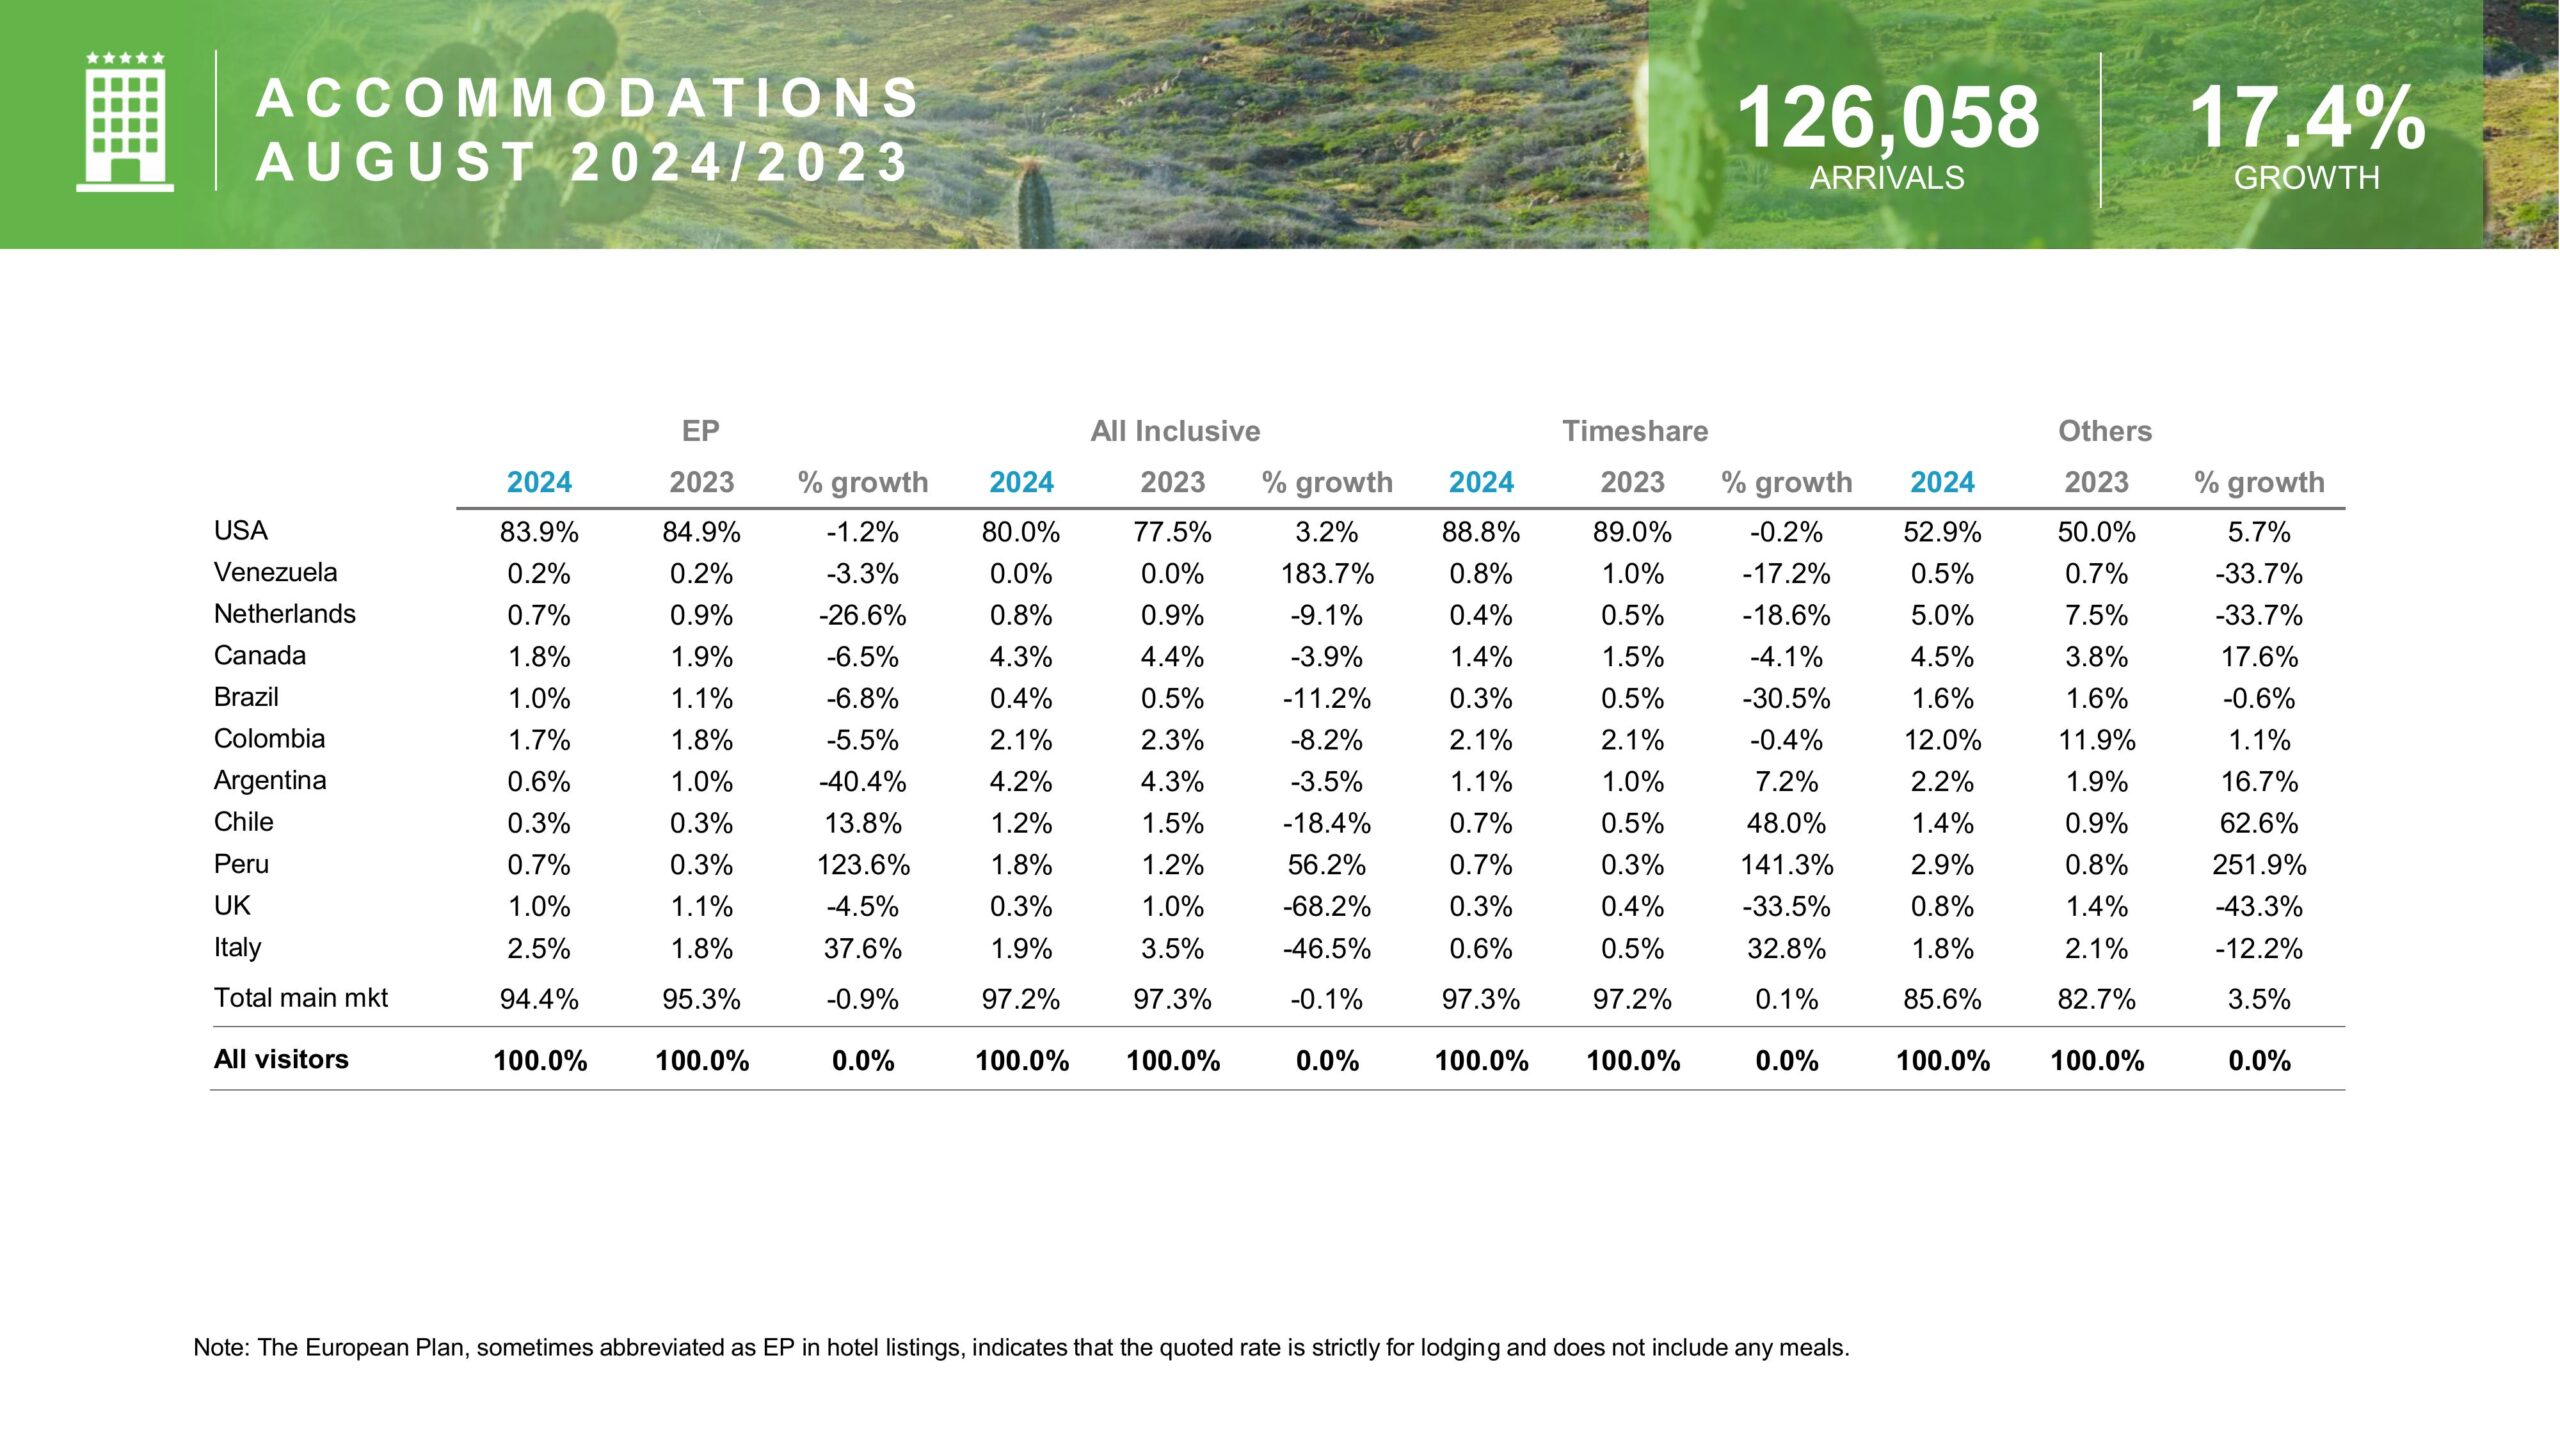
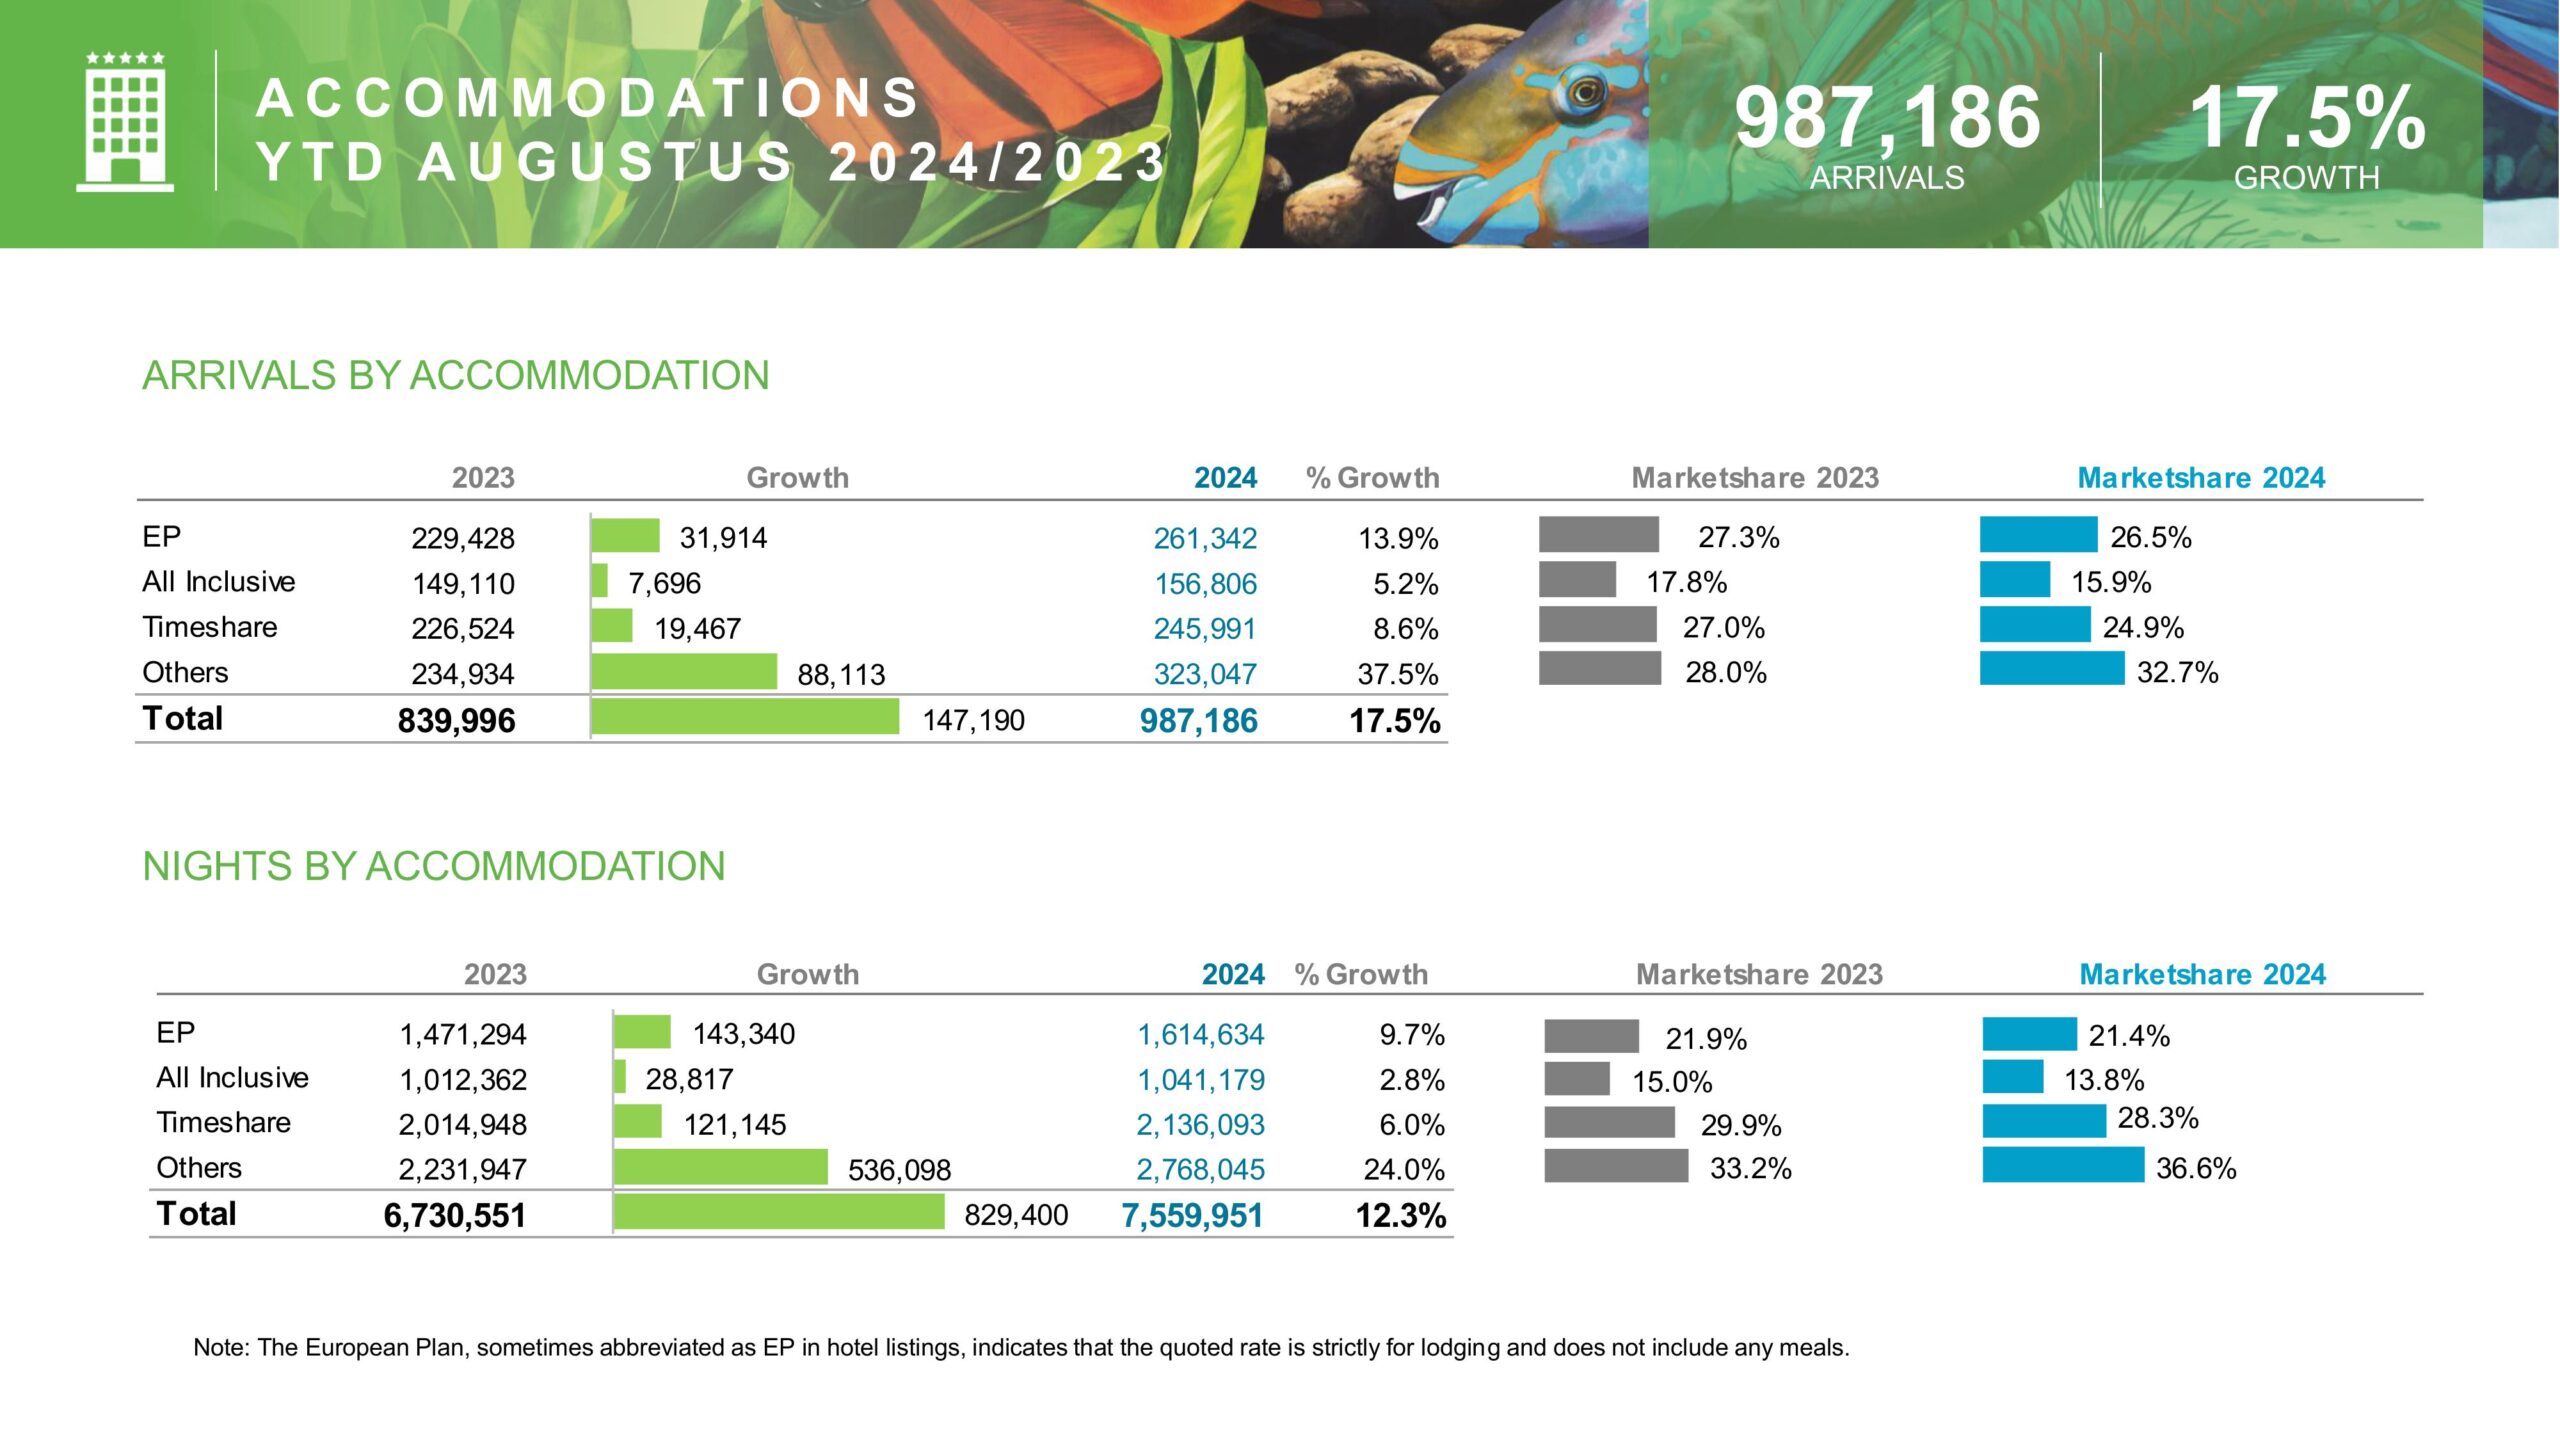
 Accommodation Preferences
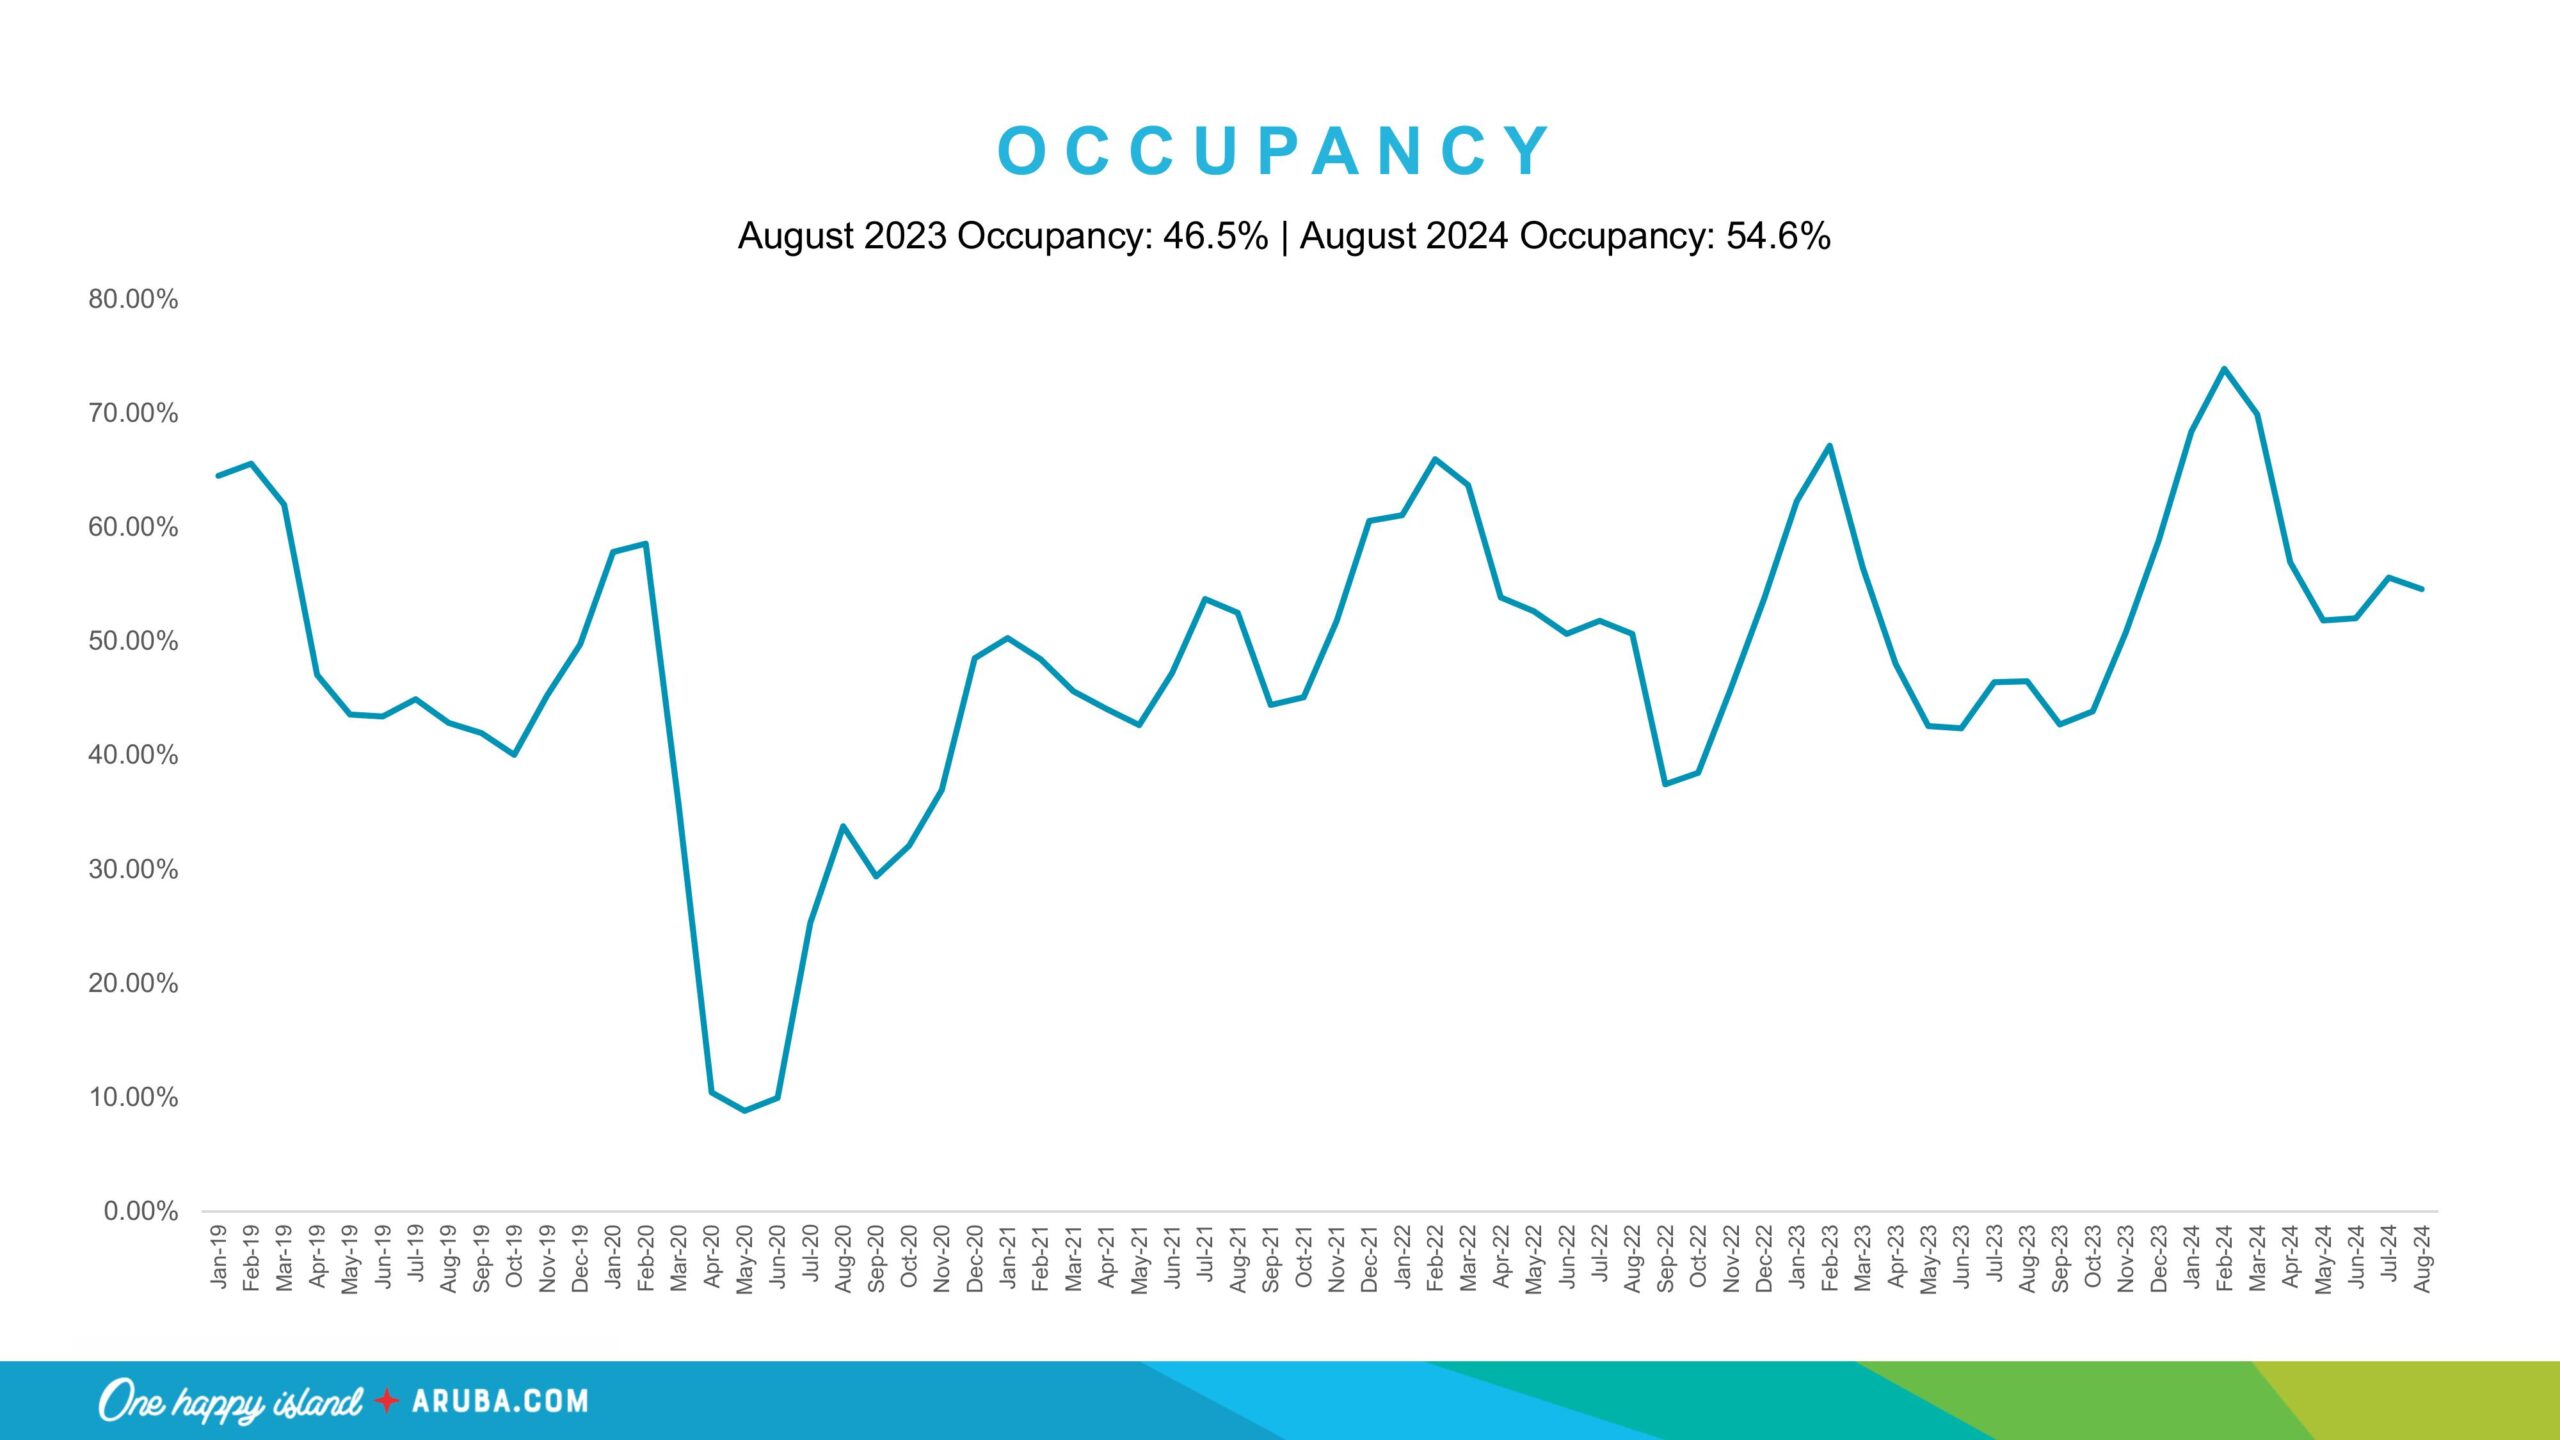
Accommodation trends in Aruba Tourism August 2024 data show shifts in how tourists are choosing to stay on the island. The share of all-inclusive resorts increased by 5.2%, while timeshare accommodations saw a 6.0% rise. The largest growth, however, was in the ‘other’ accommodation category, which includes private rentals and boutique hotels, seeing a 37.5% increase. These numbers reflect changing preferences among travelers, with more people opting for unique, customizable lodging experiences over traditional hotel stays.


Cruise Tourism Growth
The cruise sector also contributed to Aruba’s tourism boom in August 2024. The number of cruise passengers increased by 13.3%, with over 621,000 visitors arriving via cruise ships. This surge was accompanied by a 7.8% rise in the number of cruise calls, totaling 222 calls during the year-to-date period. The increase in cruise tourism demonstrates Aruba’s expanding appeal to a diverse range of travelers seeking a combination of adventure and leisure.
 Reasons for Visiting Aruba
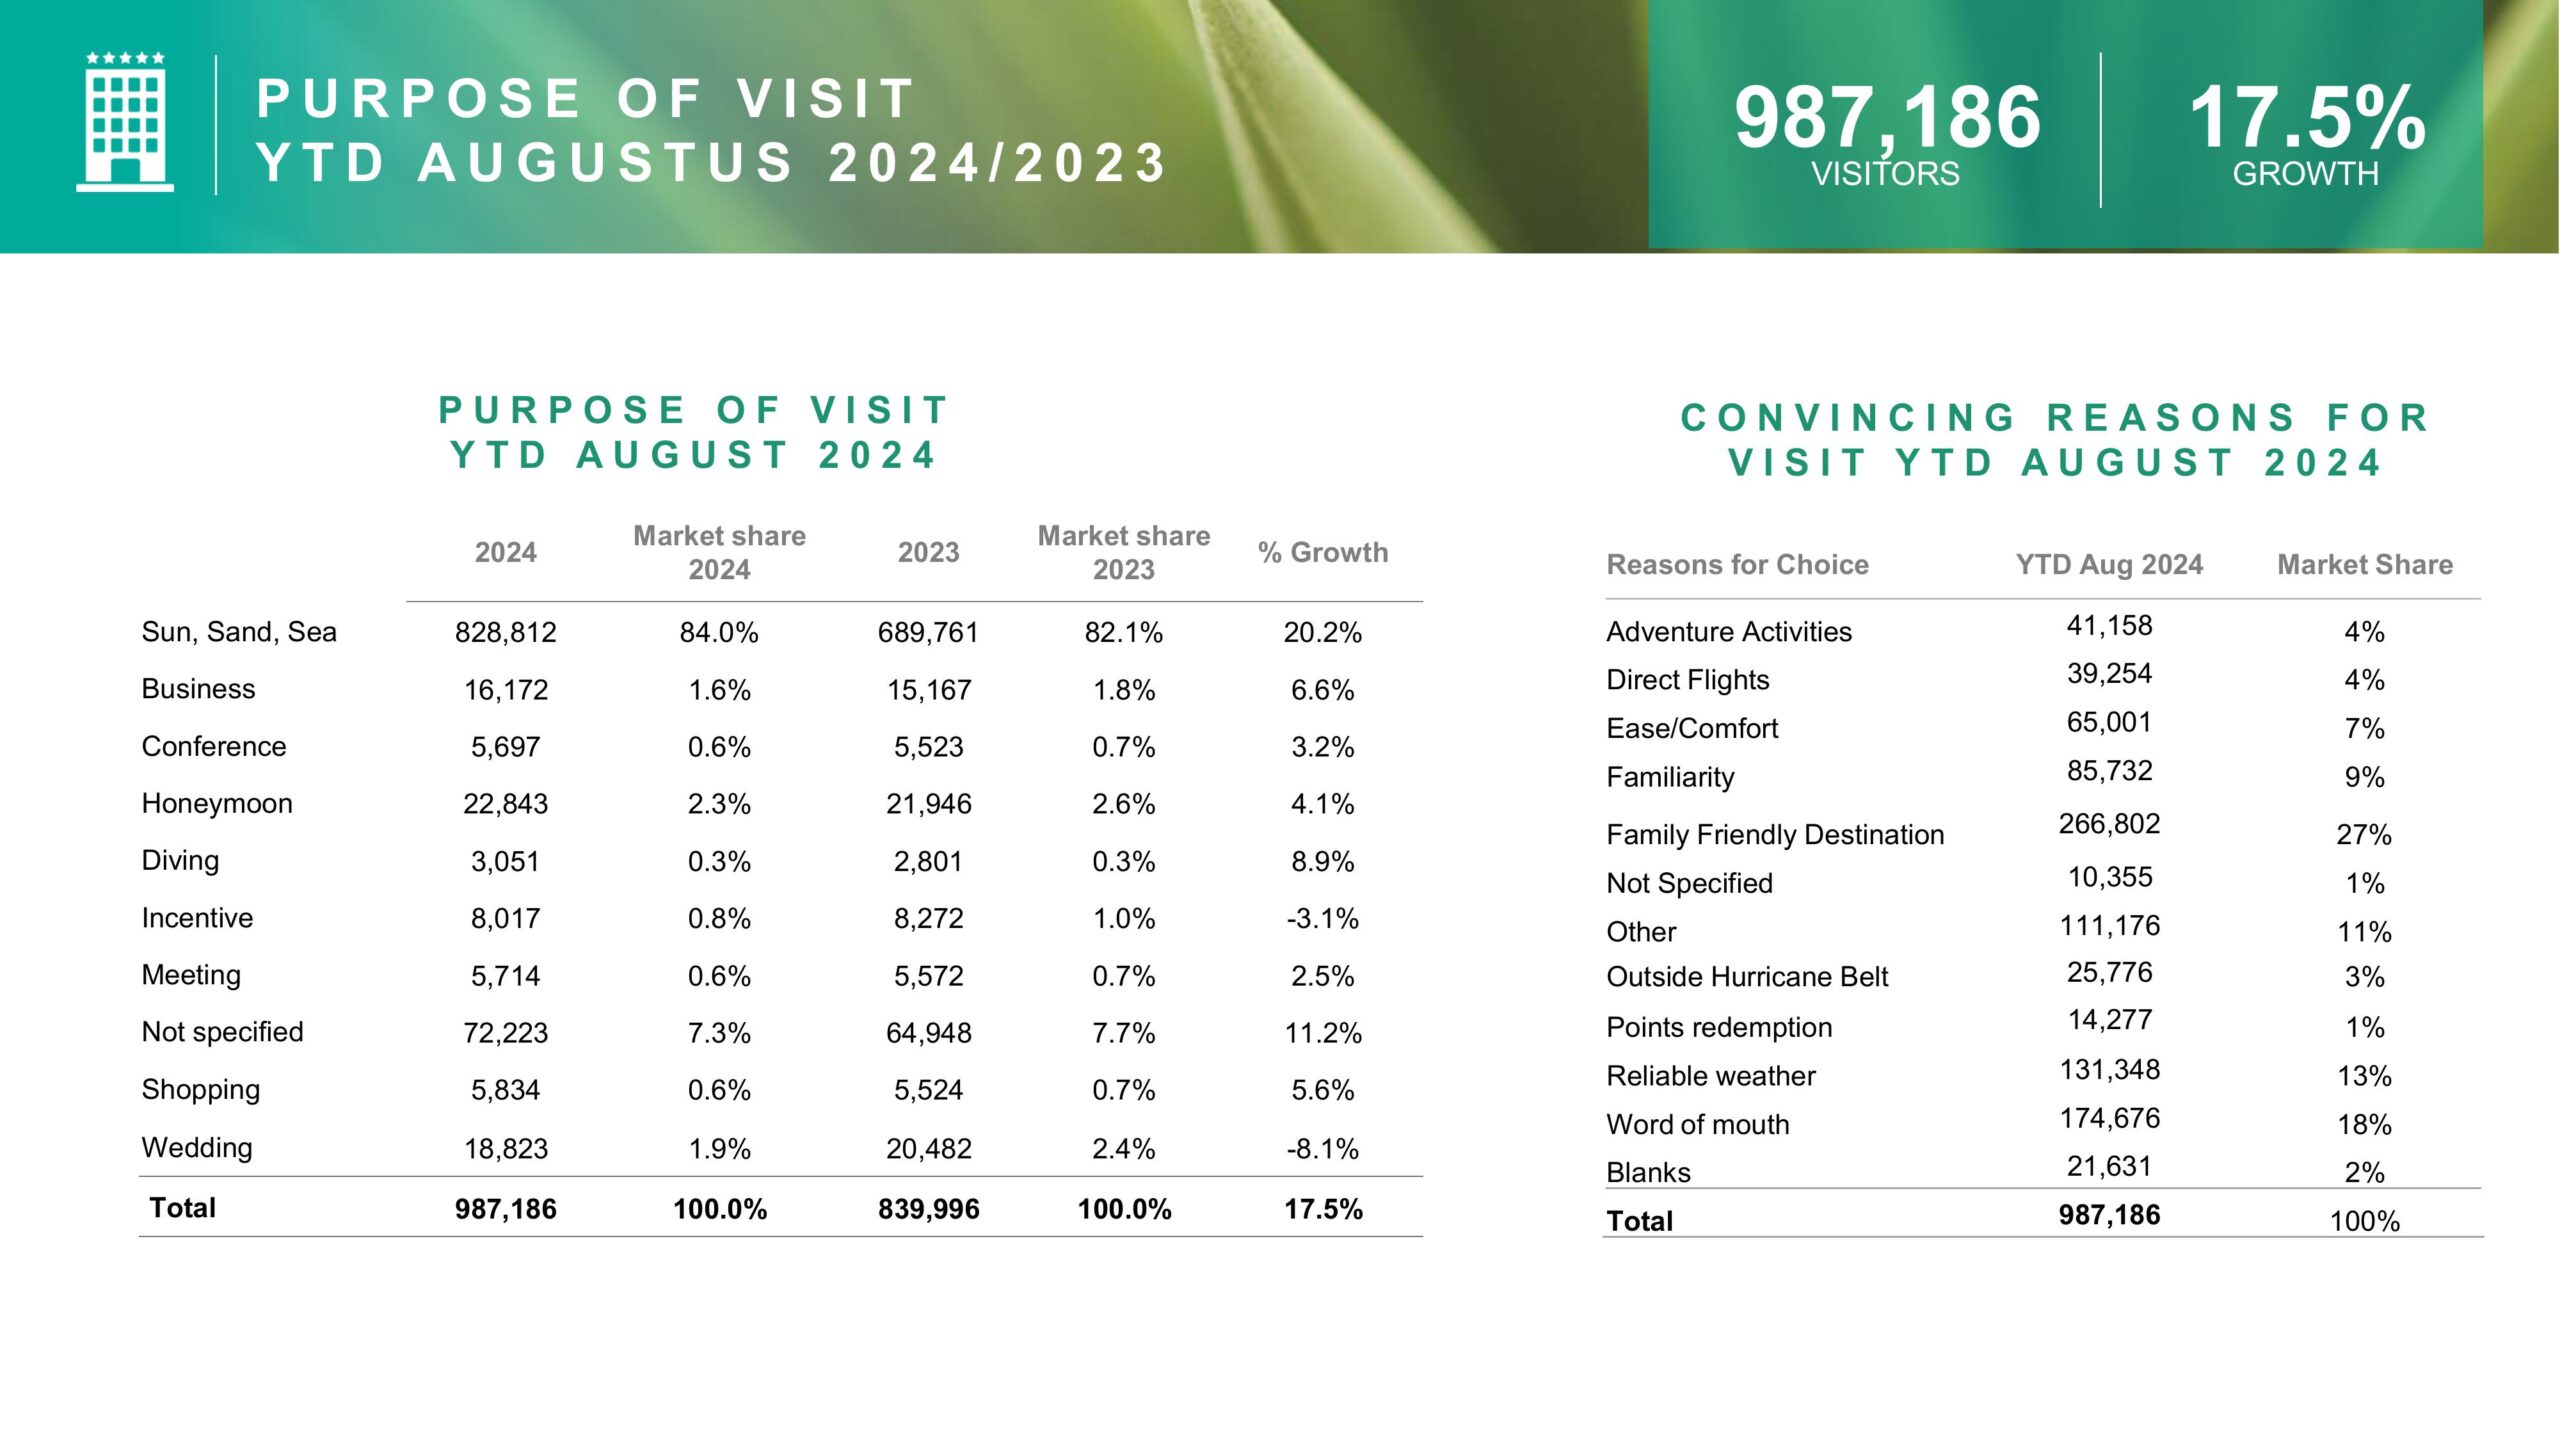
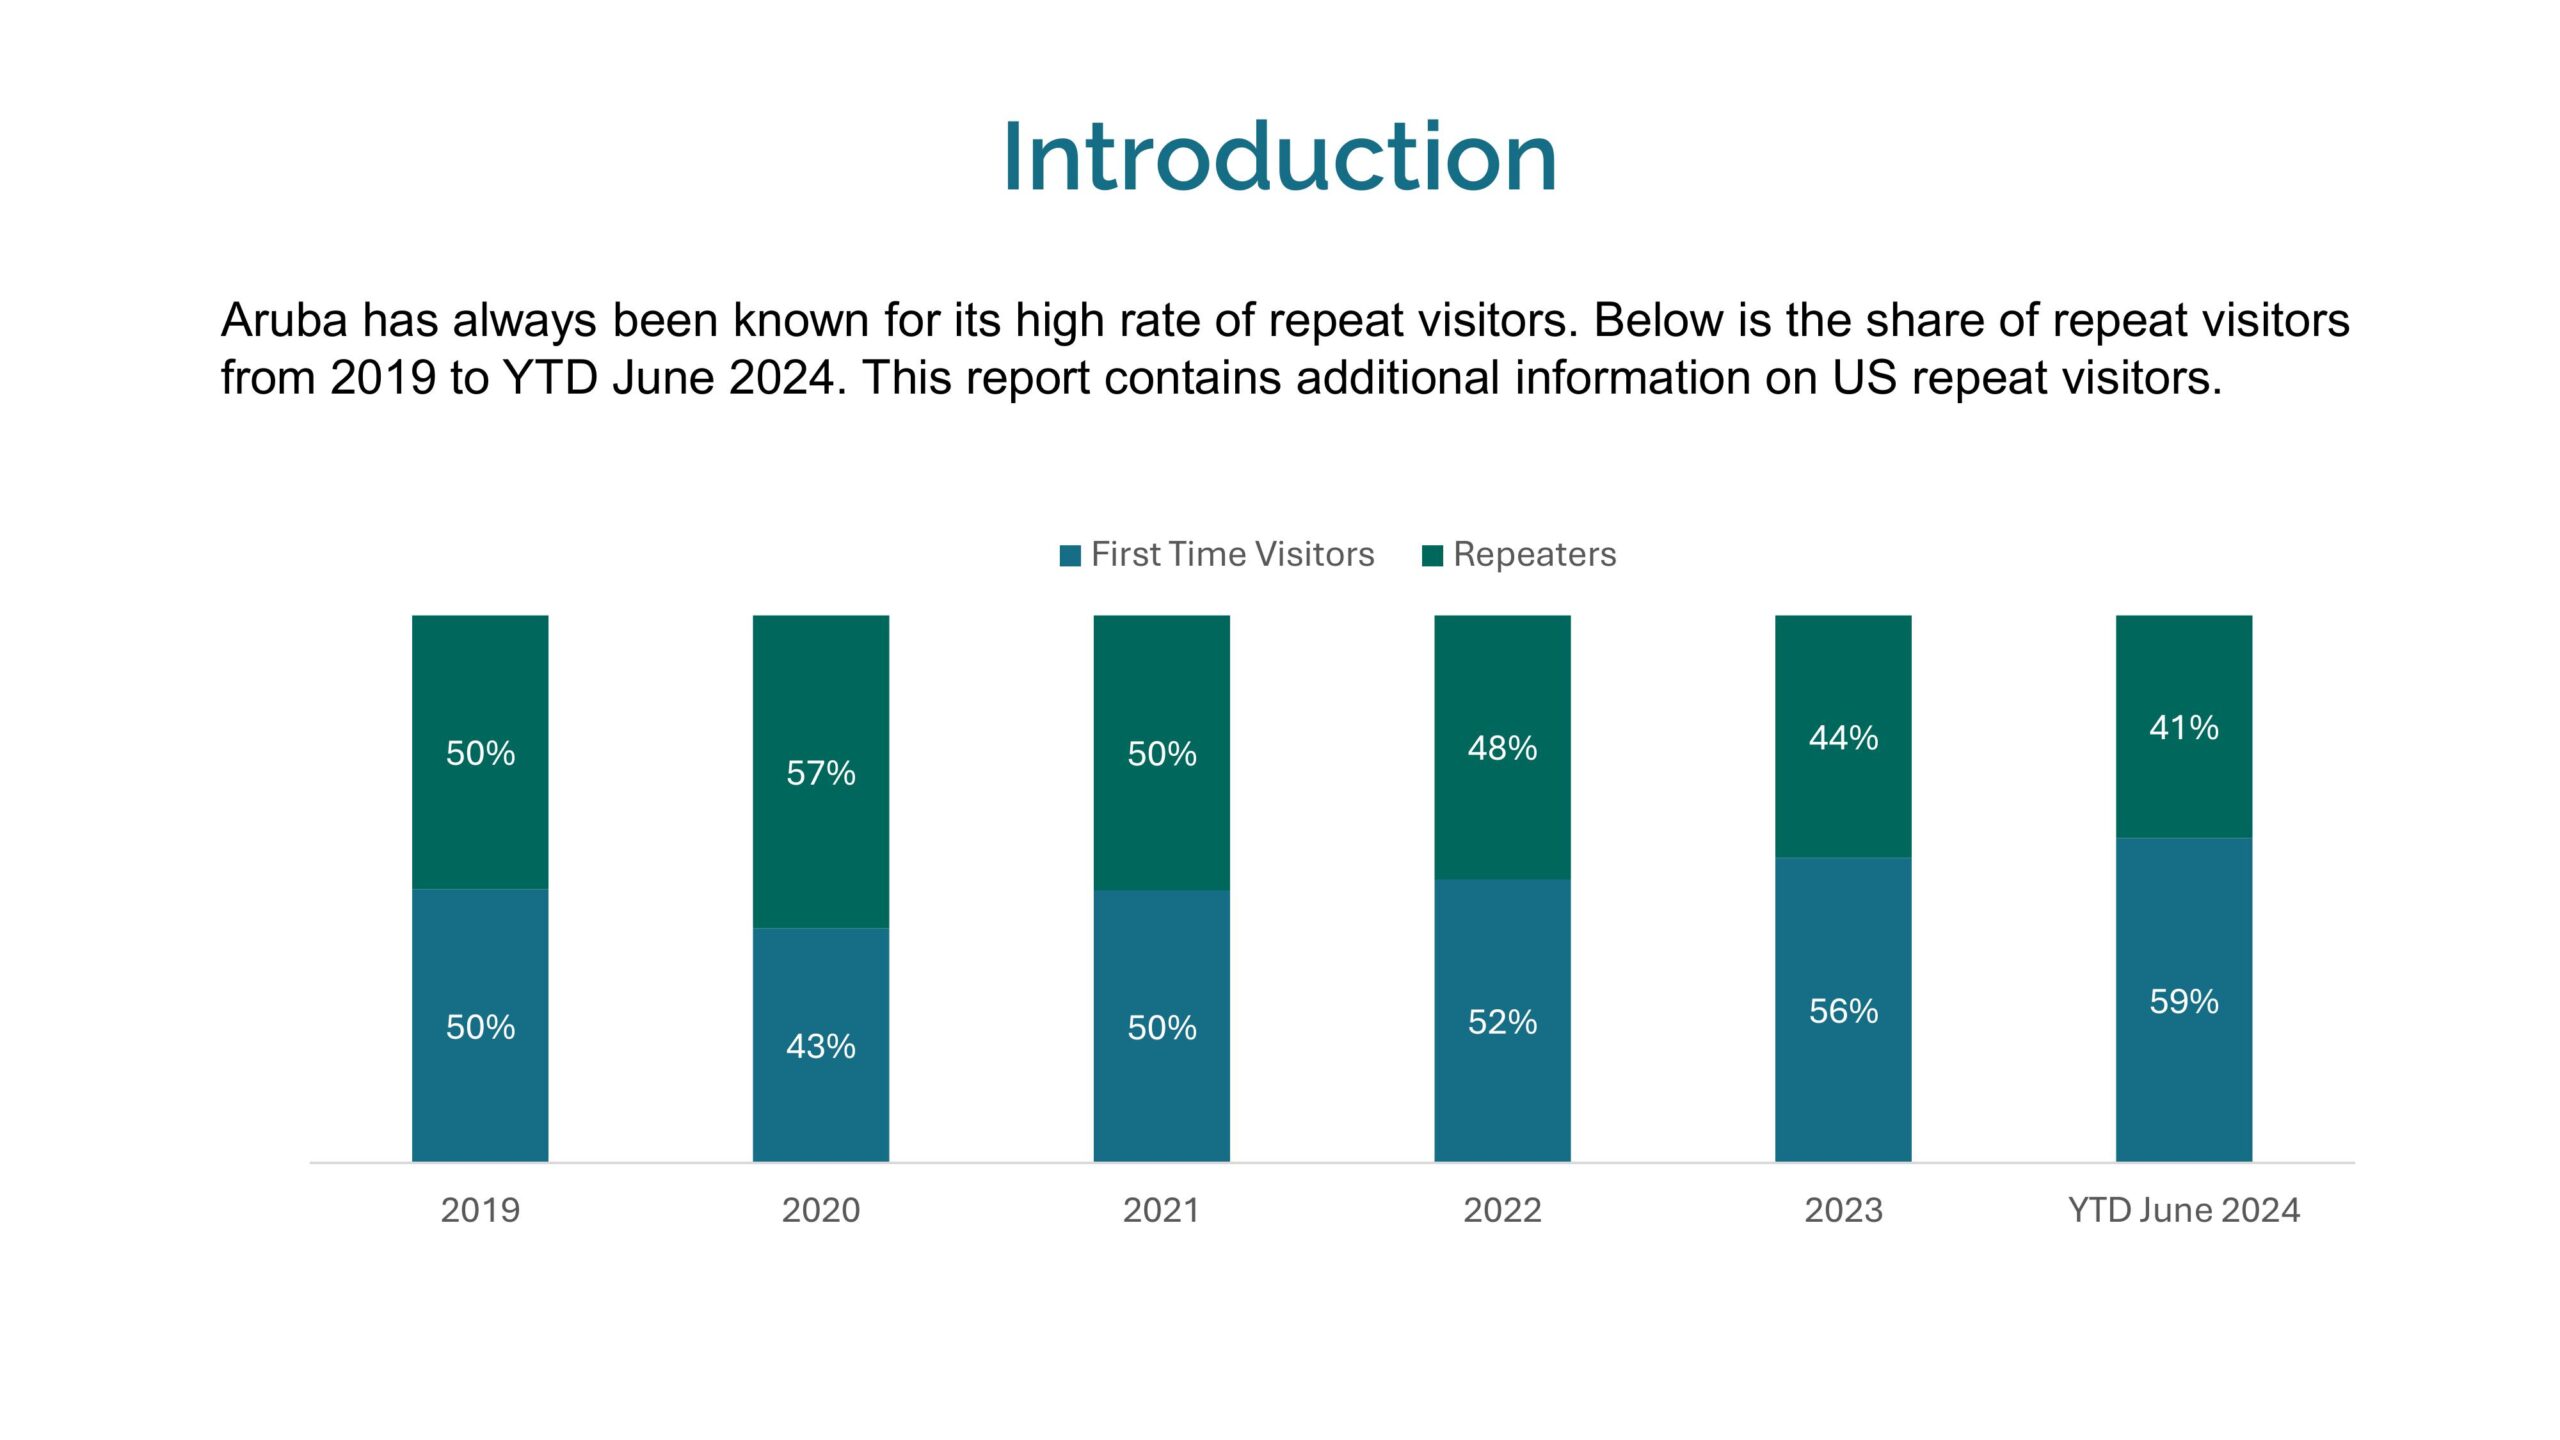
Tourists flock to Aruba for various reasons, and the Aruba Tourism August 2024 report highlights the top motivating factors for travel. The dominant reason was to enjoy the “Sun, Sand, and Sea,” which accounted for 84% of visitors’ purpose. Other significant reasons included family-friendly activities, direct flight availability, and reliable weather, all of which make Aruba an attractive destination for repeat visitors. Adventure tourism and diving also saw an uptick, indicating that Aruba is increasingly appealing to more niche travel interests.


Key Motivations for Choosing Aruba:
- Sun, Sand, and Sea: 84.0%
- Family-Friendly Destination: 27%
- Word of Mouth Recommendations: 18%
- Reliable Weather: 13%
- Adventure Activities: 4%
Economic Impact and Future Projections
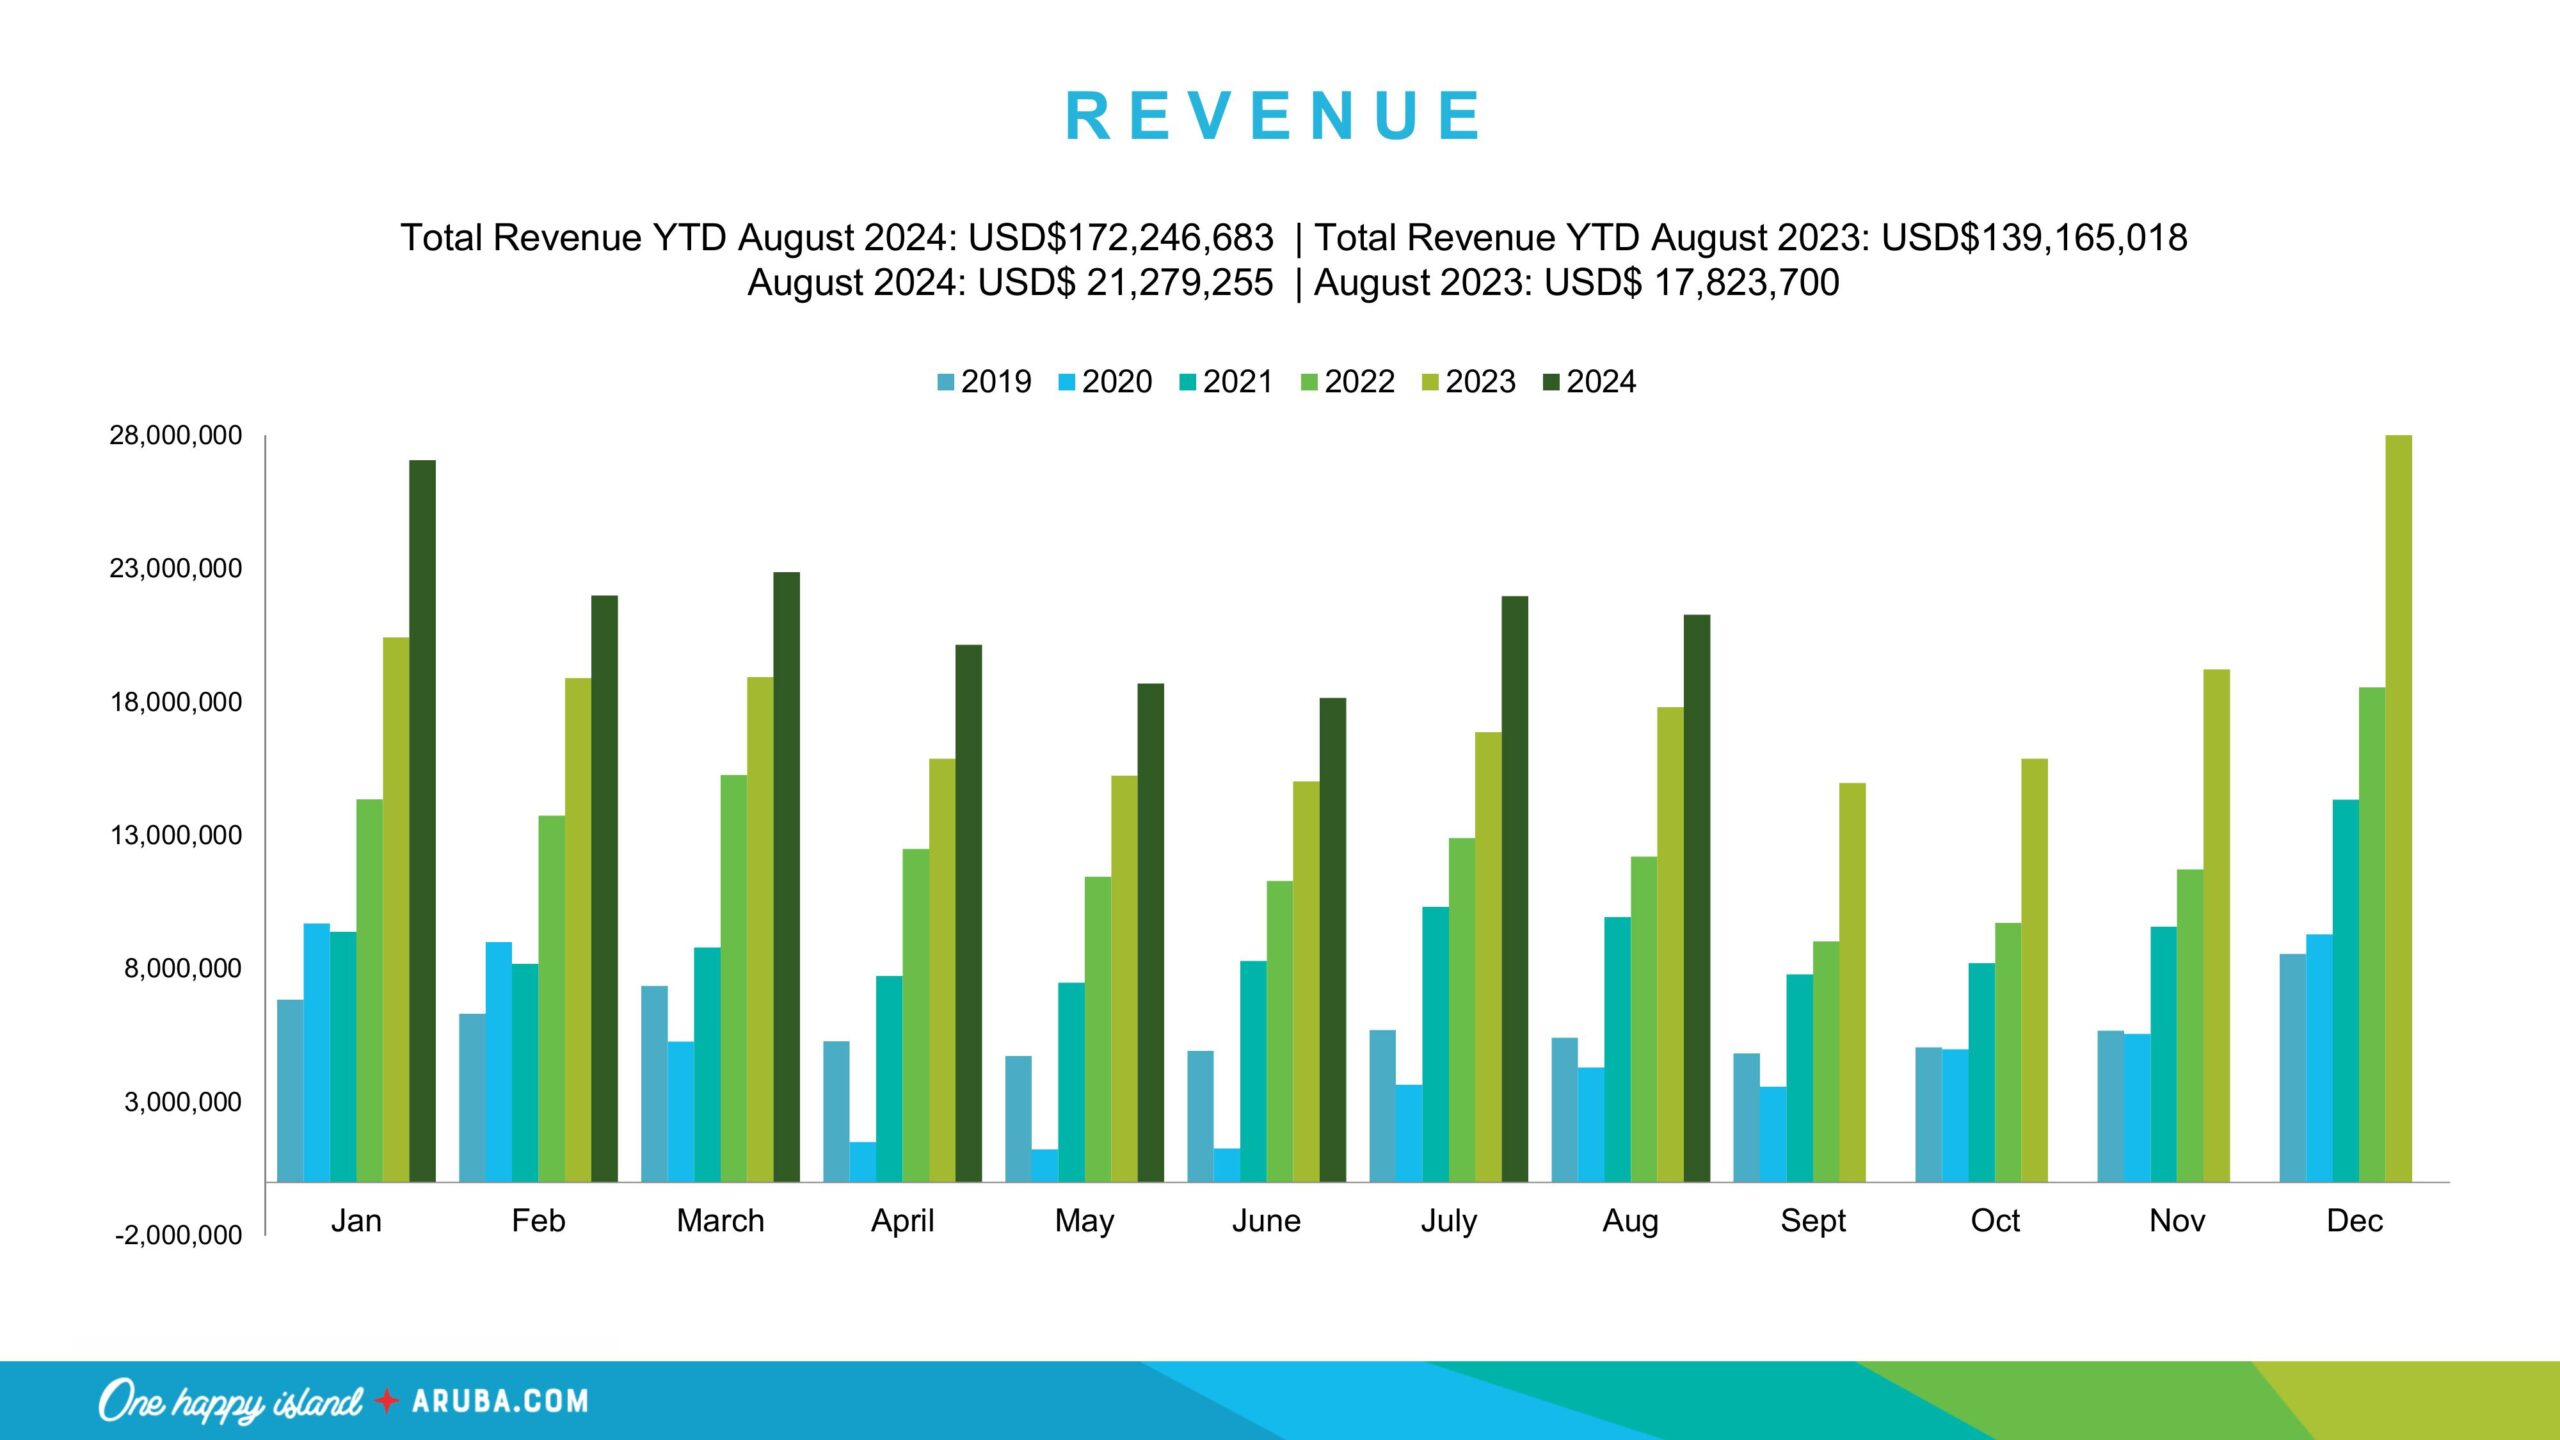
The Aruba Tourism August 2024 report not only reflects the current state of the tourism industry but also offers projections for the future. With tourism credits showing a 13.5% increase and further growth in tourist spending, Aruba is on track to continue its economic recovery post-pandemic. The government’s focus on sustainable tourism, combined with increasing investments in infrastructure and services, is likely to maintain this upward trend.
The island’s ability to attract higher-spending tourists and extend average lengths of stay will be crucial in maintaining its competitive edge in the Caribbean tourism market. Aruba’s projected tourism credits for 2023-2024 anticipate a further 14% increase, a promising indicator of continued growth.

Conclusion
The Aruba Tourism August 2024 statistics highlight the island’s continued success as a premier Caribbean destination. With significant growth in visitor numbers, diverse accommodation preferences, and increasing spending patterns, Aruba is well-positioned to maintain its status as a favorite for travelers worldwide. As the island looks to the future, sustainable growth and targeted marketing efforts will ensure that Aruba continues to thrive in the global tourism landscape.