Aruba Tourism Report March 2026 – Key Insights and Growth Trends
The Aruba tourism report March 2026 reveals strong visitor growth, rising cruise arrivals, and evolving travel trends. This detailed analysis highlights key tourism performance indicators, helping businesses and travelers understand Aruba’s booming tourism industry.
The Aruba tourism report March 2026 shows impressive growth across multiple sectors. Visitor arrivals increased significantly, while cruise tourism expanded steadily. Moreover, tourism spending and accommodation trends reflect a thriving travel economy. According to the official report, Aruba continues to strengthen its position as a top Caribbean destination.
Aruba Tourism Report March 2026 – Visitor Arrivals Growth
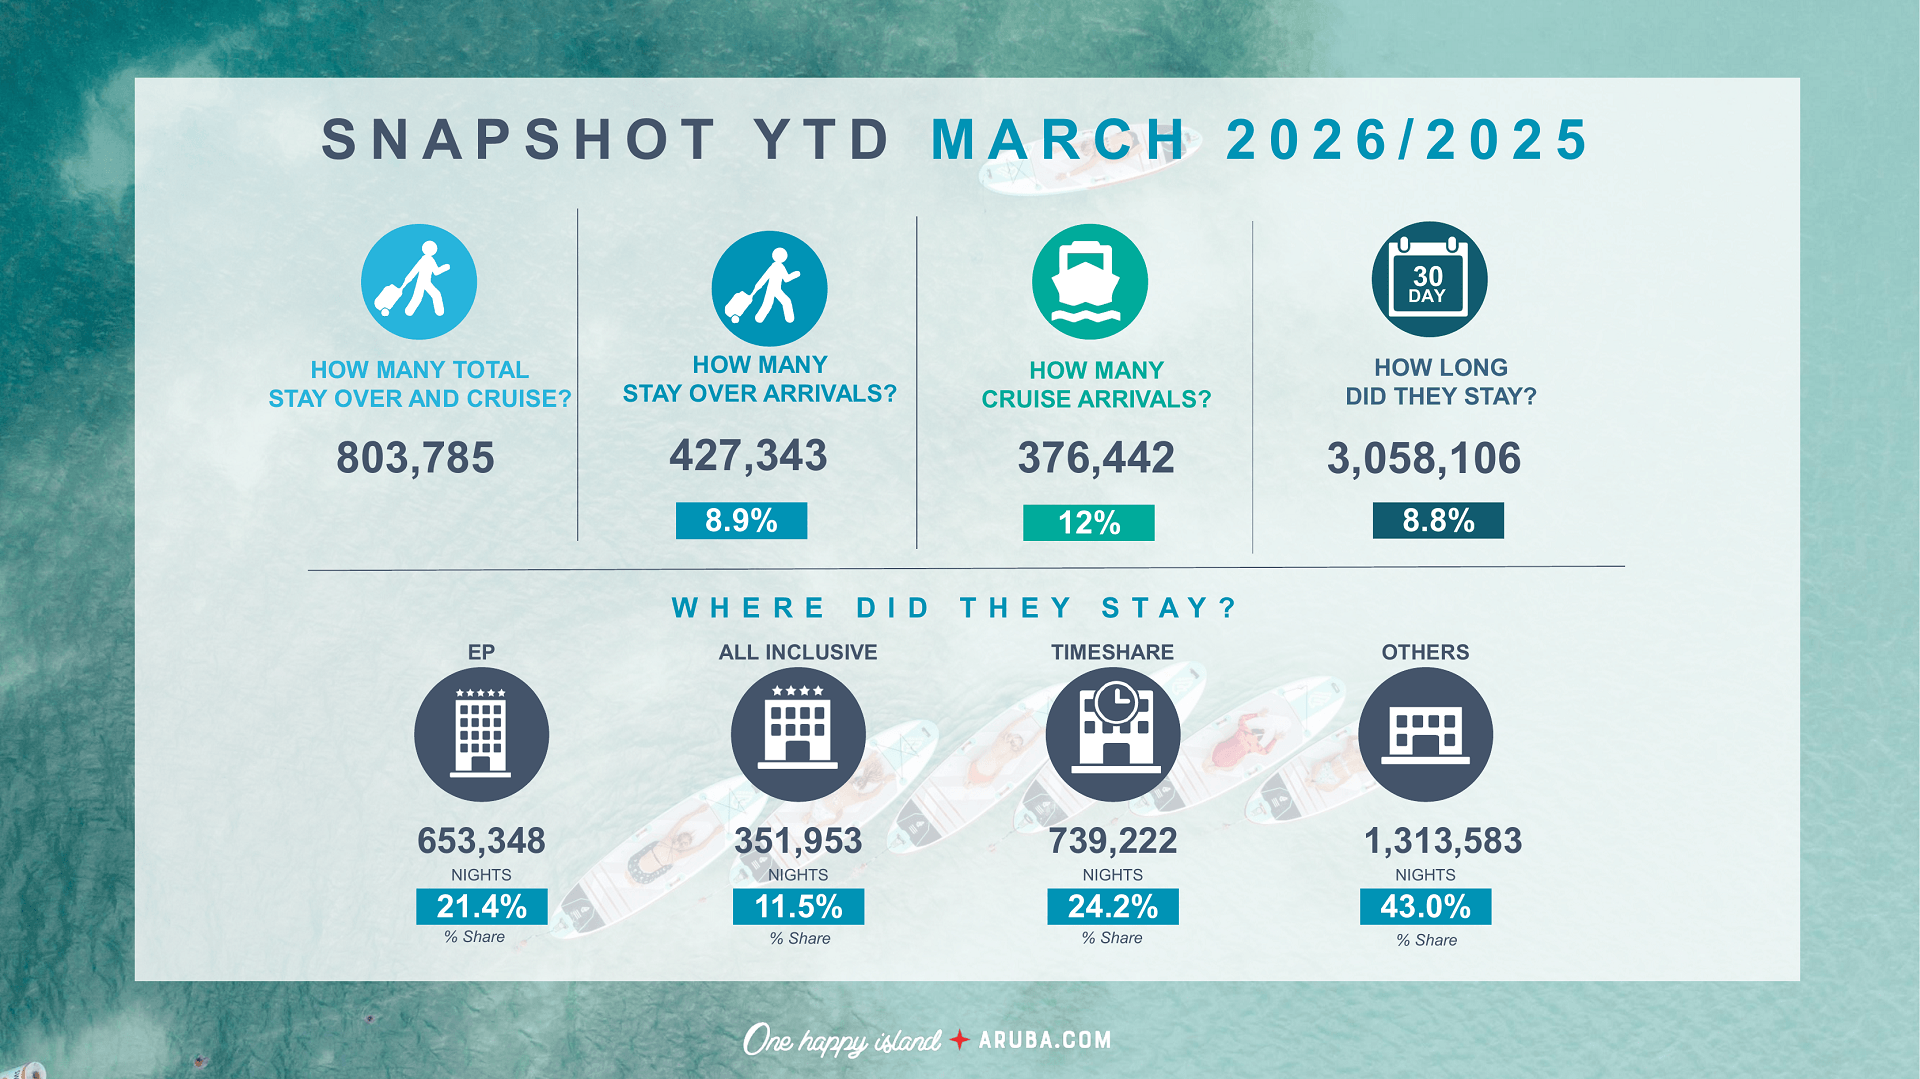
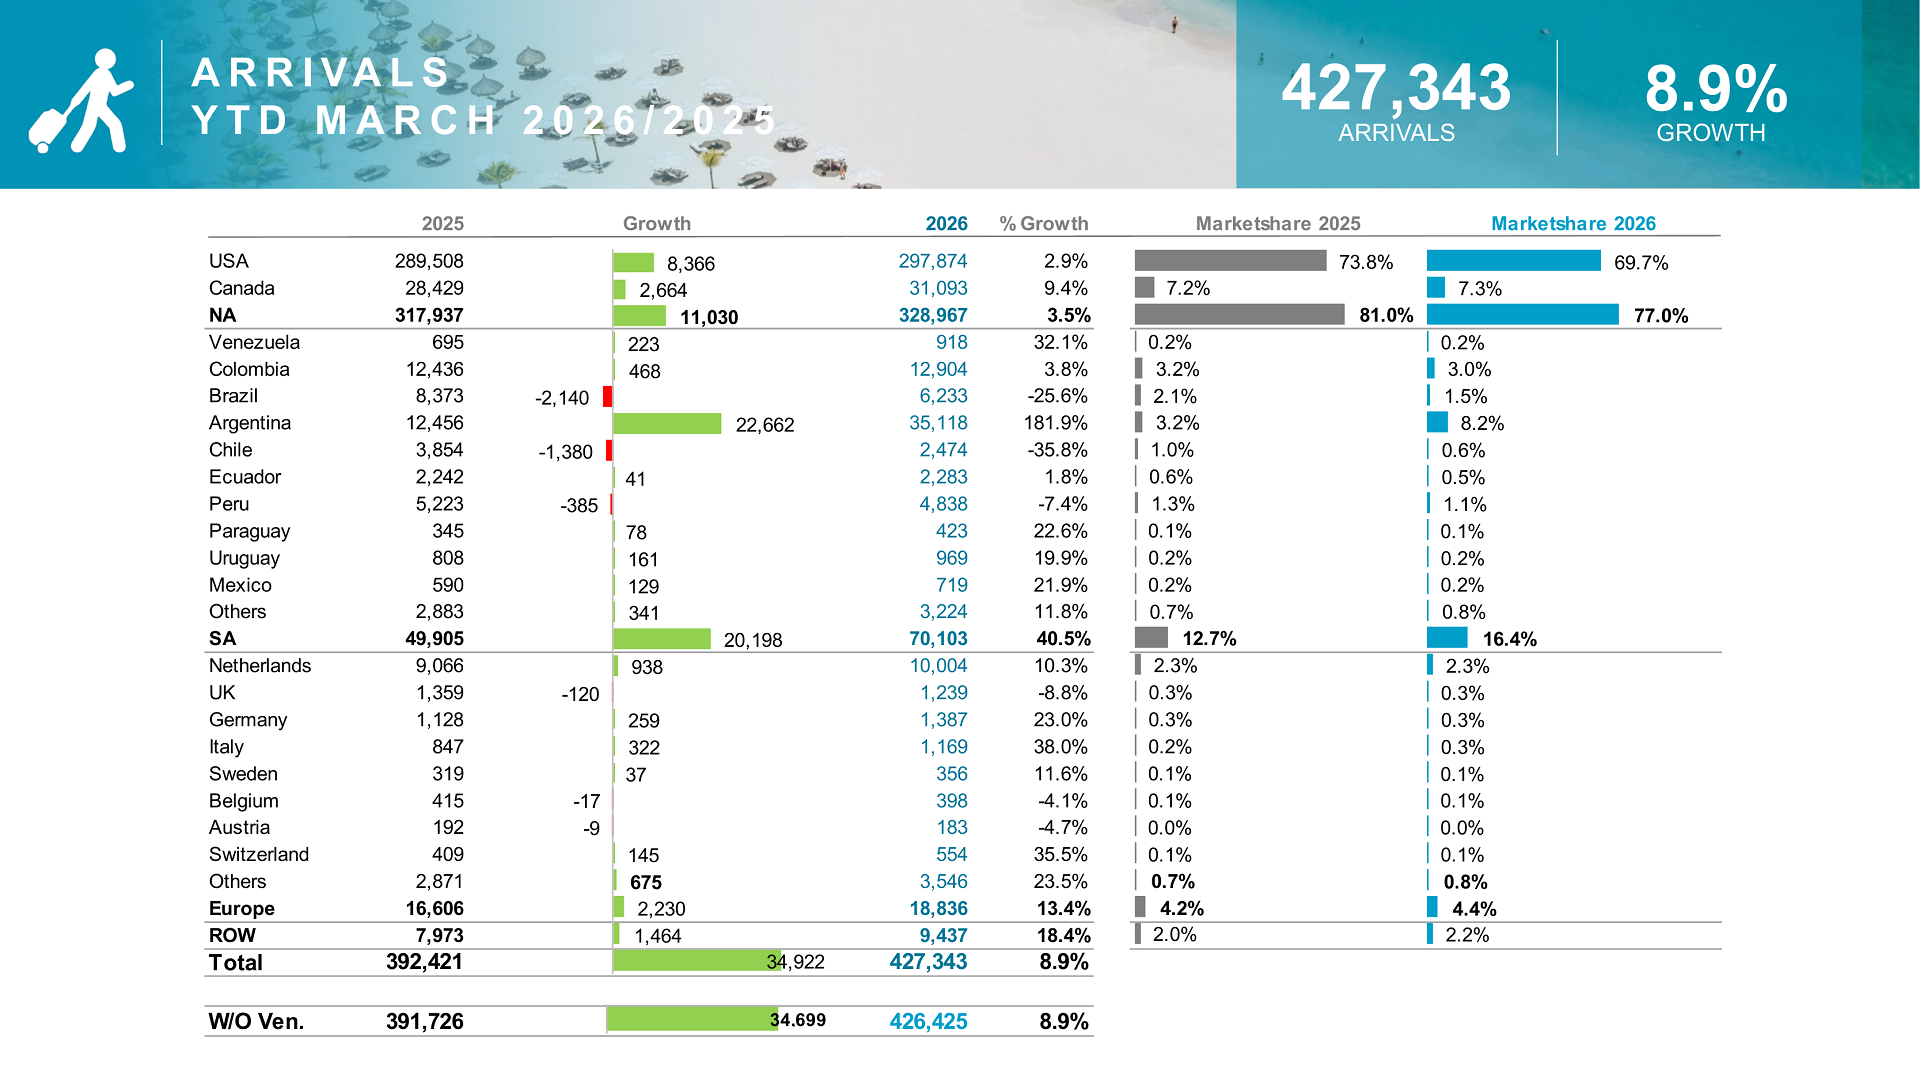
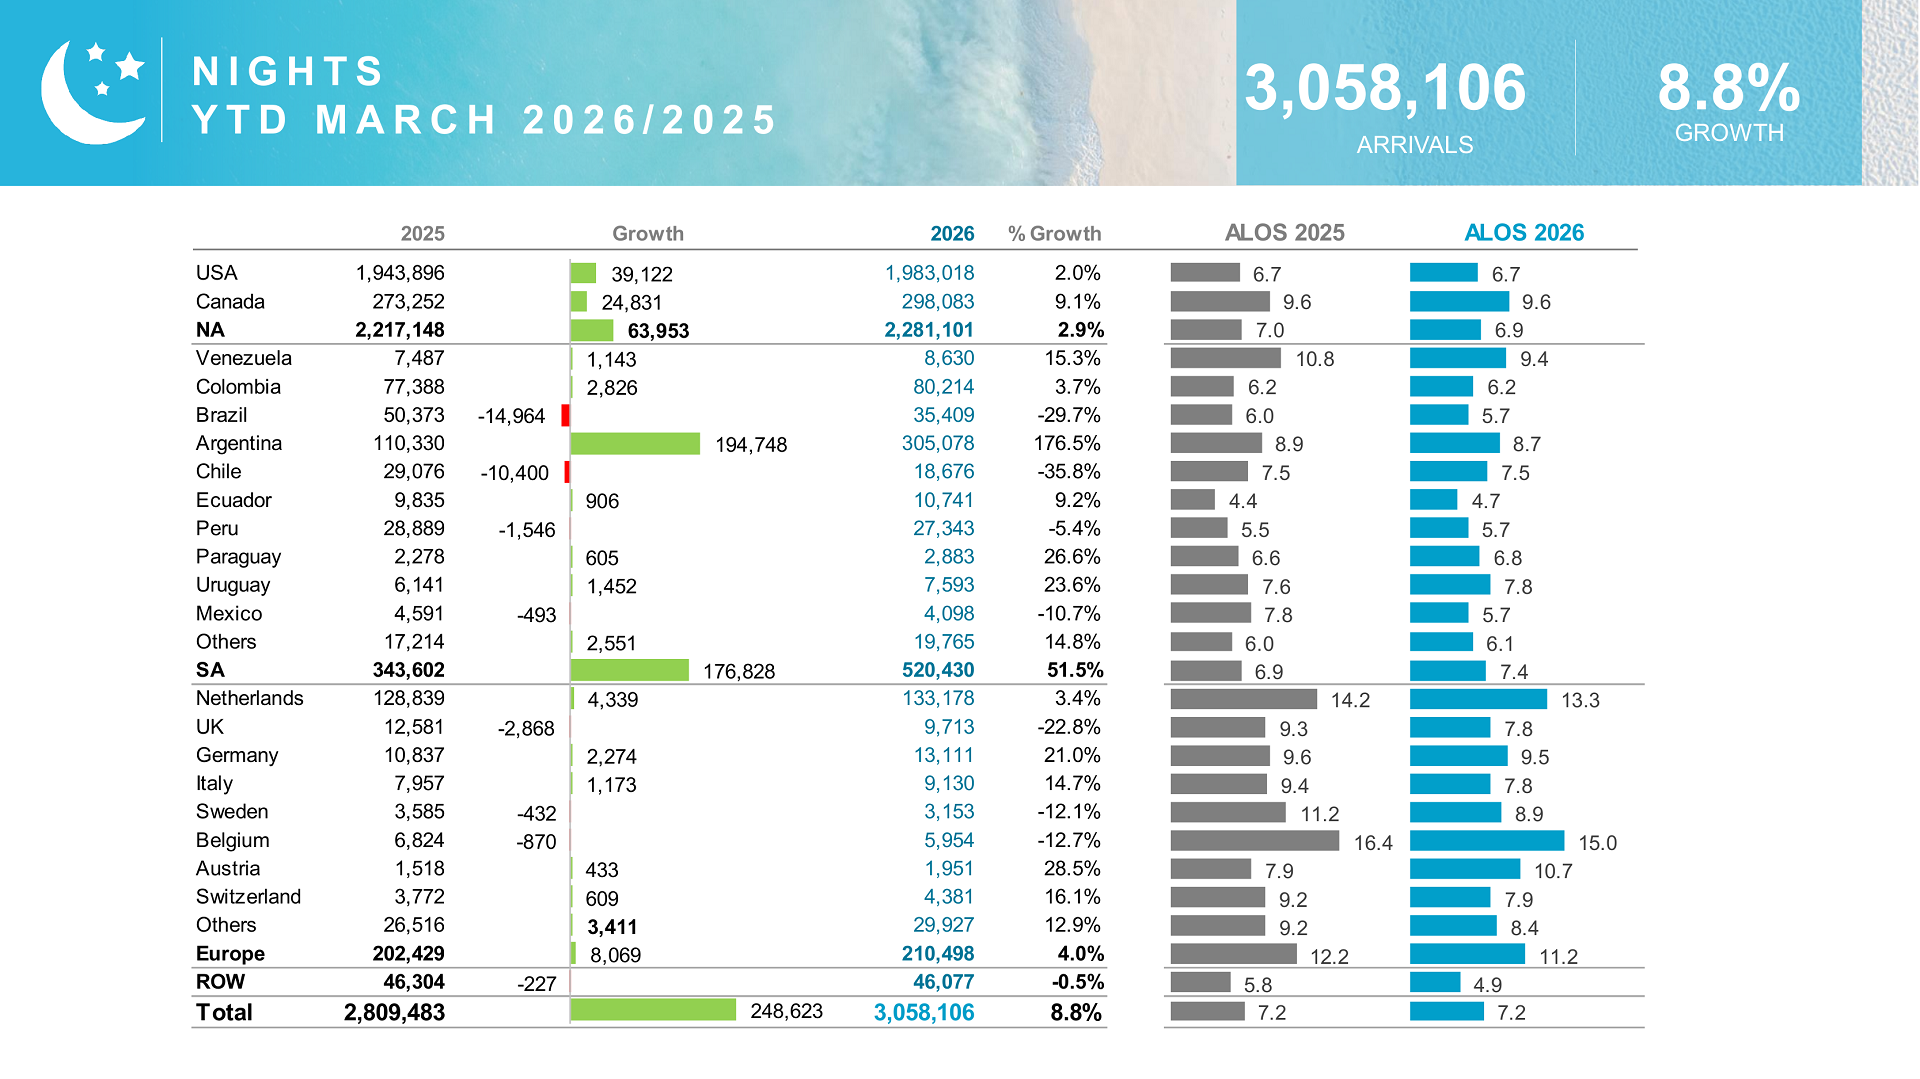
The Aruba tourism report March 2026 highlights a total of 427,343 stay-over arrivals, marking an 8.9% increase compared to 2025. This growth clearly demonstrates strong demand for Aruba as a travel destination.


Regional Visitor Breakdown in Aruba Tourism Report March 2026
- North America remains the dominant market with over 77% market share
- South America shows the fastest growth at 40.5% increase
- Europe continues steady growth with 13.4% increase
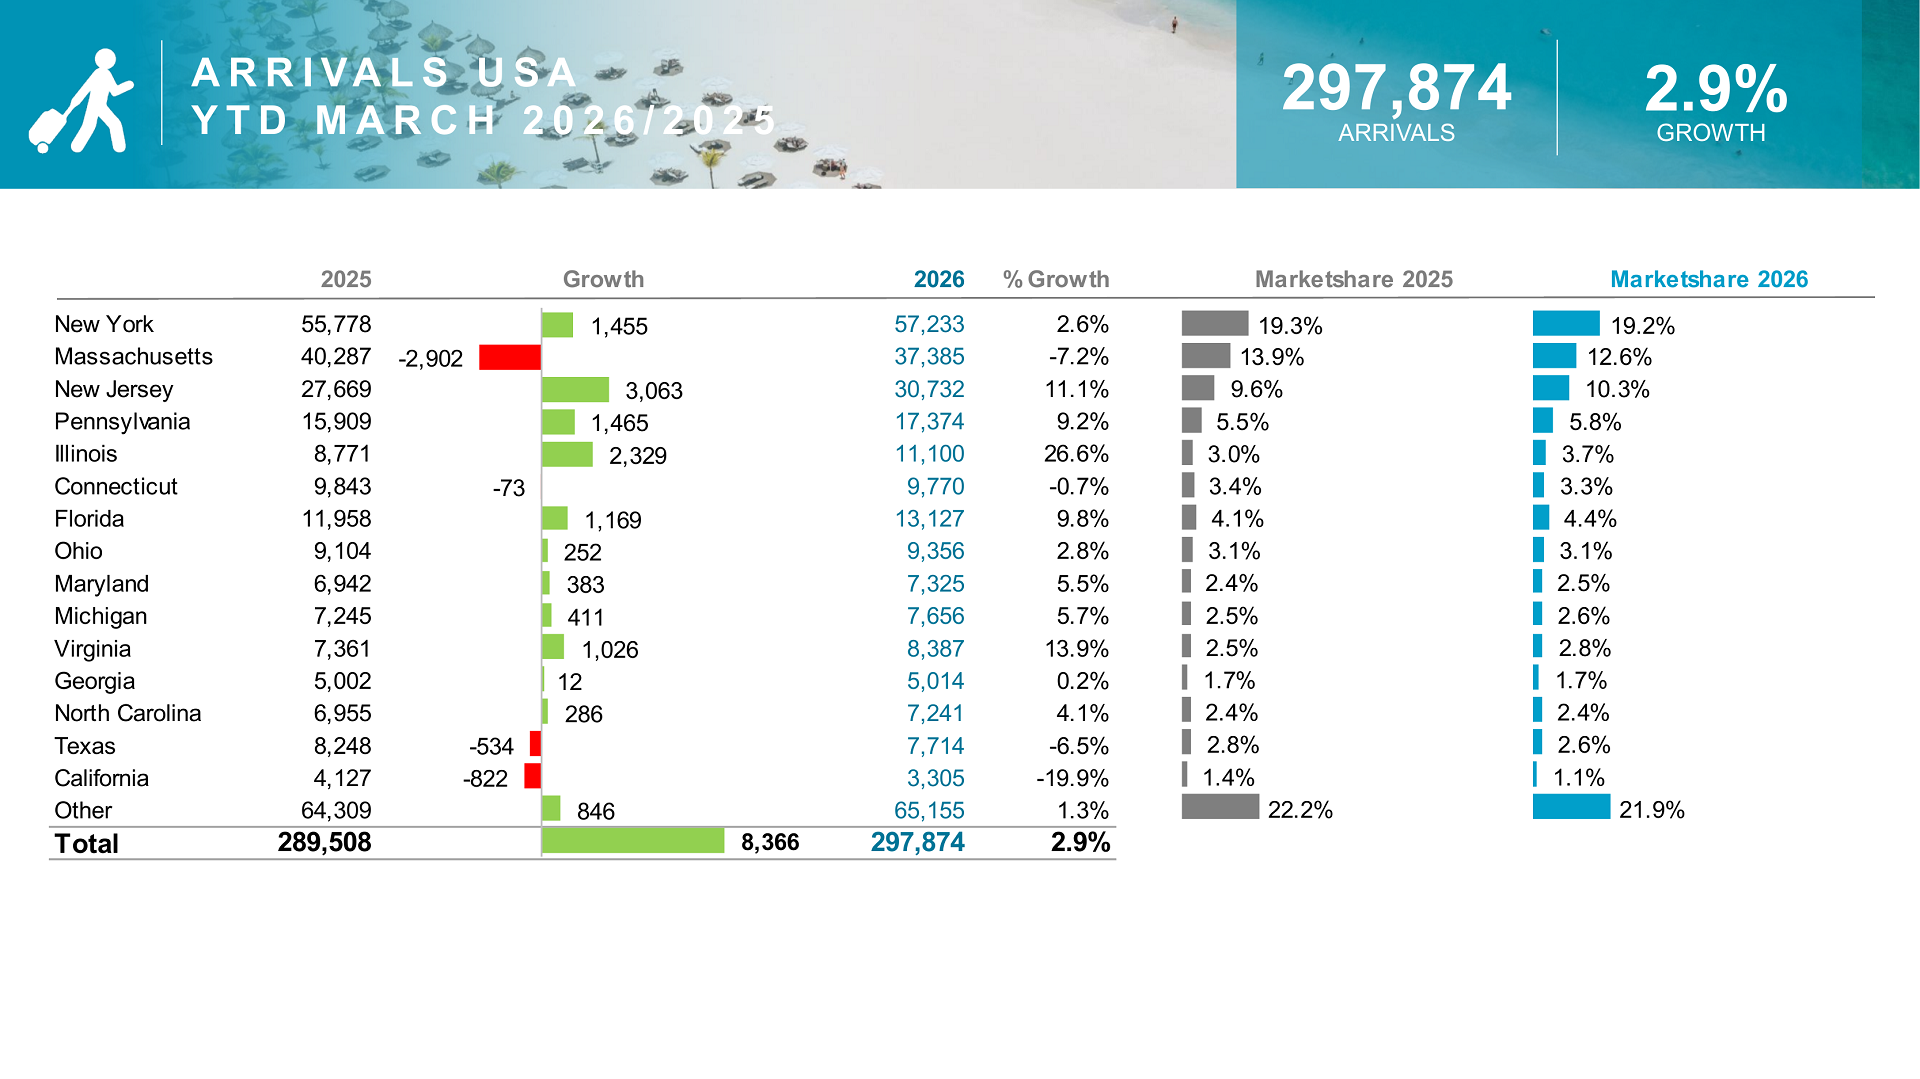
Additionally, the United States leads with nearly 298,000 visitors, confirming its importance in the Aruba tourism report March 2026.
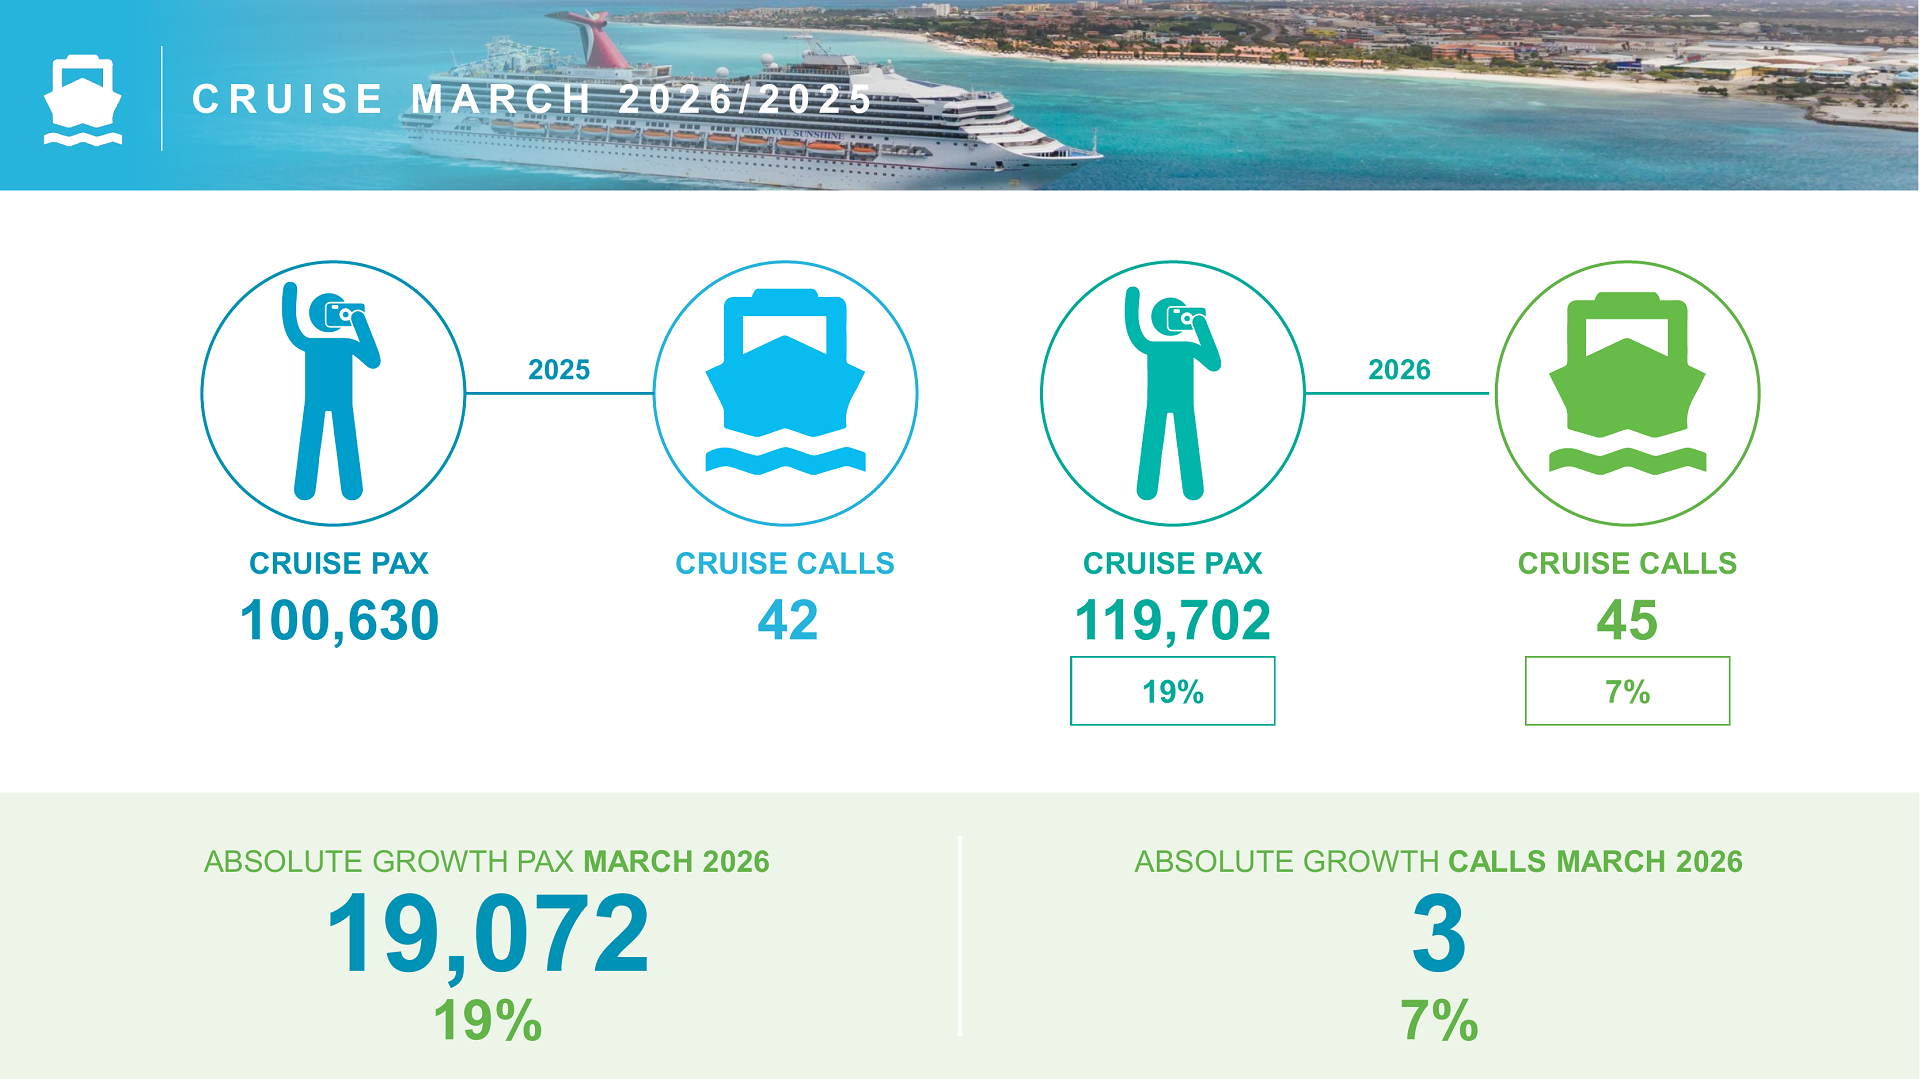
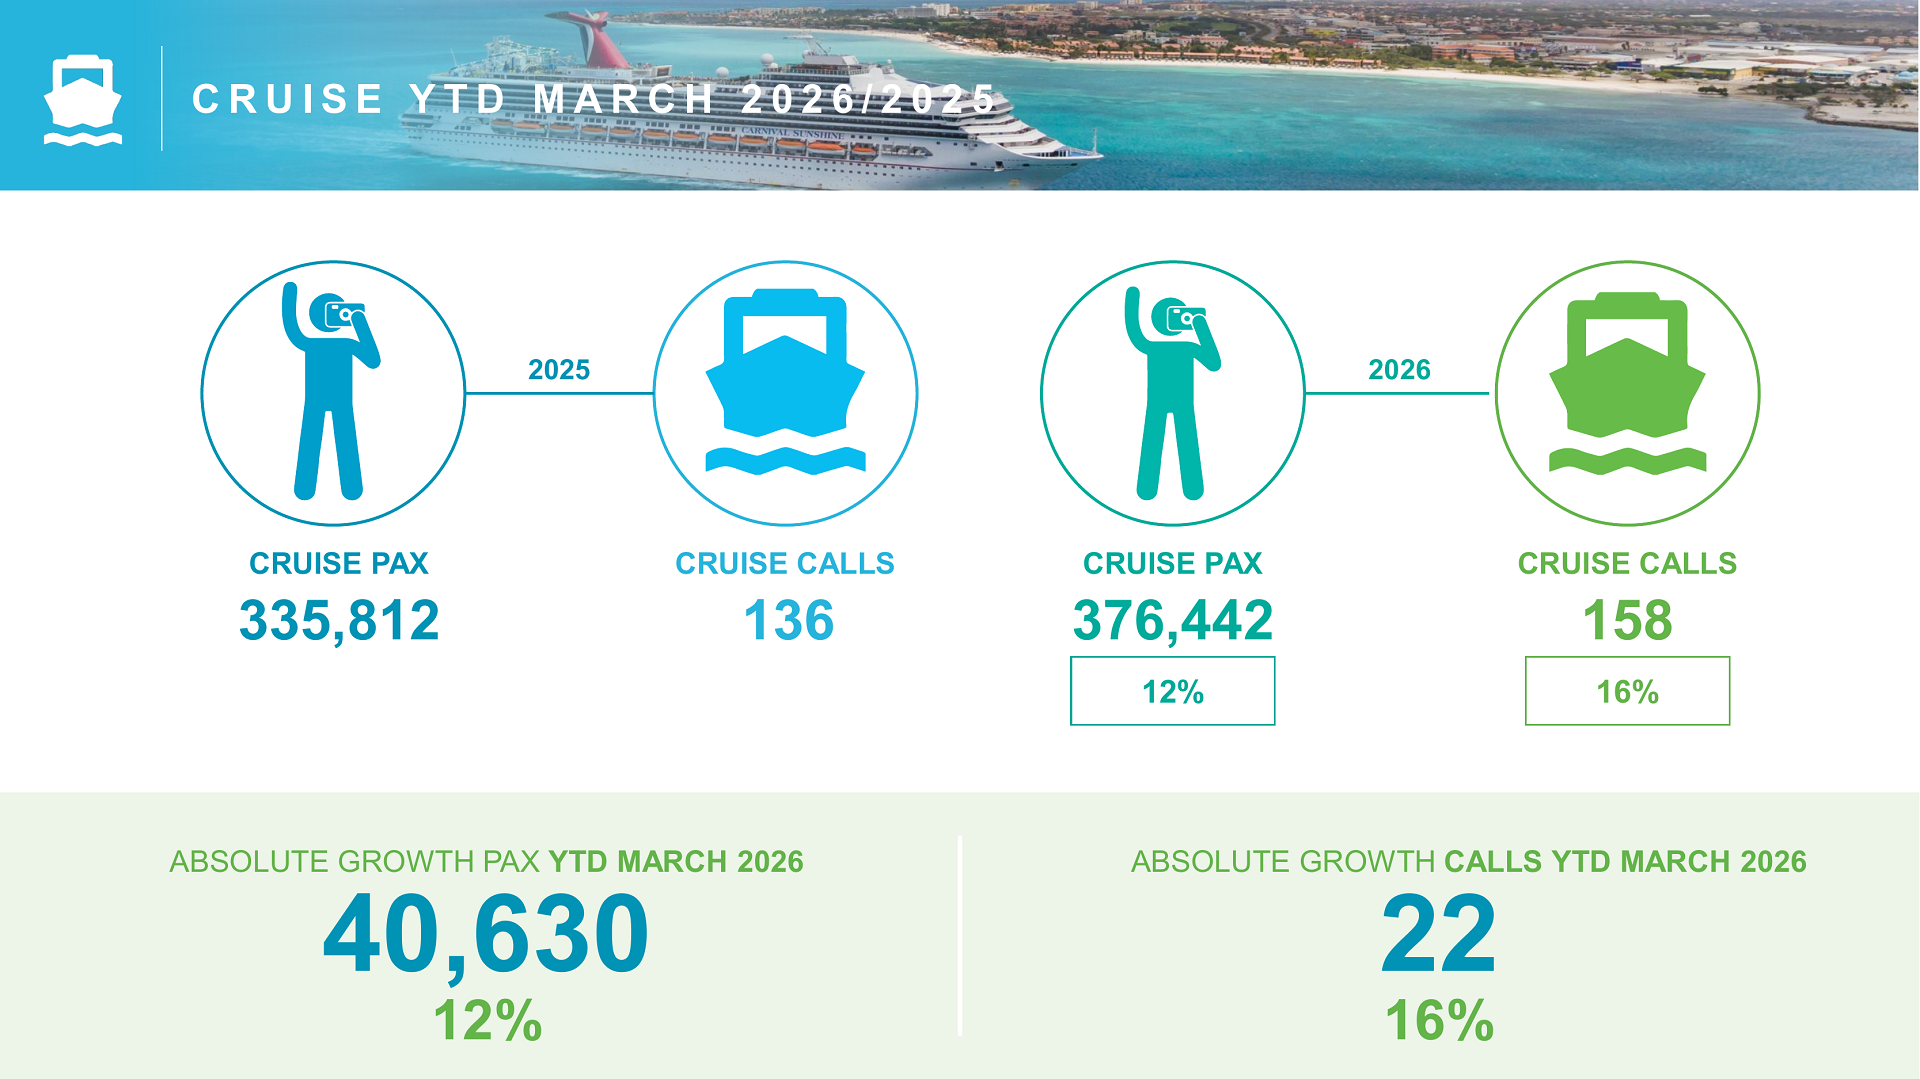
Cruise Tourism Expansion in Aruba Tourism Report March 2026
Cruise tourism plays a vital role in Aruba’s economy. The Aruba tourism report March 2026 reveals:
- 376,442 cruise passengers (12% growth)
- 158 cruise calls (16% increase)
Why Cruise Tourism Matters
Because cruise visitors contribute to local businesses, retail, and excursions, this sector significantly boosts Aruba’s economy. Furthermore, the steady increase indicates strong partnerships with global cruise lines.
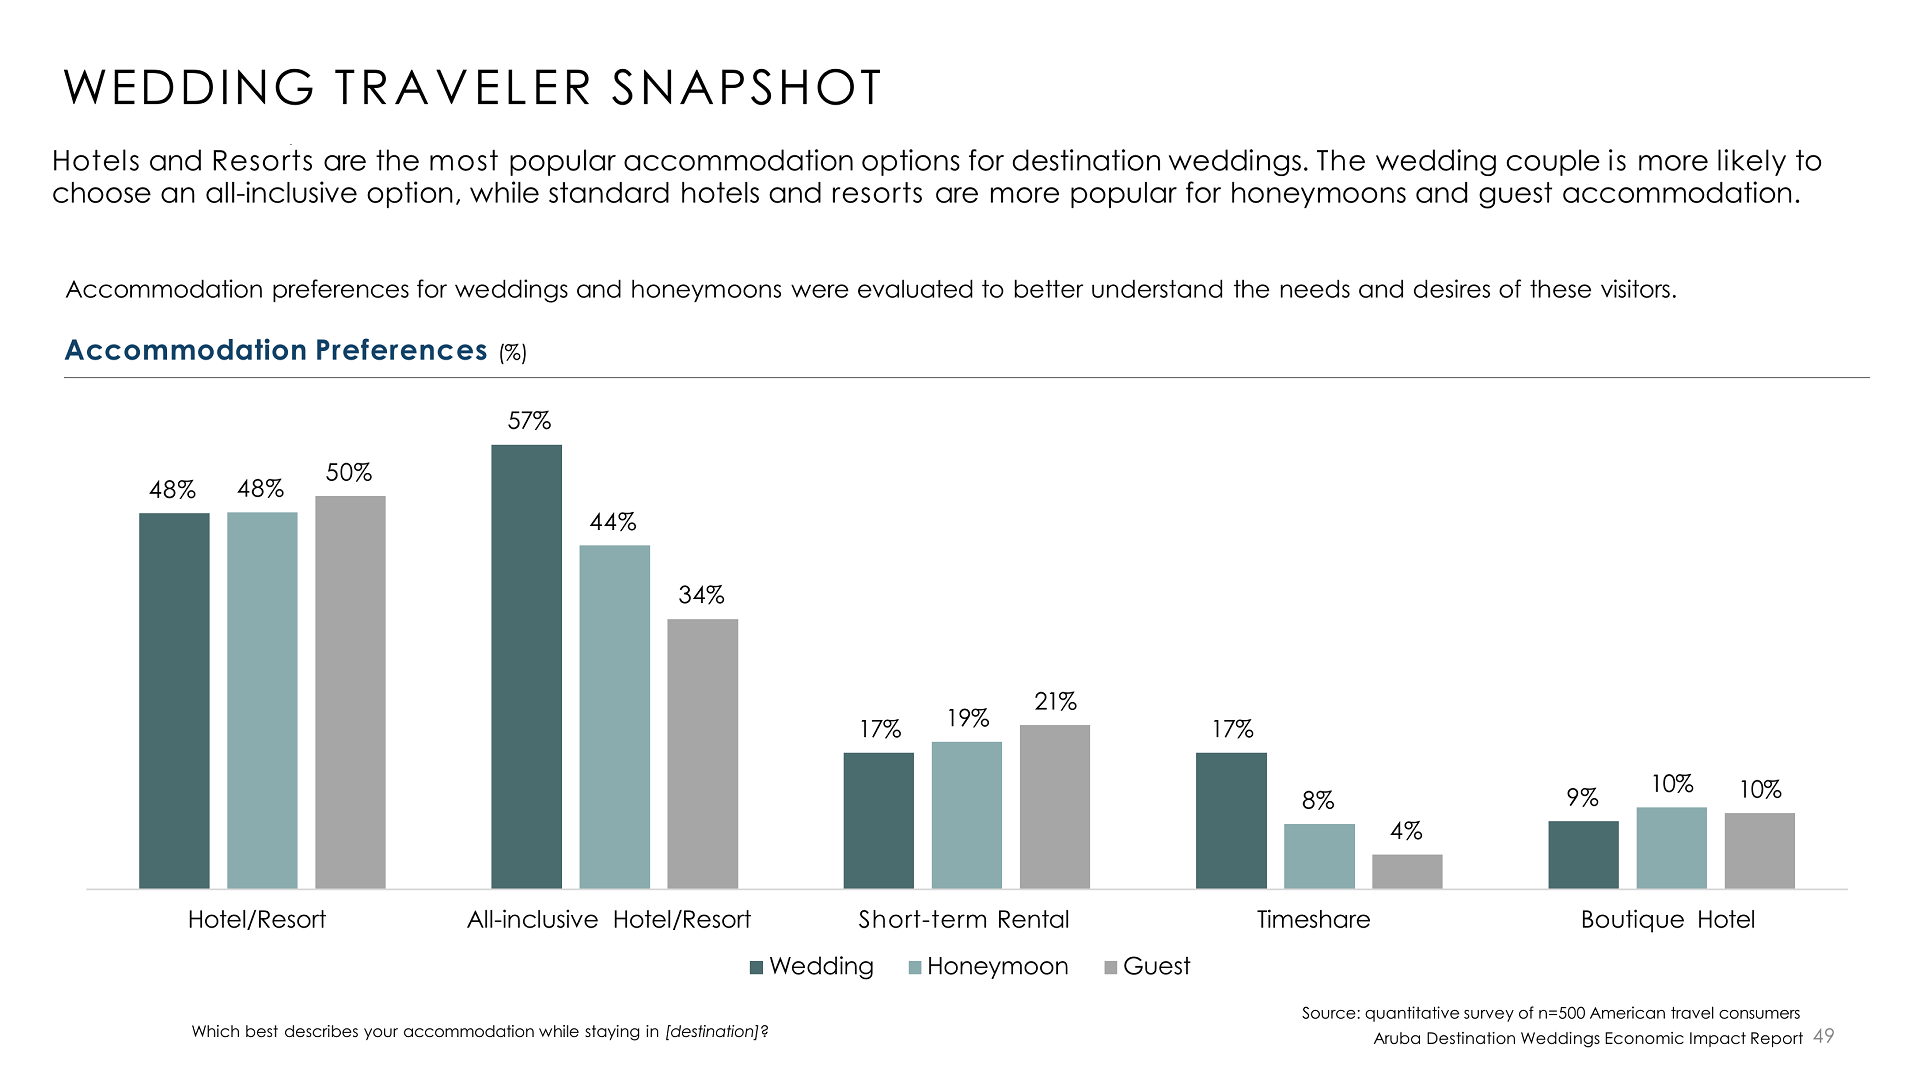
Aruba Tourism Report March 2026 – Accommodation Trends
Accommodation data shows how visitors prefer to stay on the island.
Stay Distribution Insights
- 43% stayed in other accommodations (largest share)
- 24.2% chose timeshares
- 21.4% preferred European Plan hotels
- 11.5% selected all-inclusive resorts
These figures from the Aruba tourism report March 2026 indicate diversification in lodging preferences.


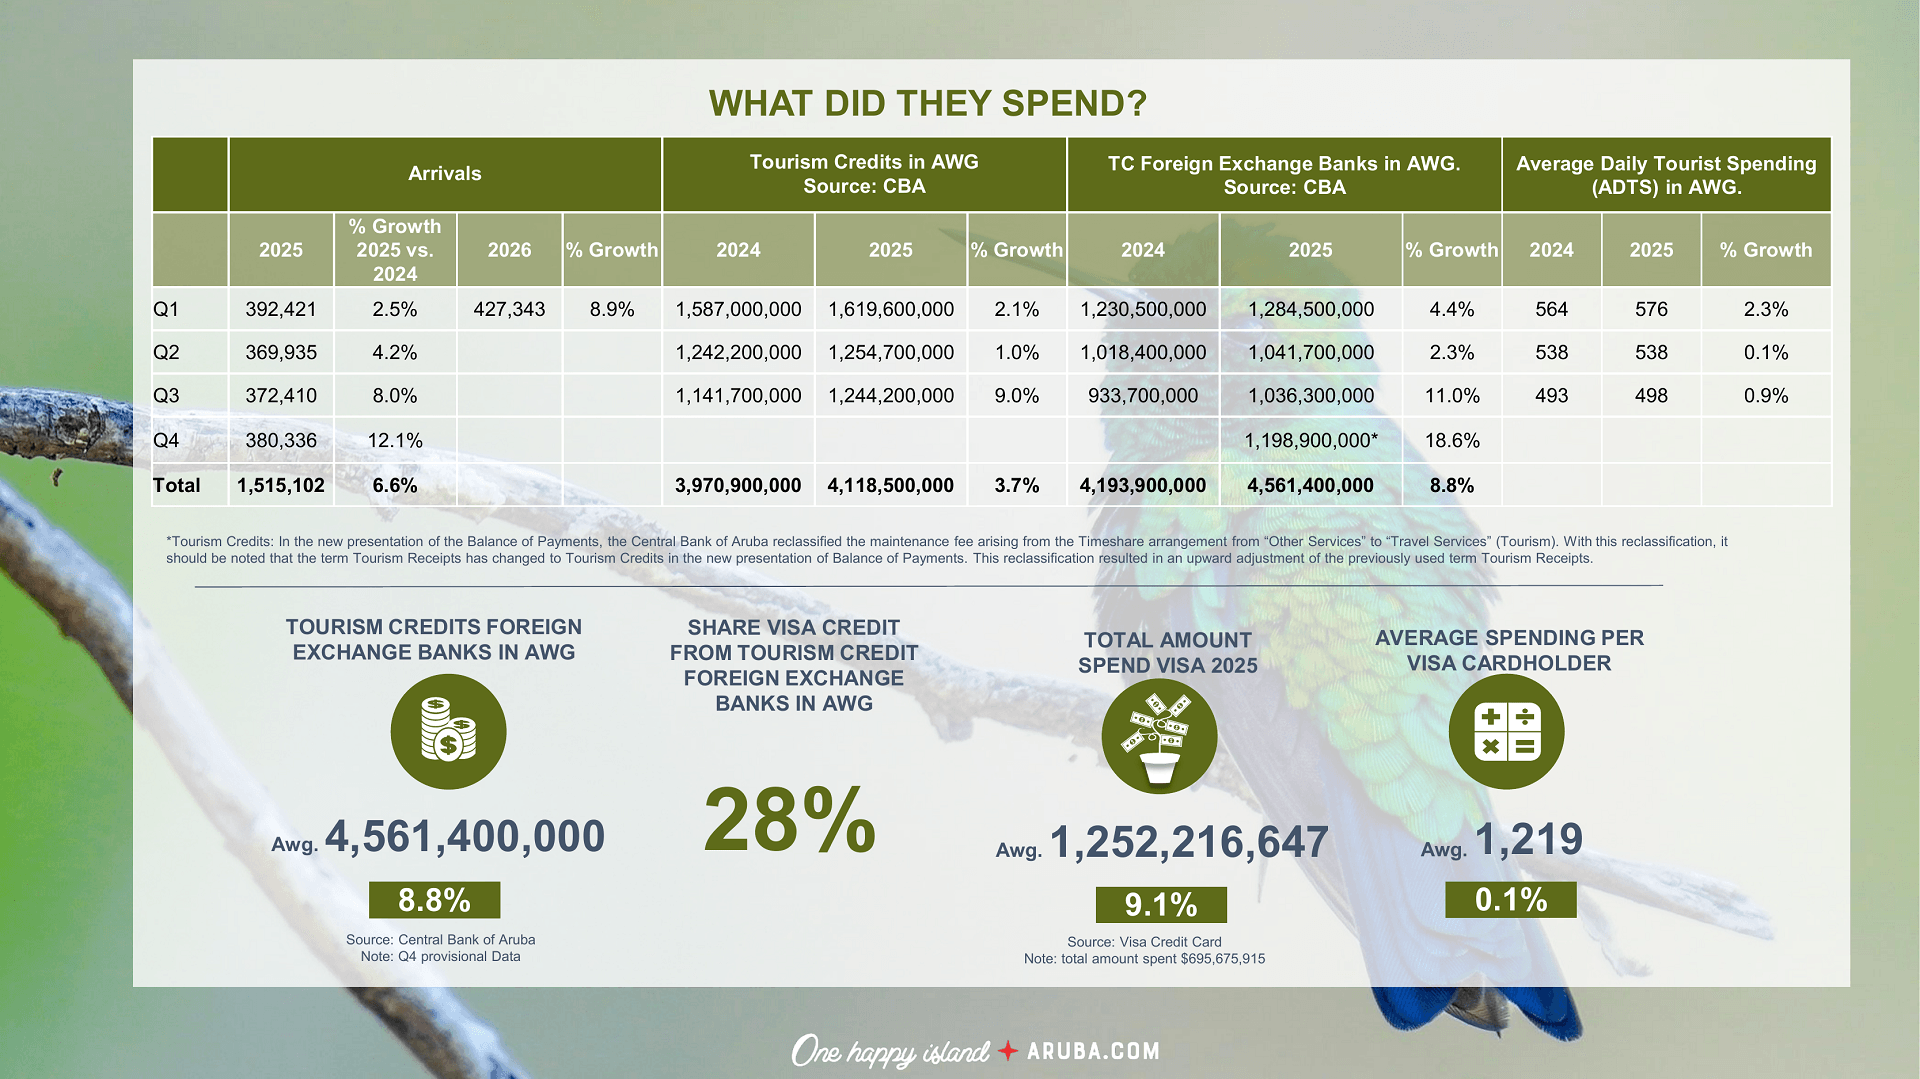
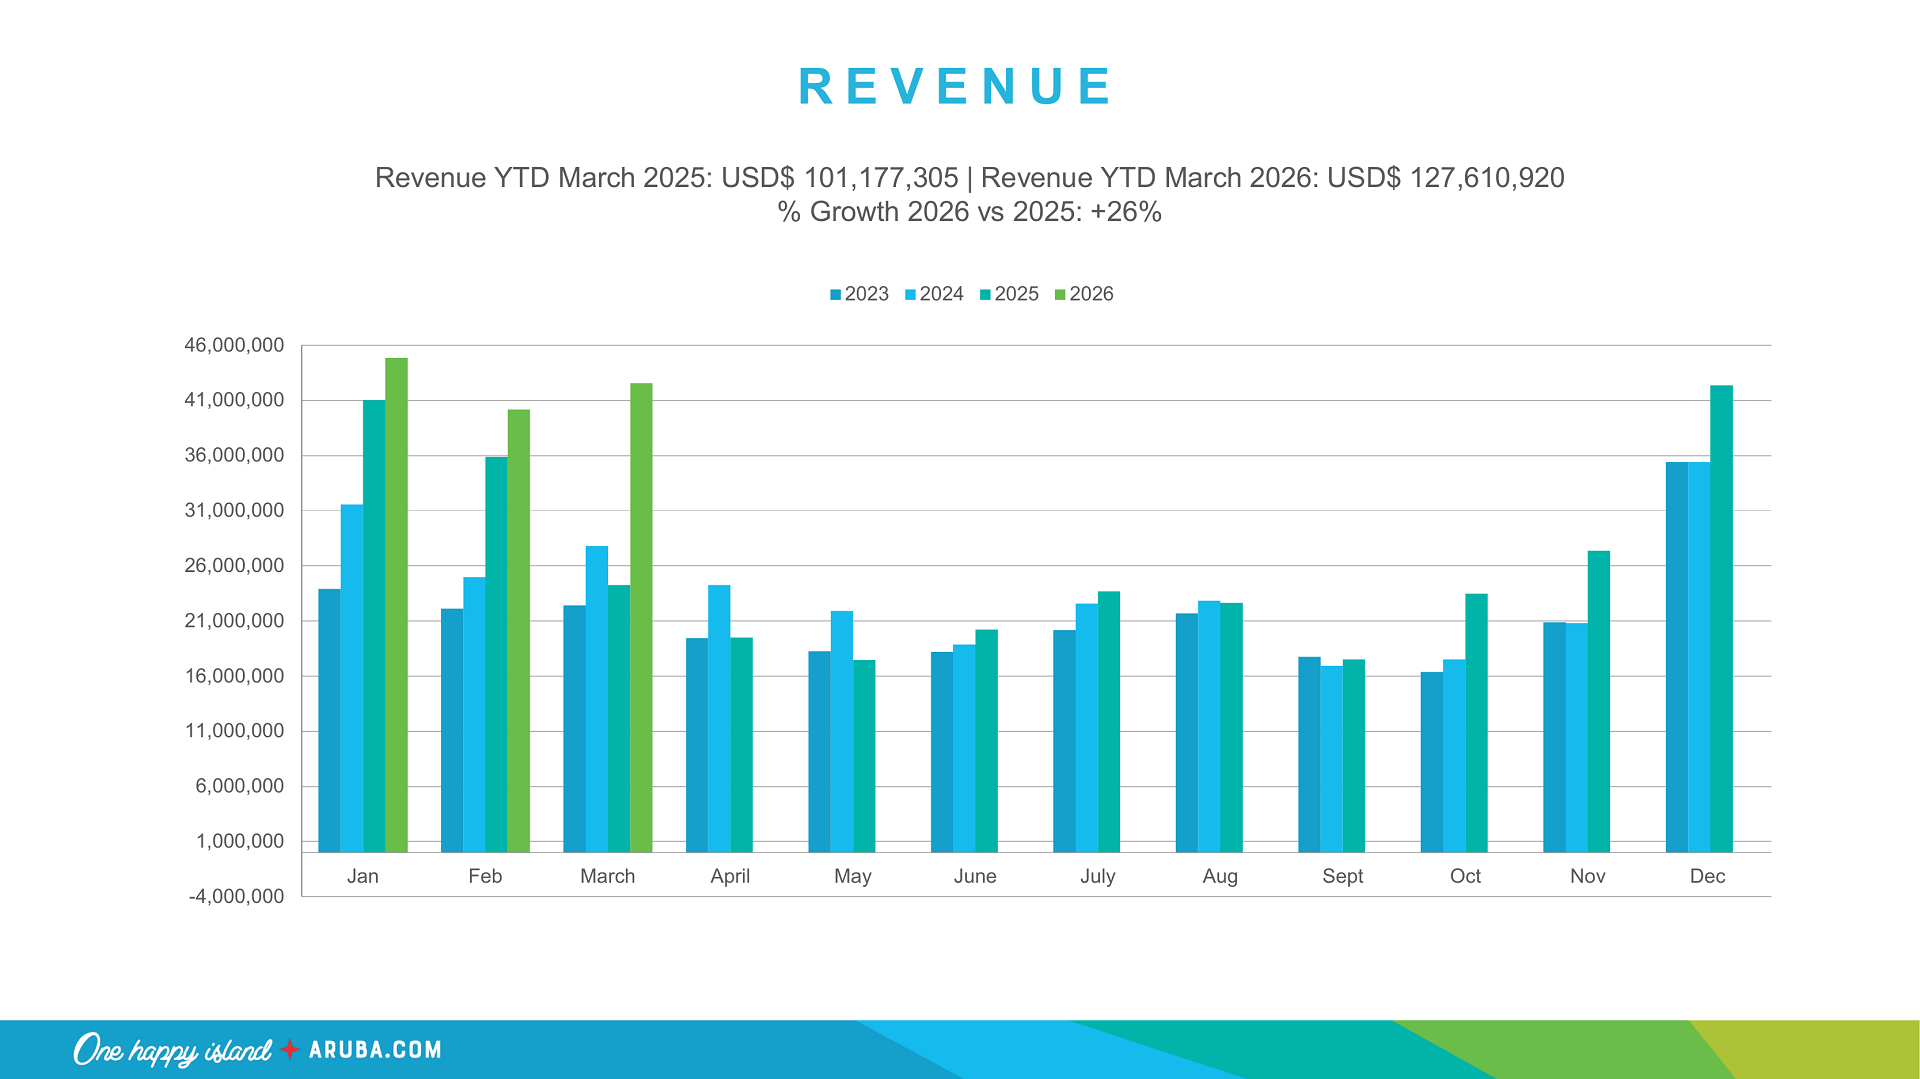
Tourist Spending and Economic Impact
Key Spending Highlights
- Total tourism credits reached AWG 4.56 billion
- Average spending per visitor increased steadily
- Visa card spending exceeded AWG 1.25 billion
Therefore, the Aruba tourism report March 2026 confirms consistent economic growth driven by tourism.
For more global tourism insights, visit the World Tourism Organization.
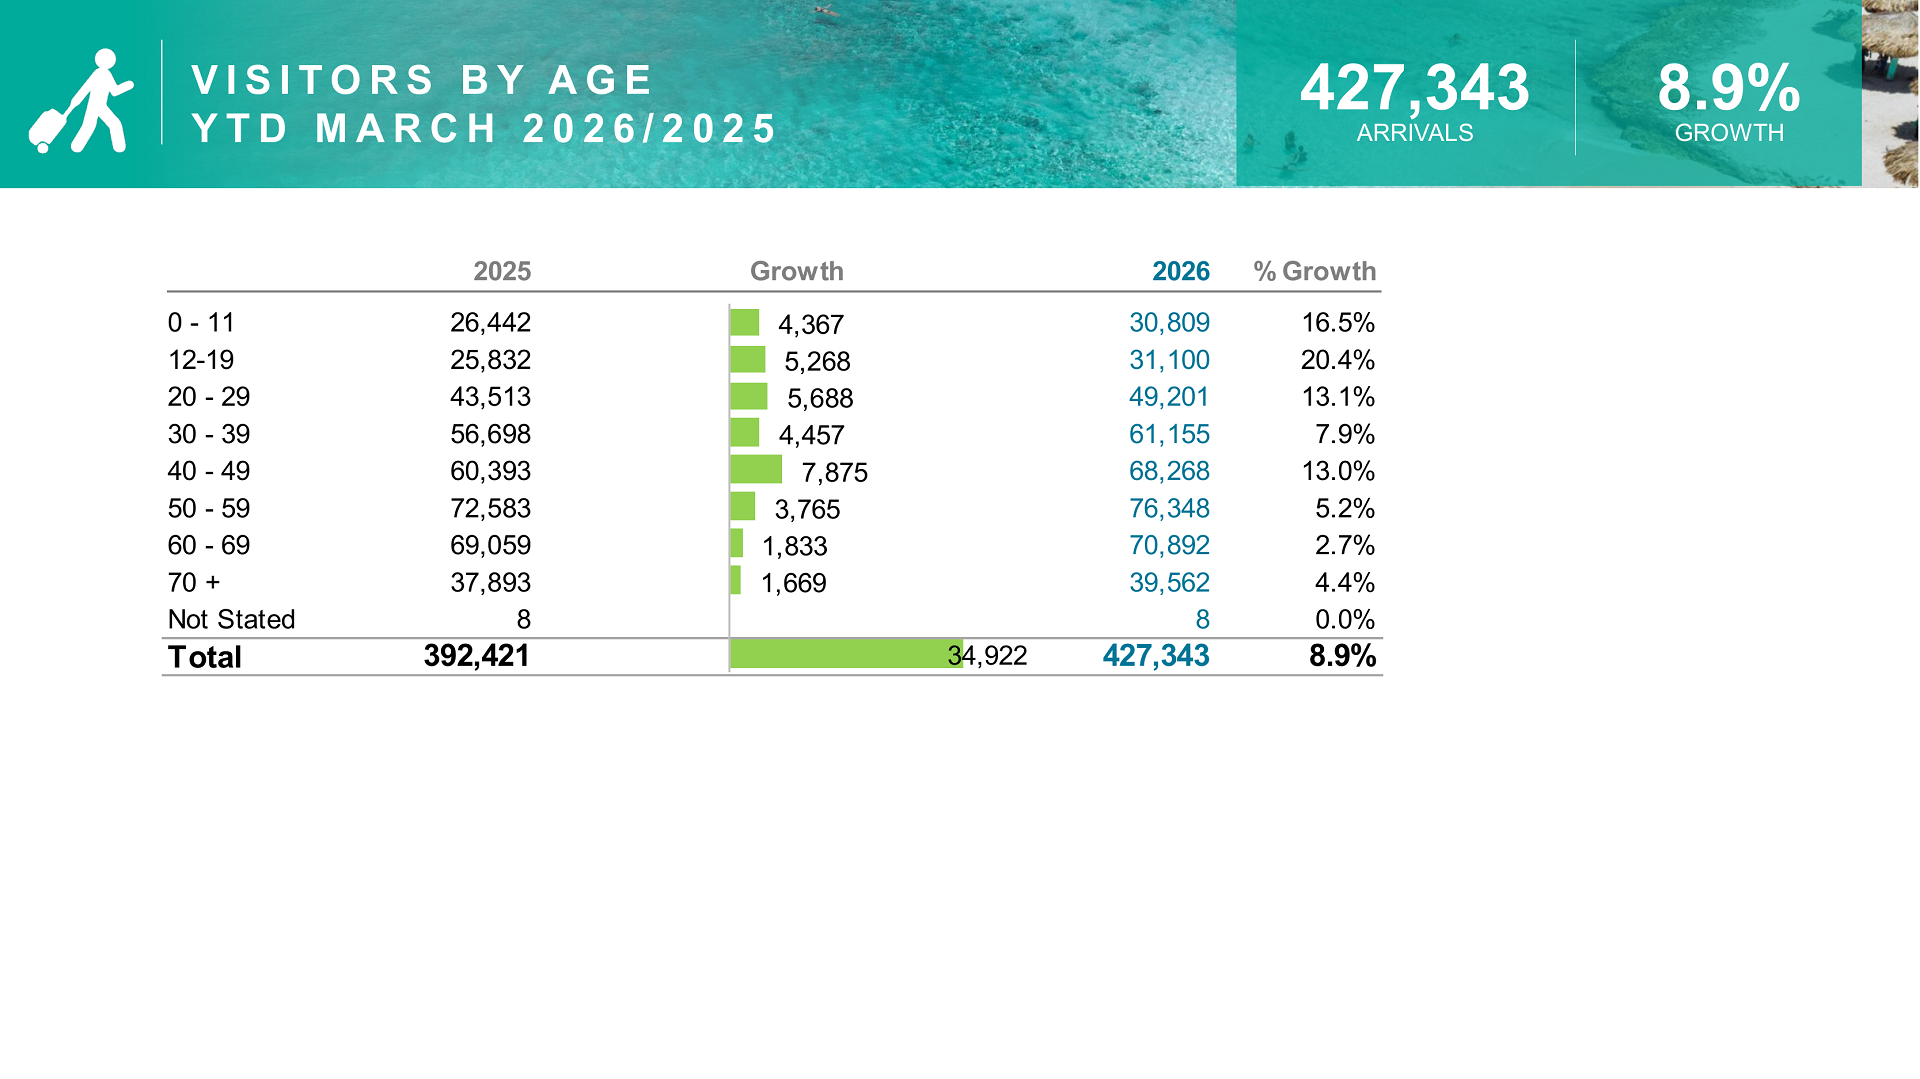
Visitor Demographics in Aruba Tourism Report March 2026
Understanding visitor demographics helps shape tourism strategies.
Age Group Trends
- Strong growth among ages 12–29
- Millennials and Gen X dominate visitor segments
- Baby Boomers remain a significant share
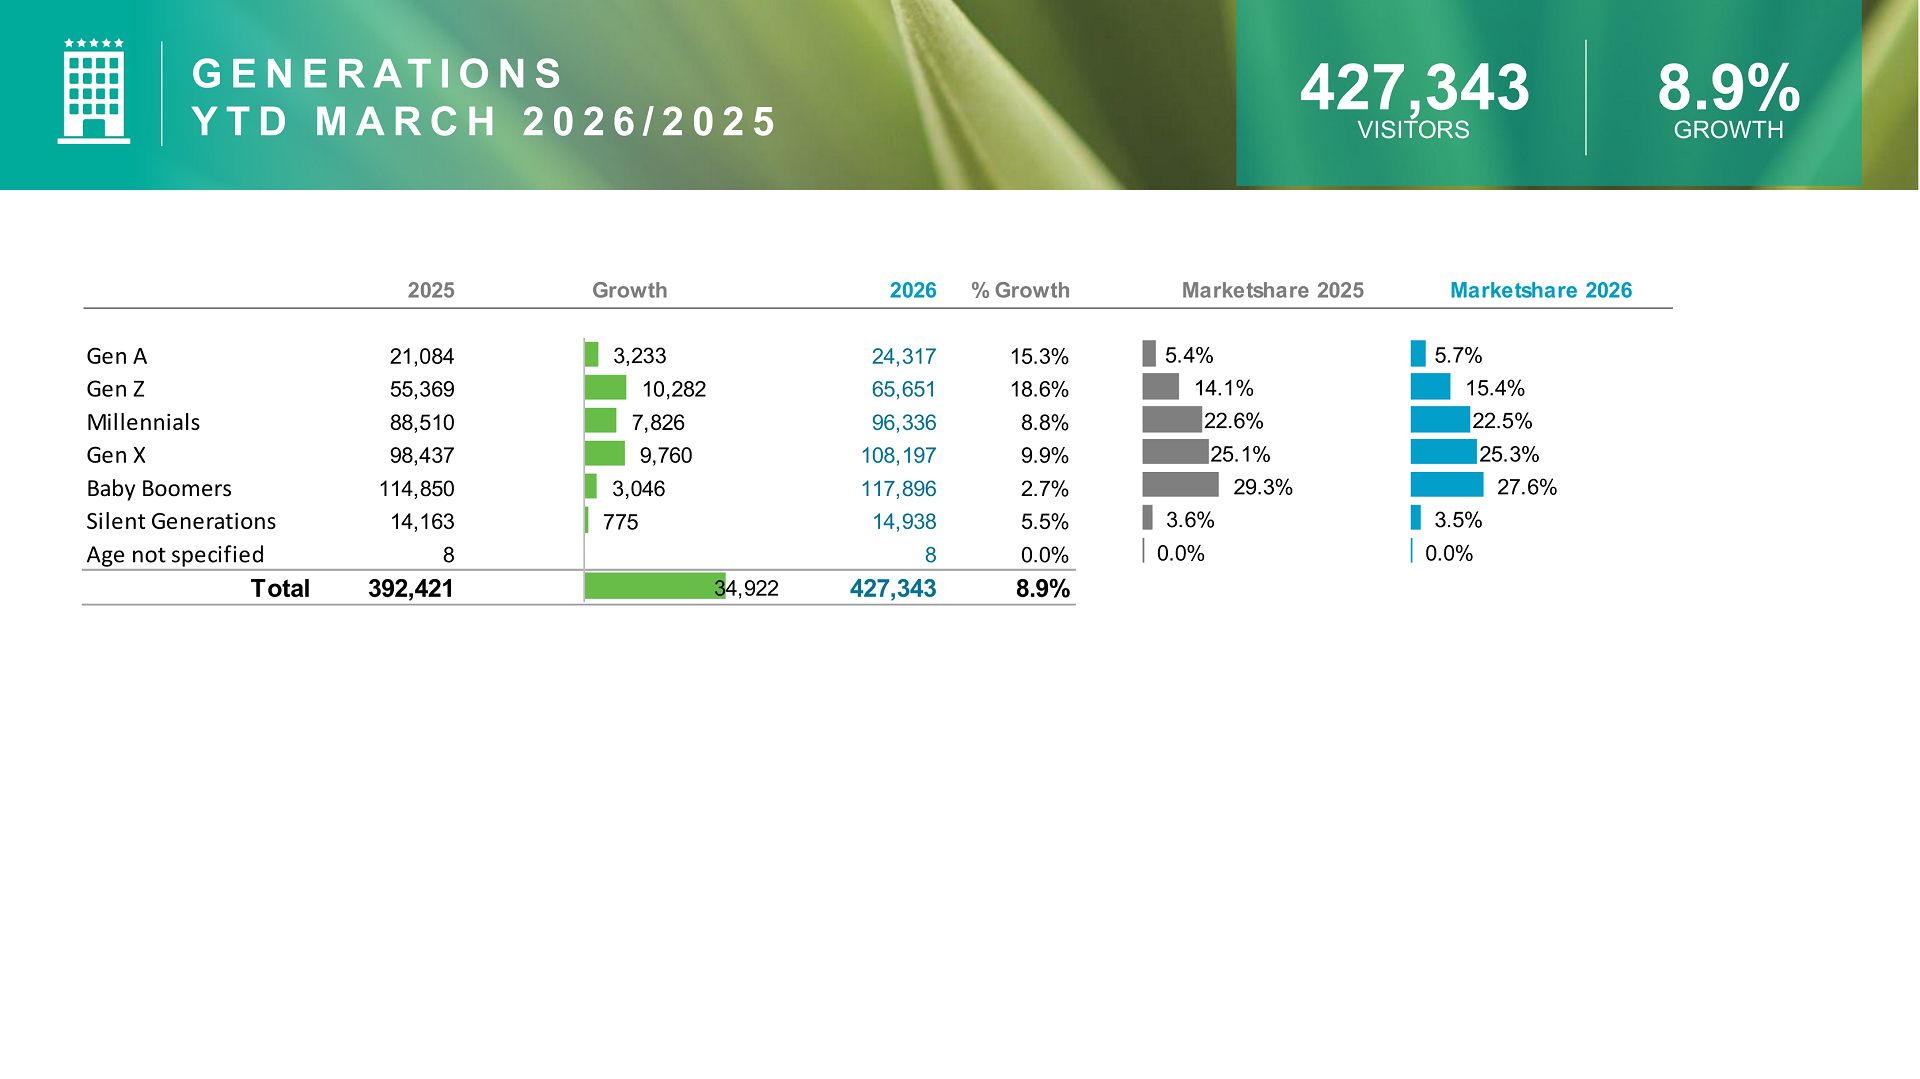
Generational Insights
- Gen Z increased by 18.6%
- Millennials remain a core market
- Gen X leads overall visitor share
These insights from the Aruba tourism report March 2026 highlight evolving travel patterns.

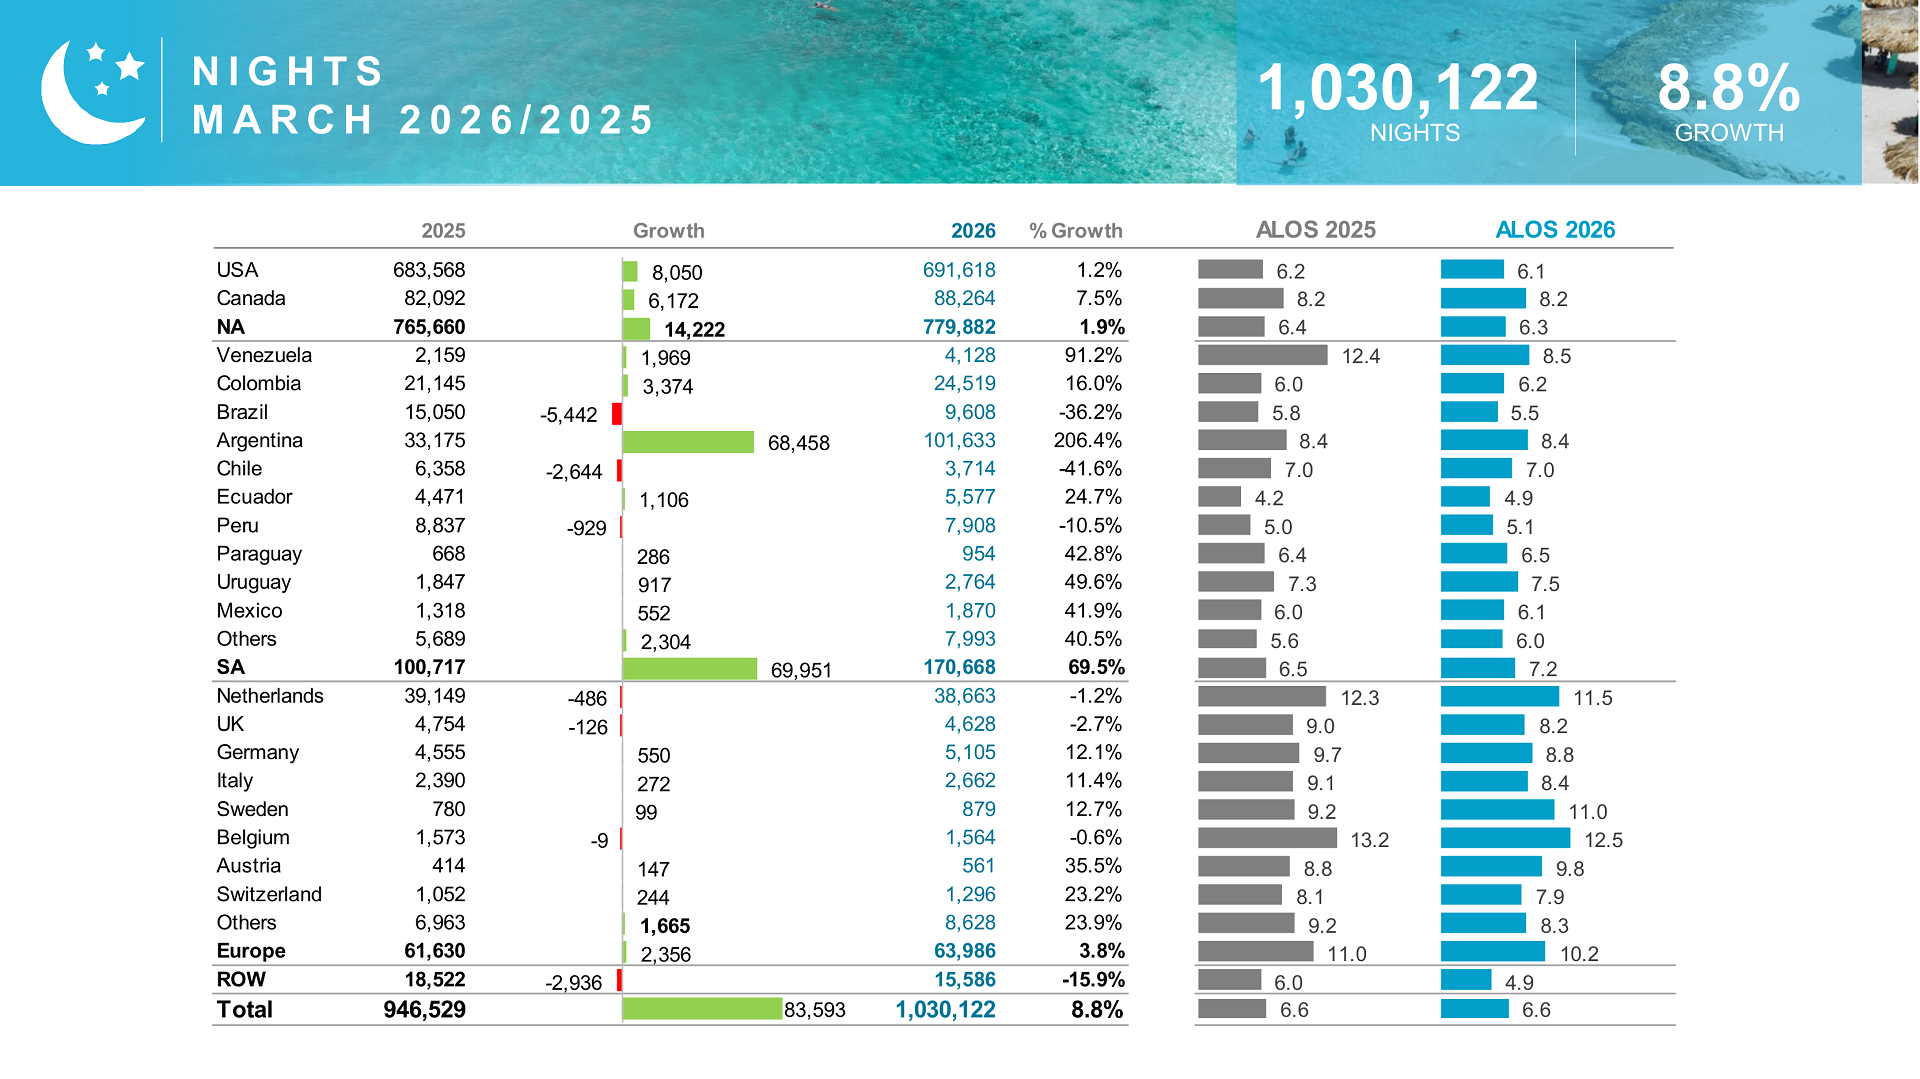
Length of Stay and Travel Behavior
The report shows that visitors stayed an average of 7 to 9 nights, depending on origin. Longer stays directly increase tourism revenue.
Why Length of Stay Matters
- Higher spending per visitor
- Greater economic impact
- Increased engagement with local businesses
Thus, the Aruba tourism report March 2026 emphasizes quality tourism over quantity.
Airline and Travel Connectivity Growth
Air connectivity continues to improve Aruba’s accessibility.
Leading Airlines Bringing Tourists
- American Airlines
- JetBlue
- Delta Airlines
- United Airlines
Additionally, new routes and increased capacity contributed to the growth seen in the Aruba tourism report March 2026.


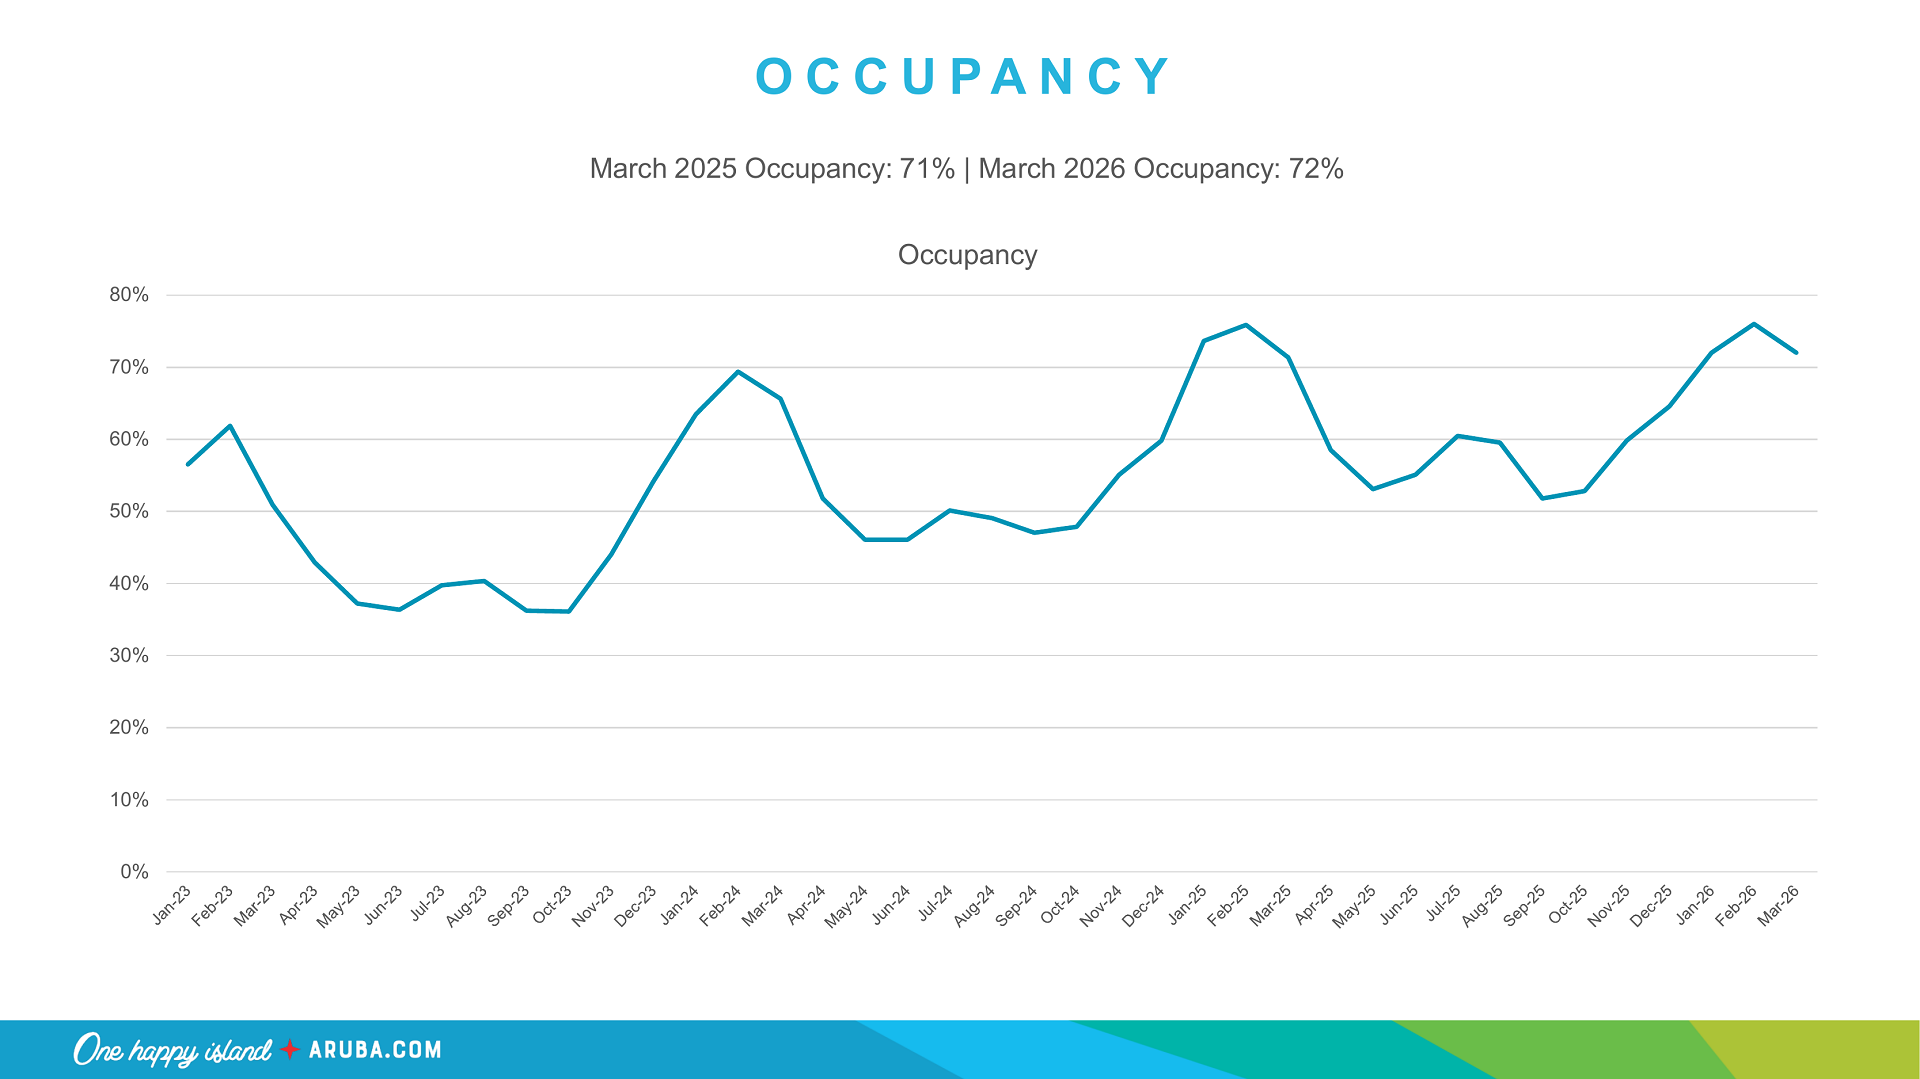
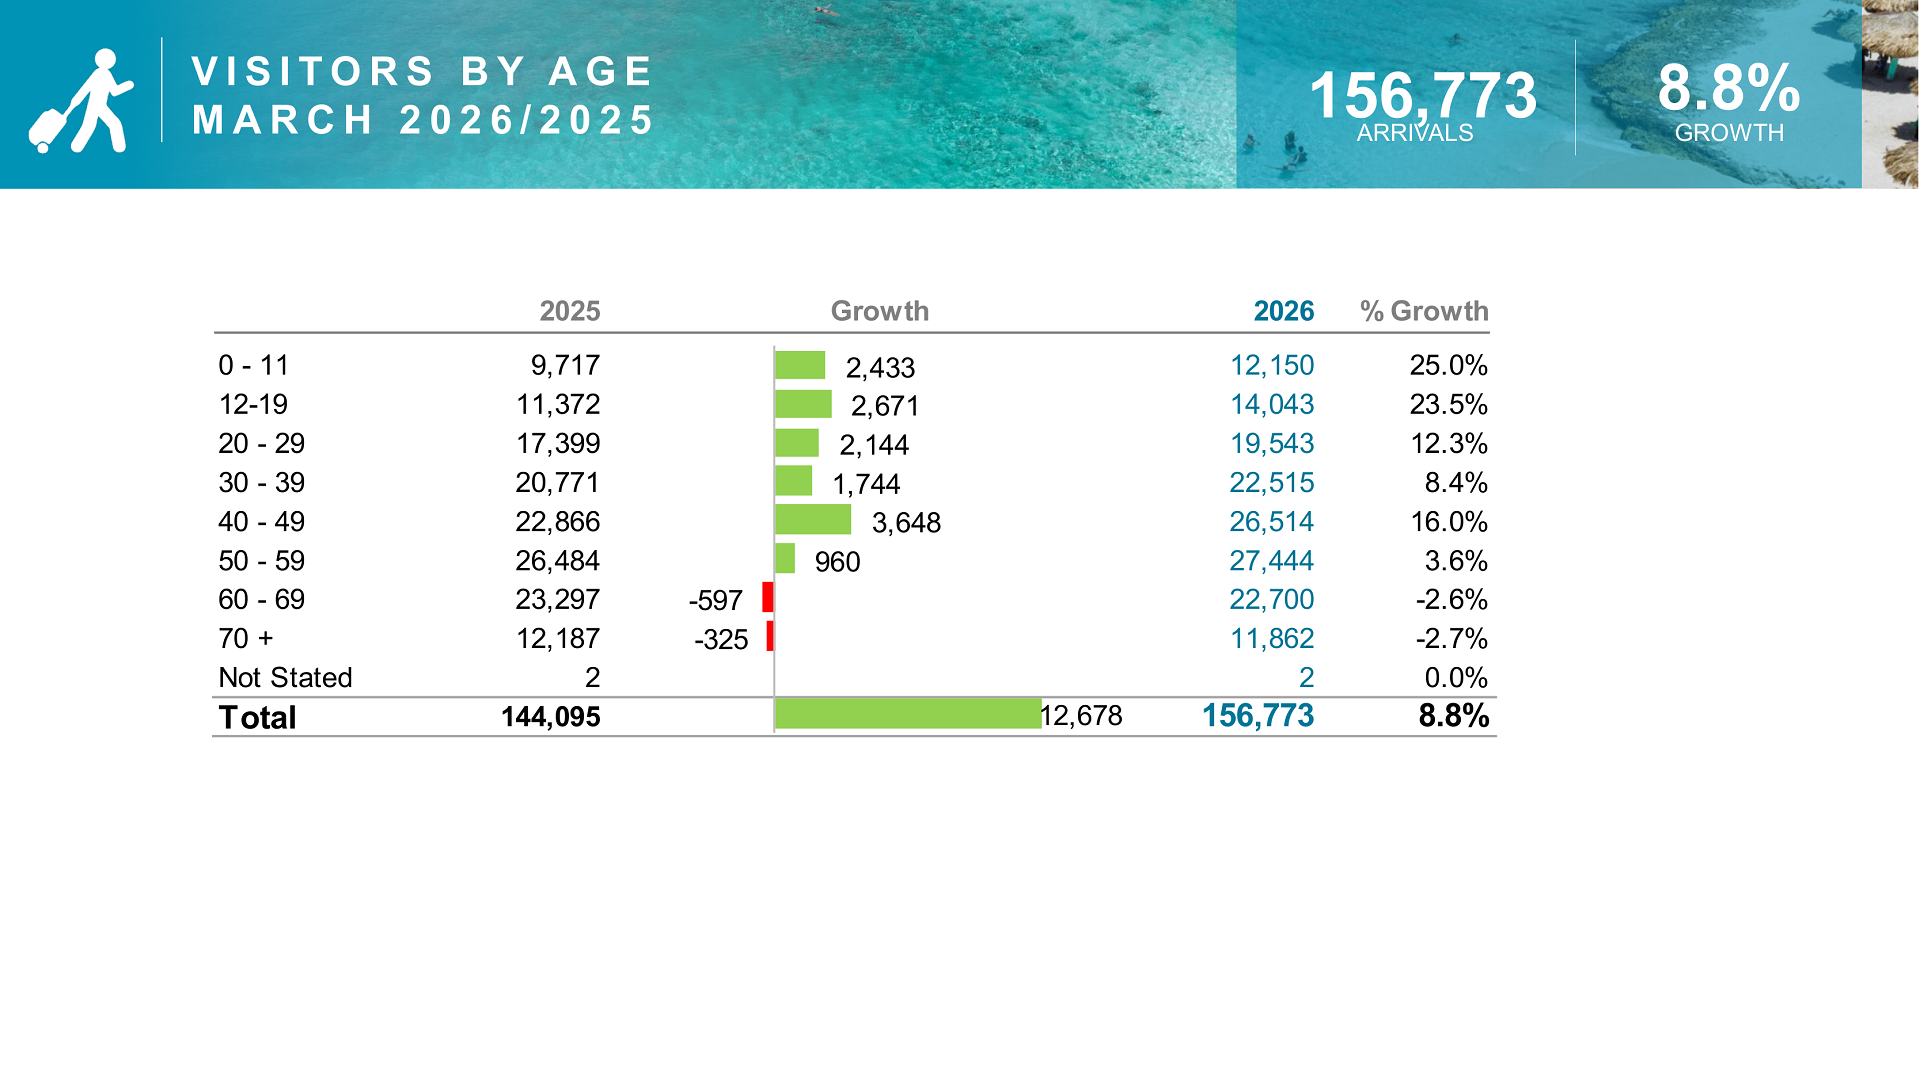
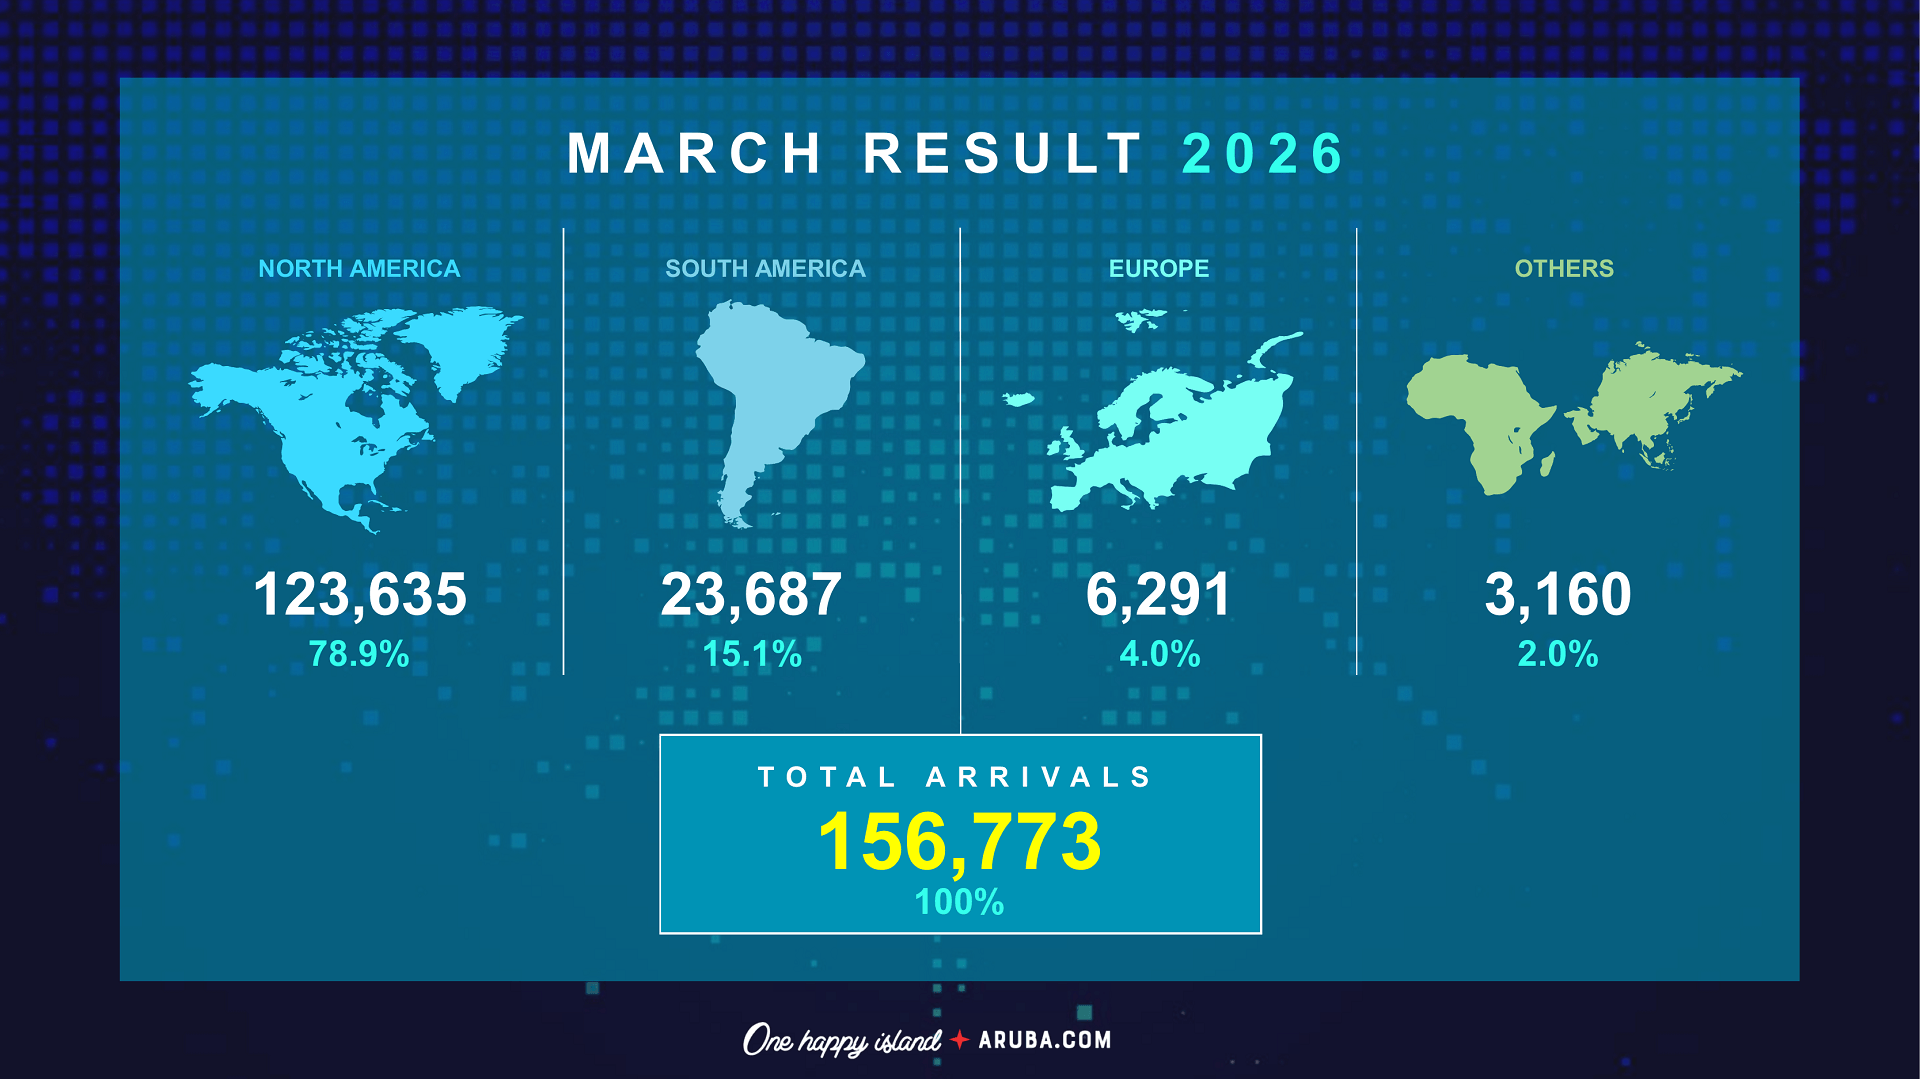
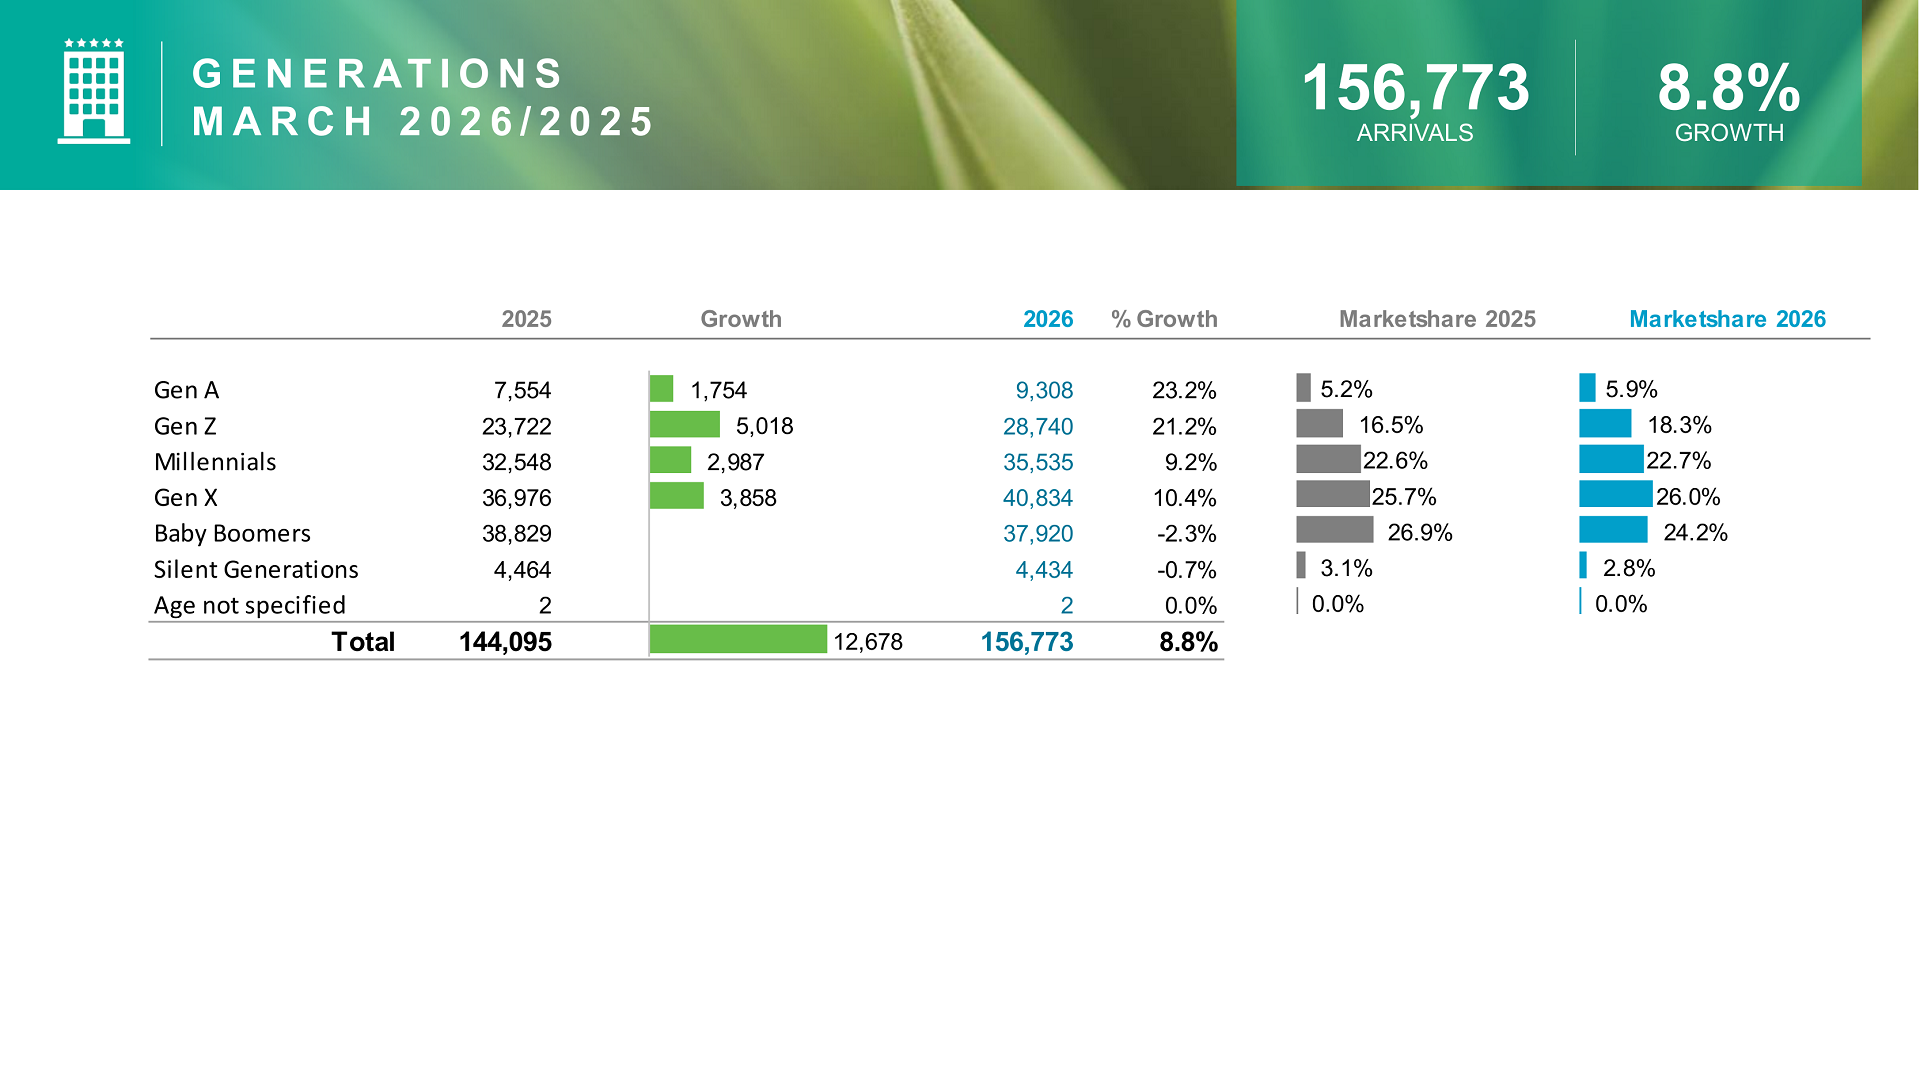
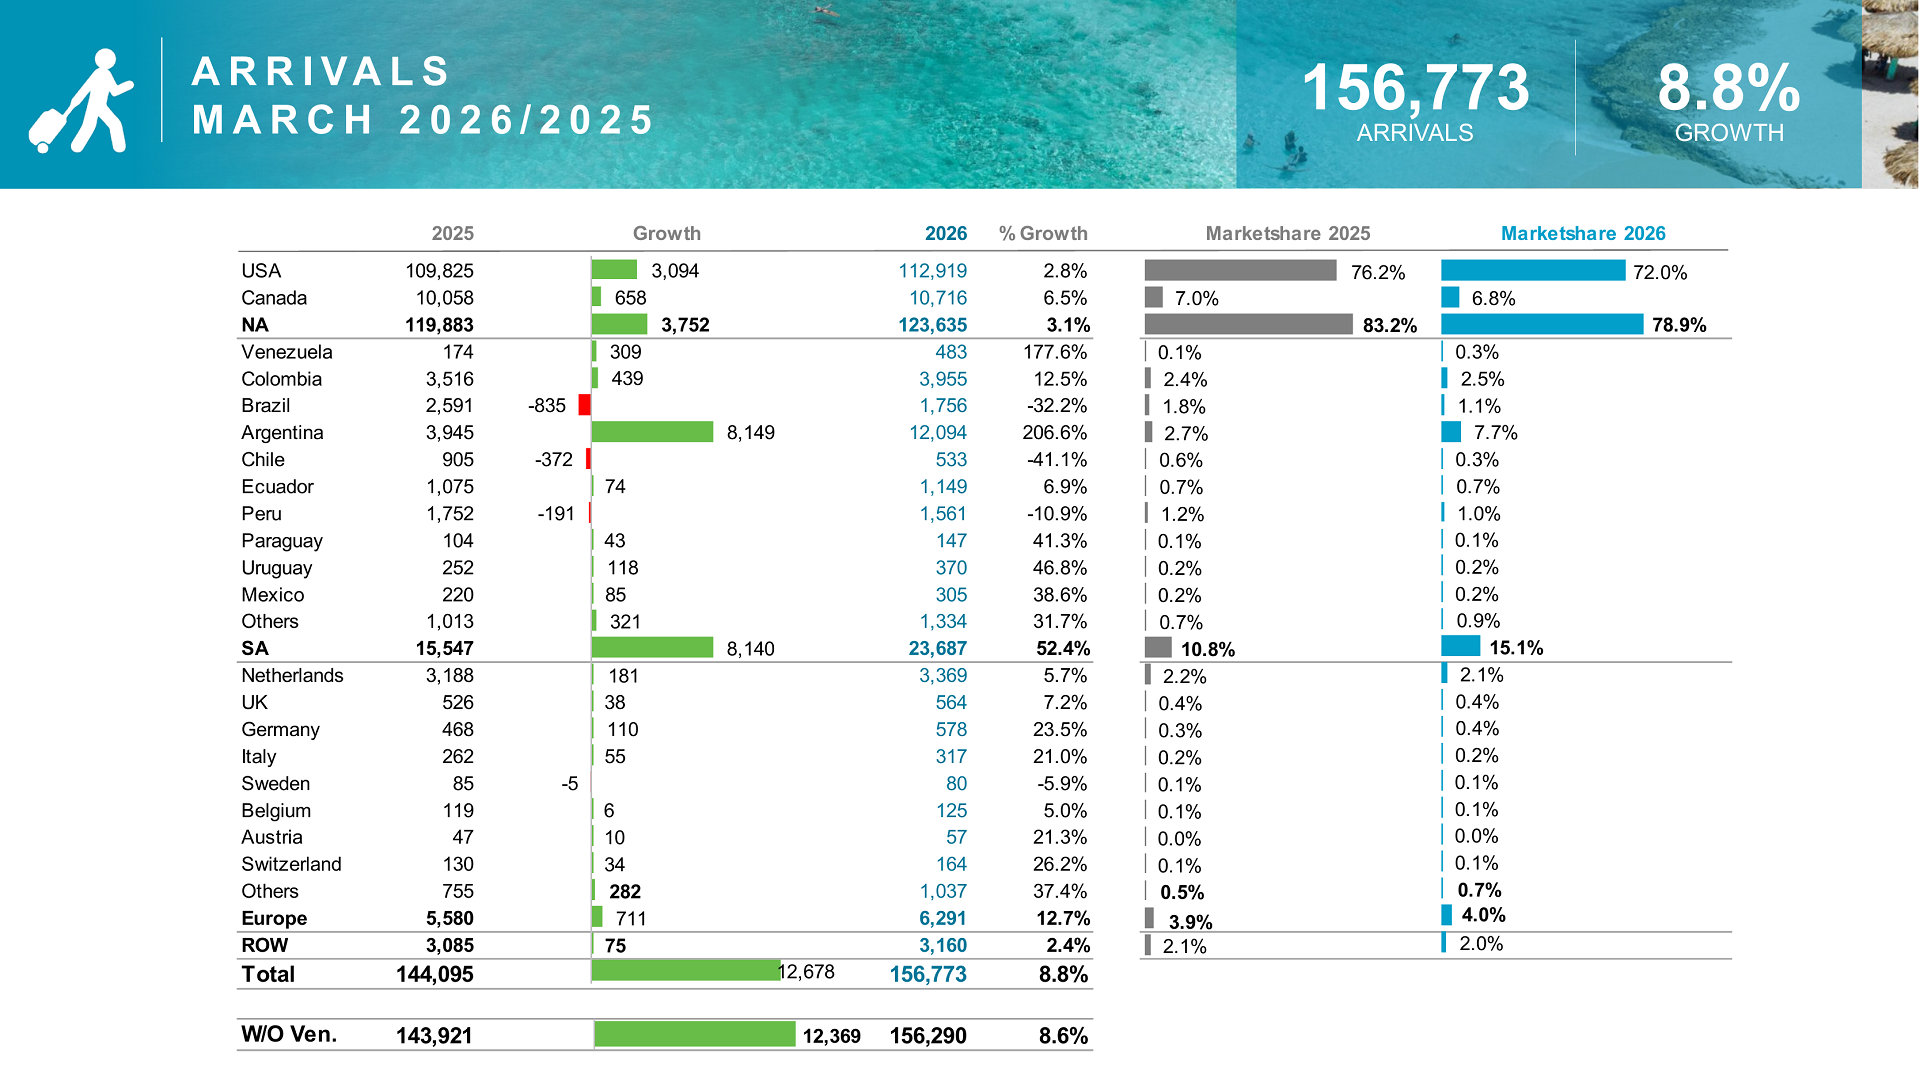
Monthly Performance – March 2026 Snapshot
March alone recorded 156,773 arrivals, reflecting an 8.8% increase compared to March 2025.
Market Contribution
- North America: 78.9% share
- South America: 15.1% share
- Europe: 4% share
This monthly snapshot reinforces trends shown in the Aruba tourism report March 2026.
Guest Satisfaction and Experience
Visitor satisfaction remains high, with a Guest Experience Index (GEI) averaging around 9.0+ ratings.
Key Satisfaction Drivers
- Cleanliness and service quality
- Location and ambiance
- Food and beverage experiences
High satisfaction levels strengthen Aruba’s reputation globally.
Future Outlook for Aruba Tourism
The Aruba tourism report March 2026 suggests continued growth ahead. Increasing visitor numbers, improved connectivity, and strong satisfaction rates indicate a positive trajectory.
Expected Trends
- Continued rise in cruise tourism
- Growth in South American markets
- Increased digital tourism marketing
Conclusion
In summary, the Aruba tourism report March 2026 presents a strong and growing tourism sector. With rising arrivals, increased spending, and expanding cruise tourism, Aruba continues to thrive as a leading Caribbean destination. Moreover, evolving visitor preferences and high satisfaction levels ensure long-term sustainability.
For more local news, visit us and follow our social media pages. Share your news with us by sending it to info@arubaonline.news.